File:T--Austin UTexas--interlabgraph.png
Size of this preview: 790 × 599 pixels. Other resolution: 316 × 240 pixels.
Original file (1,194 × 906 pixels, file size: 156 KB, MIME type: image/png)
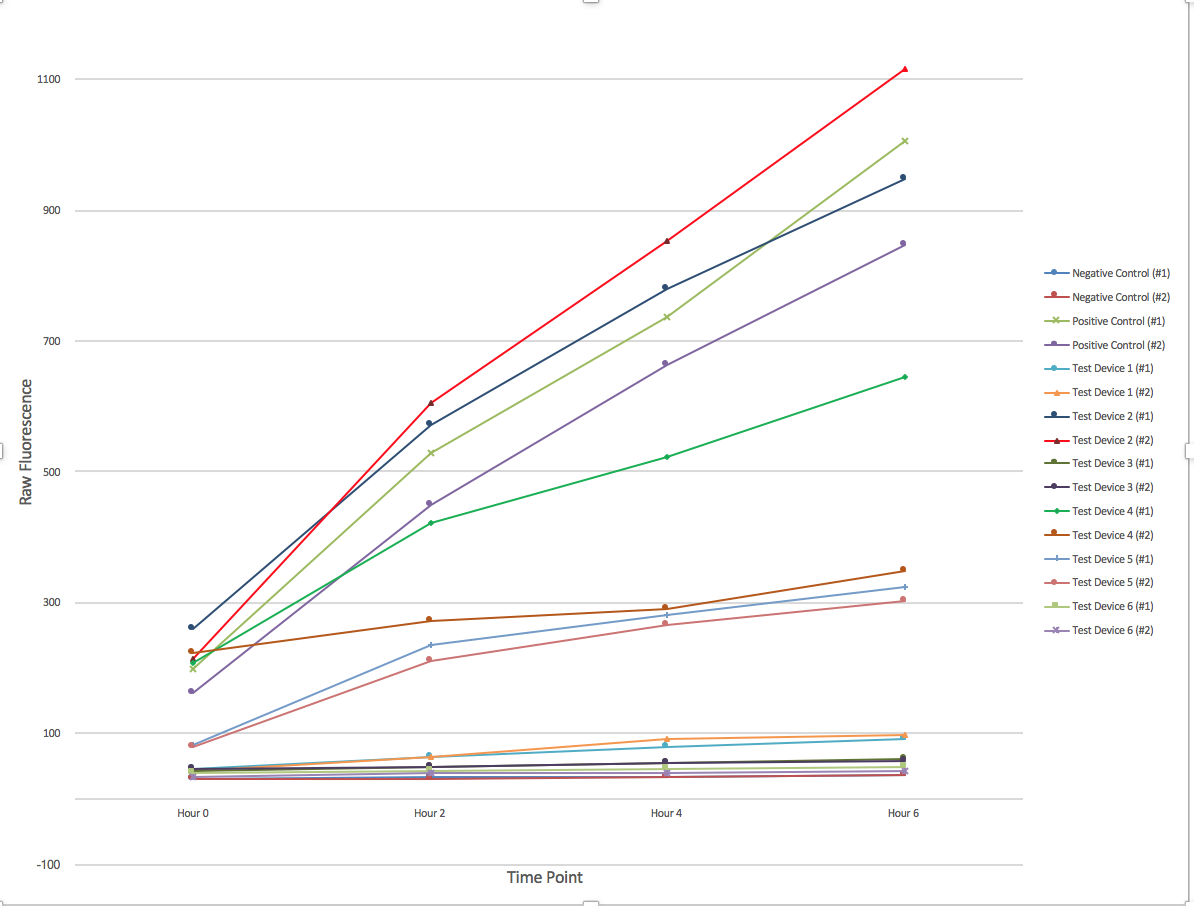
Figure 1. The change of fluorescence over time. 6 different devices were employed in duplicate with a positive and negative control. Samples were collected every 2 hours for a total of 6 hours and afterwards had their fluorescence measured using a plate reader and 96-well plate. Graph produced by Ian Overman.
File history
Click on a date/time to view the file as it appeared at that time.
| Date/Time | Thumbnail | Dimensions | User | Comment | |
|---|---|---|---|---|---|
| current | 17:21, 22 October 2017 | | 1,194 × 906 (156 KB) | Ianoverman (Talk | contribs) | Figure 1. The change of fluorescence over time. 6 different devices were employed in duplicate with a positive and negative control. Samples were collected every 2 hours for a total of 6 hours and afterwards had their fluorescence measured using a plat... |
- You cannot overwrite this file.
File usage
The following page links to this file: