Team:Bielefeld-CeBiTec/Results/unnatural base pair/uptake

Uptake

Short Summary

Uptake of unnatural nucleoside triphosphates is of major importance for the development of a semisynthetic organism. The nucleotide transporter PtNTT2 from the algae Phaeodactylum tricornutum was successfully expressed in Escherichia coli BL21(DE3) and comprehensively characterized. We designed and tested five different variants of the transporter and we demonstrated that certain variants of the transporter can facilitate uptake of iso-dCmTP and iso-dGTP from the media.

Computational Analysis of PtNTT2

Zhang et al. used an N-terminal truncated version of PtNTT2, lacking the first 65 amino acids, since they observed some kind of toxicity resulting from the native N-terminal sequence (Zhang et al., 2017). For our project, we analyzed the amino acid sequence of PtNTT2 using the prediction software Phobius (Käll et al., 2007). Using Phobius, we analyzed the signal peptide and the transmembrane topology of PtNTT2. The analysis revealed that the native signal peptide is formed by amino acids 1-30, which means that Zhang et al. removed more than the predicted native signal peptide for their experiment. The results of the prediction are shown in Figure 1. Analysis of the transmembrane topology of the transporter, which is integrated into the plastid membrane in its native algal cell, shows iterative non-cytoplasmatic, transmembrane and cytoplasmic regions. The topology might indicate, that the transporter will be integrated into the inner membrane when expressed in E. coli.

Figure 1: Results of the analysis of PtNTT2 using Phobius.
The 30 first amino acids are clearly recognized as a signal peptide. Ten transmembrane domains are predicted.

Plasmid Design

For the analysis and characterization of PtNTT2, a total of eleven plasmids were designed and cloned based on initial research and the computational analysis. The coding sequence of PtNTT2 was codon optimized using the IDT Codon Optimization Tool and ordered as two gBlocks. Using overlap extension PCR, the two gBlocks were put together and inserted into pSB1C3 using Gibson Assembly. The truncated versions of the transporter as well as the versions with new signal peptides were constructed using primers and Gibson Assembly.

Figure 2: Schematic overview of the design of the different transporter variants. The lacUV5 promotor was used together with a strong RBS (BBa_B0034) for all parts. All variants except for pSB1C3-PtNTT2 were also tagged with GFP (BBa_E0040). cMyc was used as a linker (BBa_K2201181).

All plasmids except pSB1C3-PtNTT2 were tagged with the same cMyc-GFP construct for imaging and Western Blots. cMyc was used as a linker to allow the targeting of the fusion protein with two separate antibodies, an anti-GFP antibody and the anti-cMyc antibody. The GFP part was taken from BBa_E0040, while the cMyc fragment was taken from BBa_K2201181. The fusion proteins were assembled using Gibson Assembly. A schematic overview of the design of the different plasmids is shown in Figure 2.

Table 1: Designed and cloned plasmids for the analysis and characterization of PtNTT2.

Plasmid Name BioBrick Number Characteristics
pSB1C3-PtNTT2 BBa_K2201004 Only the cds
pSB1C3-PlacUV5-PtNTT2 BBa_K2201000 cds with lacUV5 promotor and strong RBS (BBa_B0034)
pSB1C3-PlacUV5-PtNTT2(66-575) BBa_K2201001 cds with lacUV5 promotor and a strong RBS (BBa_B0034)
pSB1C3-PlacUV5-PtNTT2(31-575) BBa_K2201005 cds with lacUV5 promotor and a strong RBS (BBa_B0034), truncated version lacking the first 30 amino acids
pSB1C3-PlacUV5-pelB-SP-PtNTT2 BBa_K2201006 cds with lacUV5 promotor and a strong RBS (BBa_B0034), native signal peptide replaced with the pelB signal peptide
pSB1C3-PlacUV5-TAT-SP-PtNTT2 BBa_K2201007 cds with lacUV5 promotor and a strong RBS (BBa_B0034), native signal peptide replaced with a TAT signal peptide
pSB1C3-PlacUV5-PtNTT2-GFP BBa_K2201002 Fusion protein of BBa_ K2201000 with GFP (BBa_E0040), Myc epitope tag as linker (BBa_K2201181)
pSB1C3-PlacUV5-PtNTT2(66-575)-GFP BBa_K2201003 Fusion protein of BBa_ K2201001 with GFP (BBa_E0040), Myc epitope tag as linker (BBa_K2201181)
pSB1C3-PlacUV5-PtNTT2(31-575)-GFP BBa_K2201011 Fusion protein of BBa_K2201005 with GFP (BBa_E0040), Myc epitope tag as linker (BBa_K2201181)
pSB1C3-PlacUV5-pelB-SP-PtNTT2-GFP BBa_K2201012 Fusion protein of BBa_K2201006 with GFP (BBa_E0040), Myc epitope tag as linker (BBa_K2201181)
pSB1C3-PlacUV5-TAT-SP-PtNTT2-GFP BBa_K2201013 Fusion protein of BBa_K2201007 with GFP (BBa_E0040), Myc epitope tag as linker (BBa_K2201181)

Cultivations of the Different PtNTT2 Variants

Given that Zhang et al., 2017 reported some kind of toxicity resulting from the N-terminal sequence of PtNTT2, we first investigated if we could also observe the same toxicity associated with the N-terminal sequence. We also tested whether our own versions of the transporter results in better growth and reduced toxicity compared to the native transporter. Therefore, after cloning the plasmids in E. coli DH5α and verifying the correct assembly via sequencing, all plasmids were transformed into E. coli BL21(DE3). The presence of the correct plasmids was again verified by colony PCR. The first cultivations were carried out in shake flasks in LB media. A total cultivation volume of 50 mL was used. The cultures were incubated at 37 °C and 180 rpm in 500 mL shake flasks. All cultures were inoculated with an OD600 of 0.01. OD600 was measured every hour during lag and stationary phase and every 30 minutes during the exponential phase. The optical density was measured using an Eppendorf Photometer and standard cuvettes. E. coli BL21(DE3) without a plasmid and E. coli BL21(DE3) harboring pSB1C3-PtNTT2 were used as negative controls. Two biological replicates of each strain were tested and three technical replicates were measured for each timepoint.

Figure 3: Shake flask cultivation of all PtNTT2 variants. E. coli BL21(DE3) and E. coli BL21(DE3) pSB1C3-PtNTT2 (BBa_K2201004), not expressing PtNTT2, were used as negative controls. Two biological replicates of each strain were cultivated and three technical replicates taken for each measurement. A clear difference in the growth rates can be observed, with E. coli BL21(DE3) pSB1C3-PlacUV5-PtNTT2 (BBa_K2201000) and E. coli BL21(DE3) pSB1C3-PlacUV5-TAT-SP-PtNTT2 (BBa_K2201007) showing the weakest growth. Both strains also show the longest lag phase, which is nearly twice as long as the lag phase of E. coli BL21(DE3). E. coli BL21(DE3) pSB1C3-PlacUV5-PtNTT2(66-575) (BBa_K2201001) and E. coli BL21(DE3) pSB1C3-PlacUV5-pelB-SP-PtNTT2 (BBa_K2201006) show the best growth of all PtNTT2 variants, reaching the highest OD600.

E. coli BL21(DE3) without any plasmid shows the best growth, with the highest specific growth rate and the highest final OD600 of 5.178 ± 0.046. The second negative control, E. coli BL21(DE3) harboring pSB1C3-PtNTT2 (BBa_K2201004) reached the second highest OD600 with 4.638 ± 0.029. Of the functional PtNTT2 variants, strains harboring pSB1C3-PlacUV5-PtNTT2(66-575) (BBa_K2201001) and pSB1C3-PlacUV5-pelB-SP-PtNTT2 (BBa_K2201006) reached the highest ODs with 4.397 ± 0.062 and 4.171 ± 0.051, respectively. E. coli BL21(DE3) pSB1C3-PlacUV5-PtNTT2(31-575) (BBa_K2201005) showed similar growth to the two previous strains during the lag phase and early exponential phase, but reaching a lower OD600 of 3.802 ± 0.135. E. coli BL21(DE3) pSB1C3-PlacUV5-PtNTT2 (BBa_K2201000) and E. coli BL21(DE3) pSB1C3-PlacUV5-TAT-SP-PtNTT2 (BBa_K2201007) grew substantially weaker compared to all previous strains, with a lag phase nearly four hours long and final ODs of 2.499 ± 0.134 and 2.735 ± 0.150, respectively. The difference in growth between the two negative controls can be explained by the metabolic burden caused by plasmid replication and expression of the chloramphenicol resistance. Therefore, E. coli BL21(DE3) pSB1C3-PtNTT2 (BBa_K2201004) is the more accurate control, since all samples contain the same plasmid backbone and were also grown in LB media supplemented with chloramphenicol. If not indicated otherwise, pSB1C3-PtNTT2 (BBa_K2201004) was used as the main reference. The difference in growth between strains expressing the native, full length transporter and the truncated version PtNTT2(66-575), observed by Zhang et al. 2017, could also be shown. This negative effect might be associated with the native signal peptide of PtNTT2, which E. coli might not be able to process correctly. Another explanation for the weak growth could be that the native transporter variant has a higher activity compared to the other variants. If the activity is too high, this might lead to a toxic effect and to the observed weak growth. Given that all transporter variants were expressed with the same promotor, this difference in growth cannot be explained by differences in the expression.

Table 2: Final OD600 of all cultures. The highest OD600 was reached by the wildtype E. coli BL21(DE3), the lowest by E. coli BL21(DE3) pSB1C3-PlacUV5-PtNTT2.

Strain Final OD600 [-]
E. coli BL21(DE3) 5.178 ± 0.046
E. coli BL21(DE3) pSB1C3-PtNTT2 4.638 ± 0.029
E. coli BL21(DE3) pSB1C3-PlacUV5-PtNTT2 2.499 ± 0.134
E. coli BL21(DE3) pSB1C3-PlacUV5-PtNTT2(66-575) 4.397 ± 0.062
E. coli BL21(DE3) pSB1C3-PlacUV5-PtNTT2(31-575) 3.802 ± 0.135
E. coli BL21(DE3) pSB1C3-PlacUV5-pelB-SP-PtNTT2 4.171 ± 0.051
E. coli BL21(DE3) pSB1C3-PlacUV5-TAT-SP-PtNTT2 2.735 ± 0.150

To determine the maximum specific growth rate (µmax), the natural logarithm of the OD600 values was plotted against the cultivation time. The slope of the linear regression through the exponential phase gives µmax. The graphical determination of µmax for the shake flask cultivation is shown in Figure 4

Figure 4: Graphical determination of µmax. The highest specific growth rate was determined for each culture by plotting the natural logarithm of OD600 against the cultivation time. The slope of the linear regression through the exponential phase gives µmax.

The highest specific growth rate can be observed for the negative controls E. coli BL21(DE3) and E. coli BL21(DE3) pSB1C3-PtNTT2 with values of 1.201 ± 0.070 h-1 and 1.212 ± 0.029 h-1, respectively. The lowest specific growth rate could be observed for E. coli BL21(DE3) pSB1C3-PlacUV5-TAT-SP-PtNTT2 with a value of 0.946 ± 0.030 h-1. Based on the specific growth rate, the minimal doubling time was calculated using the following equation:

(1)


With td being the doubling time in hours and µ the specific growth rate in h-1. The maximum specific growth rates and minimal doubling times are show in Table 3 for all cultures.

Table 3: Maximum specific growth rates and minimum doubling times for all cultures.

Strain µmax [h-1] td [h]
E. coli BL21(DE3) 1.201 ± 0.070 0.577 ± 0.058
E. coli BL21(DE3) pSB1C3-PtNTT2 1.212 ± 0.029 0.572 ± 0.024
E. coli BL21(DE3) pSB1C3-PlacUV5-PtNTT2 0.978 ± 0.033 0.709 ± 0.034
E. coli BL21(DE3) pSB1C3-PlacUV5-PtNTT2(66-575) 1.194 ± 0.026 0.581 ± 0.022
E. coli BL21(DE3) pSB1C3-PlacUV5-PtNTT2(31-575) 1.143 ± 0.045 0.606 ± 0.039
E. coli BL21(DE3) pSB1C3-PlacUV5-pelB-SP-PtNTT2 1.189 ± 0.028 0.583 ± 0.024
E. coli BL21(DE3) pSB1C3-PlacUV5-TAT-SP-PtNTT2 0.946 ± 0.030 0.733 ± 0.032

These results clearly show that expression of PtNTT2 leads to a reduced final cell density and slower growth. Furthermore, the different variants of PtNTT2 differ highly, indicating that some variants of PtNTT2 negatively affect the growth rate and final cell density.

Microcultivations of the Different PtNTT2 Variants

Due to the high price of unnatural nucleoside triphosphates, performing experiments such as cultivations in a small volume is desirable. Therefore, we validated whether cultivations in micro well plates can achieved the same results as cultivations performed in shake flasks and optimized the method. The optimal conditions for cultivations in a small volume were determined as follows: 12 well plates with a cultivation volume of 1 mL, 37 °C and 600 rpm. To analyze the growth of the different PtNTT2 variants in a micro cultivation, the shake flask cultivation was repeated in a 12 well plate. All cultures were inoculated with an OD600 of 0.1. Three biological replicates of each strain were tested and three technical replicates were measured at each time point. The results are shown in Figure 5.

Figure 5: Microcultivation of all PtNTT2 variantsE. coli BL21(DE3) and E. coli BL21(DE3) pSB1C3-PtNTT2 (BBa_K2201004) were again used as negative controls. The same growth pattern as in the shake flask cultivation can be observed, with E. coli BL21(DE3) pSB1C3-PlacUV5-pelB-SP-PtNTT2, E. coli BL21(DE3) pSB1C3-PlacUV5-PtNTT2(66-575) reaching the highest ODs, followed by E. coli BL21(DE3) pSB1C3-PlacUV5-PtNTT2(31-575), E. coli BL21(DE3) pSB1C3-PlacUV5-TAT-SP-PtNTT2 and E. coli BL21(DE3) pSB1C3-PlacUV5-PtNTT2.

The results of the micro cultivations show the same growth pattern observed in the shake flask cultivations. E. coli BL21(DE3) and E. coli BL21(DE3) pSB1C3-PtNTT2 reached the highest ODs with 5.487 ± 0.038 and 4.337 ± 0.01, respectively. E. coli BL21(DE3) pSB1C3-PlacUV5-pelB-SP-PtNTT2 reached a final OD600 of 4.110 ± 0.005, followed by E. coli BL21(DE3) pSB1C3-PlacUV5-PtNTT2(66-575) with a final OD600 of 4.035 ± 0.051. E. coli BL21(DE3) pSB1C3-PlacUV5-PtNTT2(31-575) reached the third highest OD600 of allPtNTT2 variants with a final OD600 of 3.865 ± 0.008. The lowest final ODs were again reached by E. coli BL21(DE3) pSB1C3-PlacUV5-TAT-SP-PtNTT2 and E. coli BL21(DE3) pSB1C3-PlacUV5-PtNTT2, reaching a final OD600 of 2.28 ± 0.337 and 1.623 ± 0.481.

Therefore, we were able to demonstrate that the results of the shake flask cultivations can be transferred to a smaller format, such as a micro cultivation in 1 mL. The reproduction of the results in a 50 times smaller volume is important for further experiments.

Table 4: Final OD600 of all cultures.
The highest OD600 was reached by the wildtype E. coli BL21(DE3) with 5,487 ± 0.038, the lowest by E. coli BL21(DE3) pSB1C3-PlacUV5-PtNTT2 with 1.623 ± 0.481.

Strain Final OD600 [-]
E. coli BL21(DE3) 5.487 ± 0.038
E. coli BL21(DE3) pSB1C3-PtNTT2 4.337 ± 0.010
E. coli BL21(DE3) pSB1C3-PlacUV5-PtNTT2 1.623 ± 0.481
E. coli BL21(DE3) pSB1C3-PlacUV5-PtNTT2(66-575) 4.035 ± 0.051
E. coli BL21(DE3) pSB1C3-PlacUV5-PtNTT2(31-575) 3.865 ± 0.008
E. coli BL21(DE3) pSB1C3-PlacUV5-pelB-SP-PtNTT2 4.110 ± 0.005
E. coli BL21(DE3) pSB1C3-PlacUV5-TAT-SP-PtNTT2 2.280 ± 0.337

Like for the shake flask cultivation, µmax was determined graphically (Figure 6). Bases on the obtained values, the minimum doubling time was calculated. The results are summarized in Table 5.

Figure 6: Graphical determination of the maximum specific growth rate µmax for the microcultivations.

All cultures showed extended doubling times when compared to the shake flask cultivations. This is not surprising, since the oxygen transfer is much better in shake flasks compared to well plates. Nonetheless, similar final OD600 values were reached in the micro cultivations. Furthermore, the same differences in growth between the different strains can be observed, with E. coli BL21(DE3) pSB1C3-PlacUV5-PtNTT2 and E. coli BL21(DE3) pSB1C3-PlacUV5-TAT-SP-PtNTT2 growing the weakest.

Table 5: Maximum specific growth rate and minimum doubling time for all cultures cultivated in 12 well plates.

Strain µmax [h-1] td [h]
E. coli BL21(DE3) 1.059 ± 0.143 0.655 ± 0.135
E. coli BL21(DE3) pSB1C3-PtNTT2 1.016 ± 0.133 0.682 ± 0.131
E. coli BL21(DE3) pSB1C3-PlacUV5-PtNTT2 0.829 ± 0.071 0.836 ± 0.086
E. coli BL21(DE3) pSB1C3-PlacUV5-PtNTT2(66-575) 1.023 ± 0.105 0.678 ± 0.103
E. coli BL21(DE3) pSB1C3-PlacUV5-PtNTT2(31-575) 1.021 ± 0.096 0.679 ± 0.094
E. coli BL21(DE3) pSB1C3-PlacUV5-pelB-SP-PtNTT2 1.047 ± 0.097 0.662 ± 0.093
E. coli BL21(DE3) pSB1C3-PlacUV5-TAT-SP-PtNTT2 0.924 ± 0.113 0.750 ± 0.122

To investigate the effect of smaller well plates, a cultivation of two of our strains was performed by the iGEM team UNIFI from Florence, Italy. The team cultivated E. coli BL21(DE3) pSB1C3-PlacUV5-PtNTT2 and E. coli BL21(DE3) pSB1C3-PlacUV5-PtNTT2(66-575) in a 96 well plate. LB media was used as a reference. The cultivation was performed at 37 °C and 130 rpm in 3 mL of LB media. Three biological replicates were cultivated and measured at each time point. The results are shown in Figure 7.

Figure 7: Microcultivation in a 96 well plate performed by iGEM team UNIFI from Florence, Italy.
E. coli BL21(DE3) pSB1C3-PlacUV5-PtNTT2 and E. coli BL21(DE3) pSB1C3-PlacUV5-PtNTT2(66-575) were cultivated in a total volume of 3 mL at 37 °C and 130 rpm. The growth difference between the two strains observed in previous cultivations could also be observed in this experiment carried out by the team from Florence. E. coli BL21(DE3) pSB1C3-PlacUV5-PtNTT2 reached a final OD600 of 0.329 ± 0.037 while E. coli BL21(DE3) pSB1C3-PlacUV5-PtNTT2(66-575) reached a final OD600 of 0.664 ± 0.033.

The results obtained by iGEM team UNIFI validate our results, since the same difference in growth can be observed between the truncated version PtNTT2(66-575) and PtNTT2. Also in a 96 well plate, E. coli BL21(DE3) pSB1C3-PlacUV5-PtNTT2 reached only 49.5 % of the final cell density of E. coli BL21(DE3) pSB1C3-PlacUV5-PtNTT2(66-575) (40.2 % for the cultivation carried out in 12 well plates). After 27 hours, the final OD600 of the strain carrying the full-length version of PtNTT2 was 0.329 ± 0.037, while the final OD600 of the strain expressing the truncated version PtNTT2(66-575) was 0.664 ± 0.033. These results clearly indicate that it is highly beneficial for higher cell densities and better growth to cultivate in larger well plates. Furthermore, shaking at higher frequencies can improve the growth, as show in the validation of microcultivations. The graphical determination of the maximum specific growth rates is shown in Figure 8.

Figure 8: Graphical determination of the maximum specific growth rates for the cultivations carried out in 96 well plates by the iGEM team UNIFI.

Graphical determination of the specific growth rates and the minimum doubling times revealed substantially weaker growth of the cultures in 96 well plates compared to 12 well plates or shake flasks. E. coli BL21(DE3) pSB1C3-PlacUV5-PtNTT2(66-575) reached the highest specific growth rate with 0,11 ± 0,002 h-1. E. coli BL21(DE3) pSB1C3-PlacUV5-PtNTT2 showed much weaker growth with a maximum specific growth rate of 0,041 ± 0,004 h-1. The maximum specific growth rates and minimum doubling times are summarized in Table 6.

Table 6: Maximum specific growth rate and minimum doubling time for all cultures cultivated in 12 well plates.

Strain µmax [h-1] td [h]
E. coli BL21(DE3) 0.042 ± 0.004 16.504 ± 0.095
E. coli BL21(DE3) pSB1C3-PtNTT2 0.110 ± 0.002 6.301 ± 0.018
Compared to the shake flask cultivations and the micro cultivations in 12 well plates, far lower maximum specific growth rates and much higher minimum doubling times were reached.

Verification of the Function of PtNTT2

To verify that PtNTT2 fulfills its desired function, a simple experiment was designed. Usually, the function of nucleotide transporters is determined using radioactively labeled nucleotides. Given that we did not want to work with radioactively labeled nucleotides and that not every lab and iGEM team has access to suitable equipment, we focused on verifying the function using a less dangerous and better accesible method.

Under phosphate starvation, E. coli secretes phosphatases to utilize the phosphates from nucleotides as phosphate source. On the other hand, cells expressing PtNTT2 and integrating it into the inner membrane should be able to take up nucleoside triphosphates directly. By taking up nucleoside triphosphates directly from the media, the cells can directly take up three phosphates and the nucleobase. Given that the uptake of NTPs by PtNTT2 is facilitated by counter exchange of ATP, ATP is exported and consequently converted to AMP by extracellular phosphatases.

Figure 9: Proposed function of PtNTT2. . A) ATP is exported in presence of the unnatural nucleotides iso-dCmTP and iso-dGTP, leading to a constant loss of ATP, negatively influencing growth. B) If the media is supplemented with ATP in slightly higher concentrations than the intracellular concentration, ATP is likely taken up in exchange for ATP, ADP as well as other NTPs. A beneficial effect of expression of the transporter on the growth of the cells is achieved due to a small net uptake of ATP.C) In case of much higher extracellular concentrations compared to the intracellular concentration of ATP, ATP will be taken up efficiently in exchange for NTPs, ADP and AMP. This would lead to a net uptake of ATP, but a net loss of NTPs, leading to reduced growth.

The experiment we designed consists of two parts and is based on the disability of E. coli to take up nucleoside triphosphates from the media. The first part consists of cultivations performed in MOPS minimal media which is supplemented with either 1.32 mM K2HPO4 or 1 mM ATP. Calculation of the Odds-ratio as shown in equation (A) allows to evaluate how beneficial expression of PtNTT2 is for the cell if extracellular ATP or unnatural base pairs represent the sole phosphate source. The second part of the experiment consists of liquid chromatography – mass spectrometry (LC-MS) measurements for the quantification of AMP in the supernatant. Combined, these methods provide a way to investigate the function of PtNTT2 without the application of radioactively labeled nucleotides. Furthermore, these experiments might also serve as a way for future iGEM teams to easily characterize the function of membrane proteins.

Figure 9 shows the proposed function of PtNTT2. In presence of the unnatural nucleotides iso-dCmTP and iso-dGTP, ATP is exported. Therefore, uptake of iso-dCmTP and iso-dGTP leads to a constant loss of ATP, negatively influencing growth. If the media is supplemented with ATP in slightly higher concentrations than the intracellular concentration, ATP is likely taken up in exchange for ATP, ADP as well as other NTPs. This would lead to a small net uptake of ATP, and therefore to a beneficial effect of expression of the transporter on the growth of the cells. In case of much higher extracellular concentrations compared to the intracellular concentration of ATP, ATP will be taken up efficiently in exchange for NTPs, ADP and AMP. This would lead to a net uptake of ATP, but a net loss of NTPs, leading to reduced growth. For the first part of the experiment, two sets of cultivations were carried out in parallel. All transporter variants as well as two negative controls, E. coli BL21(DE3) and E. coli BL21(DE3) pSB1C3-PtNTT2, were cultivated in MOPS minimal media containing either 1,32 mM K2HPO4 or 1 mM ATP as sole phosphate source. Three biological replicates of each strain were cultivated in 1 mL of media in a 12 well plate at 37 °C and 600 rpm. For each measurement point, three technical replicates were measured. Figure 10 shows the growth curves of the cultivations carried out with 1,32 mM of K2HPO4 as the sole phosphate source.

Figure 10: Cultivation of all transporter variants in MOPS media with K2HPO4 acting as the sole phosphate source.
The cultivation was carried out in 12 well plates and three biological replicates were cultivated of each strain. For measurement of the optical density at 600 nm, three technical replicates were taken.

The final OD600 values varied widely, with E. coli BL21(DE3) pSB1C3-PlacUV5-pelB-SP-PtNTT2 reaching the highest OD600 of 3.907 ± 0.018. The lowest OD600 was reached by E. coli BL21(DE3) pSB1C3-PlacUV5-PtNTT2 with a value of 1.537 ± 0.045. All final optical densities at 600 nm are shown in Table 7.
The cultivations were performed in parallel in MOPS media supplemented with 1 mM ATP as sole phosphate source. Again, three biological replicates of each strain were cultivated and three technical replicates measured for each time point. The growth curves are shown in Figure 11.

Figure 11: Cultivation of all strains in MOPS media with 1 mM ATP acting as the sole phosphate source.
Three biological replicates were cultivated and three technical replicates measured for each time point.

In ATP supplemented media, the wildtype strain reached the highest OD600 with 4.967 ± 0.143. Of the transporter variants, E. coli BL21(DE3) pSB1C3-PlacUV5-pelB-SP-PtNTT2 again reached the highest OD600 and E. coli BL21(DE3) pSB1C3-PlacUV5-TAT-SP-PtNTT2 the lowest. The results for both cultivations are summarized in Table 7.

Table 7: Final OD600 values for all cultivations carried out in MOPS media with 1,32 mM K2HPO4.

Strain Final OD600, K2HPO4 [-] Final OD600, ATP [-]
E. coli BL21(DE3) 2.923 ± 0.028 4.967 ± 0.143
E. coli BL21(DE3) pSB1C3-PtNTT2 3.507 ± 0.048 3.673 ± 0.091
E. coli BL21(DE3) pSB1C3-PlacUV5-PtNTT2 1.537 ± 0.045 3.033 ± 0.028
E. coli BL21(DE3) pSB1C3-PlacUV5-PtNTT2(66-575) 3.560 ± 0.011 3.347 ± 0.032
E. coli BL21(DE3) pSB1C3-PlacUV5-PtNTT2(31-575) 3.797 ± 0.065 3.580 ± 0.006
E. coli BL21(DE3) pSB1C3-PlacUV5-pelB-SP-PtNTT2 3.907 ± 0.018 3.710 ± 0.177
E. coli BL21(DE3) pSB1C3-PlacUV5-TAT-SP-PtNTT2 3.307 ± 0.029 2.177 ± 0.007
The maximum specific growth rate was graphically determined for all cultures as shown in Figure 12.

Figure 12: Graphical determination of the maximum specific growth rates for all cultures cultivated in MOPS media with 1.32 mM K2HPO4.

Based on the maximum specific growth rates, the minimum doubling time was calculated. The results are shown in Table 8. Once again, the strains expressing the native transporter and the transporter with a TAT signal peptide showed the weakest growth. The best growth characteristics were achieved by the strains expressing the truncated versions PtNTT2(66-575) and PtNTT2(31-575), and PtNTT2 with a pelB signal peptide.

Table 8: Maximum specific growth rates and minimal doubling times of the cultivations in MOPS media with 1.32 mM K2HPO4.

Strain µmax [h-1] td [h]
E. coli BL21(DE3) 0.444 ± 0.053 1.561 ± 0.199
E. coli BL21(DE3) pSB1C3-PtNTT2 0.499 ± 0.050 1.389 ± 0.100
E. coli BL21(DE3) pSB1C3-PlacUV5-PtNTT2 0.385 ± 0.044 1.800 ± 0.114
E. coli BL21(DE3) pSB1C3-PlacUV5-PtNTT2(66-575) 0,568 ± 0.057 1.220 ± 0.100
E. coli BL21(DE3) pSB1C3-PlacUV5-PtNTT2(31-575) 0.532 ± 0.022 1.303 ± 0.041
E. coli BL21(DE3) pSB1C3-PlacUV5-pelB-SP-PtNTT2 0.549 ± 0.017 1.263 ± 0.031
E. coli BL21(DE3) pSB1C3-PlacUV5-TAT-SP-PtNTT2 0.463 ± 0.028 1.497 ± 0.060

The graphical determination of the maximum specific growth rates of the cultures cultivated in ATP supplemented media is shown in Figure 13.

Figure 13: Graphical determination of the maximum specific growth rates of all cultivations performed in MOPS media and 1 mM ATP.

The determined values for µmax and the minimal doubling times are shown in Table 9.

Table 9: Maximum specific growth rates and minimal doubling times of the cultivations in MOPS media with 1 mM ATP.

Strain µmax [h-1] td [h]
E. coli BL21(DE3) 0.673 ± 0.012 1.030 ± 0.018
E. coli BL21(DE3) pSB1C3-PtNTT2 0.600 ± 0.021 1.155 ± 0.035
E. coli BL21(DE3) pSB1C3-PlacUV5-PtNTT2 0.463 ± 0.035 1.497 ± 0.076
E. coli BL21(DE3) pSB1C3-PlacUV5-PtNTT2(66-575) 0.644 ± 0.069 1.076 ± 0.107
E. coli BL21(DE3) pSB1C3-PlacUV5-PtNTT2(31-575) 0.428 ± 0.091 1.620 ± 0.213
E. coli BL21(DE3) pSB1C3-PlacUV5-pelB-SP-PtNTT2 0.518 ± 0.043 1.338 ± 0.083
E. coli BL21(DE3) pSB1C3-PlacUV5-TAT-SP-PtNTT2 0.334 ± 0.047 2.075 ± 0.141
Based on the results of the two cultivations, the relative beneficial effect (RBE) of PtNTT2 was calculated using Equation 2.

2

For each measurement point n, the optical density at 600 nm of the cultivation of a transporter variant in ATP supplemented media (ODAT) was divided by the optical density of the reference E. coli BL21(DE3) pSB1C3-PtNTT2 in ATP supplemented media (ODAR). The same was done for the cultures in K2HPO4 supplemented media(ODKT and ODKR). The value for ATP was then divided by the value for K2HPO4. The sum of the quotient for all measurement points n was then divided by n to obtain the final value for the relative beneficial effect of PtNTT2 shown in Figure 14. The final error was calculated through error propagation of the standard error of each measured optical density.

Figure 14: Relative beneficial effect of the different PtNTT2 variants.
As expected, the native transporter variant shows the highest positive effect since it most likely also exhibits the highest activity. Surprisingly, the two truncated versions show a higher effect than the versions with a pelB and TAT signal peptide.

Of all transporter variants, the native PtNTT2 showed the highest beneficial effect with a value of 1.360 ± 0.161. The second highest value was reached by PtNTT2(31-575) with 1.294 ± 0.107. PtNTT2(66-575) reached a value of 1.166 ± 0.105, pelB-SP-PtNTT2 one of 1.073 ± 0.114 and TAT-SP-PtNTT2 one of 0.732 ± 0.116.
This data suggests that the expression of different PtNTT2 variants, especially of the native PtNTT2, is beneficial for the cell when cultivated in MOPS minimal media supplemented with ATP as the sole phosphate source. Given that the reference strain does not express PtNTT2, the expression of PtNTT2 must have a beneficial effect for the cells since they grow better compared to the reference in ATP when compared to the reference in K2HPO4. Therefore, the beneficial effect is larger than the metabolic burden associated with recombinant protein expression. Consequently, the transporter exhibits a function beneficial to the cell in ATP supplemented media, meaning it can facilitate the direct uptake of ATP from the media. Therefore, the proposed activity of PtNTT2 in media supplemented with low concentrations of ATP could be verified.
Consequently, the same experiment was conducted with MOPS minimal media supplemented with 10 mM ATP. The relative beneficial effects of the experiment are summarized in Figure 15.

Figure 15: Relative beneficial effect of the different transporter variants when cultivated in MOPS minimal media supplemented with 10 mM ATP. No substantial beneficial effect could be observed for any of the transporter variants. The highest beneficial effects were reached by E. coli BL21(DE3) pSB1C3-PlacUV5-TAT-SP-PtNTT2 (+17.2 % ± 7.2 %) and E. coli BL21(DE3) pSB1C3-PlacUV5-PtNTT2(31-575) (+14.0 % ± 4.7 %).

The highest beneficial effect was reached by TAT-SP-PtNTT2 with a value of +17.2 % ± 7.2 %, followed by PtNTT2(31-575) with +14.0 % ± 4.7 %. All other strains did not show a substantial beneficial effect. These results suggest, that the activity of the different transporter variants is concentration dependent and that expression of PtNTT2 in media supplemented with higher concentrations of ATP equalizes the effects of uptake and export of NTPs. Therefore, no substantial beneficial effect could be observed, but also no negative effect.
The experiment was repeated once again with MOPS media supplemented with 100 µM of iso-dCmTP and iso-dGTP. Substantial differences were observed for all transporter variants. PtNTT2(66-575) reached the highest beneficial effect with +38 % ± 10 %. All other transporter variants reached showed a negative effect compared to the reference. This confirms that ATP is exported in presence of the unnatural nucleotides, leading to a net loss of ATP and inhibition of growth. Therefore, it can be concluded that the native transporter variant PtNTT2 has the highest activity towards iso-dCmTP and iso-dGTP, followed by PtNTT2(31-575).

Figure 16: Relative beneficial effect of the best PtNTT2 variants cultivated in MOPS media supplemented with 100 µM of iso-dCmTP and iso-dGTP each. Substantial differences can be observed for all transporter variants, with PtNTT2(66-575) reaching the highest beneficial effect +38 % ± 10 %. All other transporter variants reached showed a negative effect compared to the reference, which means that ATP is exported in exchange for iso-dCmTP and iso-dGTP, leading to a net loss of ATP.

The supernatants of the cultures cultivated in MOPS media supplemented with 1 mM and 10 mM ATP were further analyzed with LC-MS. Therefore, the cultures were centrifuged, and the supernatant analyzed with LC-MS. AMP, ADP and ATP were measured, but only AMP was substantially above the detection limit in nearly all samples. AMP was quantified based on the standard curve shown in Figure 18. ADP and ATP could not be quantified. The results are shown in Figure 17.

Figure 17: : Results of the LC-MS analysis of the supernatants of the cultures cultivated in MOPS media supplemented with 1 mM and 10 mM ATP. Measured AMP concentrations were standardized to the corresponding final optical densities.

AMP could be detected in all samples except for the supernatants of the strains expressing pelB-SP-PtNTT2 and TAT-SP-PtNTT2 cultivated in MOPS media supplemented with 10 mM ATP.

Figure 18: Standard curve for AMP using 10 mM, 1 mM, 0.1 mM, 0.01 mM and 0.001 mM of AMP. The standard curve was used to quantify AMP in the supernatant of the cultivations carried out in ATP supplemented MOPS media.

The samples from the cultivation performed in MOPS media supplemented with 1 mM ATP, the highest concentration was reached by E. coli BL21(DE3) pSB1C3-PlacUV5-PtNTT2(66-575) with 0.387 mM, followed by E. coli BL21(DE3) pSB1C3-PlacUV5-PtNTT2 0.294 mM. Of the samples of the cultivation carried out in MOPS media supplemented with 10 mM, the highest AMP concentration was measured for the native transporter variant with a value of 4.201 mM. The second highest AMP concentration was measured for PtNTT2(31-575) with 3.886 mM of AMP, followed by PtNTT2(66-575) with a concentration of 2.910 mM. These measurements verify that ATP, ADP or AMP are exported in exchange for ATP, which in case of ATP and ADP are consequently converted into AMP. Given that the measurements could only be performed once, not conclusion regarding the significance of the measured concentrations can be drawn.
Concluding, we were able to verify the function of PtNTT2 without using radioactively labeled nucleotides. The native transporter variant shows the highest activity in all experiments. Uptake of the unnatural nucleotides was verified by determination of the RBE of the different transporter variants when cultivated in MOPS media supplemented with the unnatural nucleotides. Since ATP is constantly exported in exchange for iso-dCmTP and iso-dGTP, leading to substantial negative influence on the growth of the cultures.

Subcellular Localization of PtNTT2

To investigate the subcellular localization of the different PtNTT2 variants, GFP fusion proteins were constructed as listed in Table 1. Each PtNTT2 variant was tagged with a cMyc epitope tag as a linker and GFP (BBa_E0040). The cells were cultivated and prepared for microscopy as described in the methods section. Microscopy was performed using the Zeiss LSM 700. The pictures shown in Figure 19 were taken at 100x magnification and clearly show the subcellular localization of the different PtNTT2 variants.

Figure 19: Confocal laser scanning microscopy of the different PtNTT2 variants fused to GFP (BBa_E0040). The pictures were taken with 100x magnification and show from A to E: E. coli BL21(DE3) pSB1C3-PlacUV5-PtNTT2, E. coli BL21(DE3) pSB1C3-PlacUV5-PtNTT2(66-575), E. coli BL21(DE3) pSB1C3-PlacUV5-PtNTT2(31-575), E. coli BL21(DE3) pSB1C3-PlacUV5-pelB-SP-PtNTT2 and E. coli BL21(DE3) pSB1C3-PlacUV5-TAT-SP-PtNTT2.

All PtNTT2 variants can be localized within the membrane, since the fluorescence signals of the GFP tag are concentrated there. Judging from the pictures, the variant with the pelB signal peptide is weakly integrated into the inner membrane, which would explain the good growth characteristics and the weak functionality of this variant. The TAT-signal peptide variant, which showed bad growth characteristics and no substantial function, seems to be located within the cell envelope nonetheless. Given that peptides containing the TAT signal peptide are usually folded within the cytoplasm and then secreted via the twin-arginine translocation pathway, this could be a possible explanation for the non-existent function of the TAT variant. All other variants that also showed a detectable function are successfully integrated into the membrane. The variants without a signal peptide are also located within the membrane, which is not surprising, given that the integration of membrane proteins does not necessarily require a signal peptide (Facey and Kuhn, 2004) . PtNTT2(66-575) seems to be better integrated into the membrane than any other variant. The native PtNTT2, and PtNTT2(31-575) are integrated in a similar scale, but a little bit weaker compared to PtNTT2(66-575). These results are consistent with the results of the verification of the function of PtNTT2, since all variants that showed a relative beneficial effect and also the highest AMP concentrations in the supernatant do integrate the transporter into the membrane. For the TAT signal peptide variant, it is most likely that the transporter is integrated incorrectly, leading to a correct subcellular localization while lacking the correct function.

Isolation of PtNTT2 from the Inner Membrane

For further analysis of PtNTT2 the isolation of the transporter from the cell was attempted. This task proved to be challenging, given that PtNTT2 comprises ten transmembrane domains and is therefore highly hydrophobic. For that reason, several different methods and procedures were tested to achieve the best results. The first two attempts were based on the isolation of the periplasmic protein fraction through cold osmotic shock and fast cell lysis followed by analysis via SDS PAGE. Unsurprisingly, both methods did not lead to the desired results, since no bands for PtNTT2 could be observed. Figure 20 shows the SDS PAGE of the samples prepared using the fast cell lysis for SDS PAGE.

Figure 20: SDS-PAGE of the GFP-fusion constructs of PtNTT2
The cells were prepared using the fast cell lysis for SDS PAGE protocol. E. coli BL21(DE3) and E. coli BL21(DE3) pSB1C3-PtNTT2 were used as negative controls. Unsurprisingly, no thick band can be observed around 90.3 kDa, which would be the size of PtNTT2-cMyc-GFP. No bands can be observed for the other PtNTT2 variants.

A second gel was used for a Western Blot using an anti-GFP antibody. The result is shown in Figure 21.

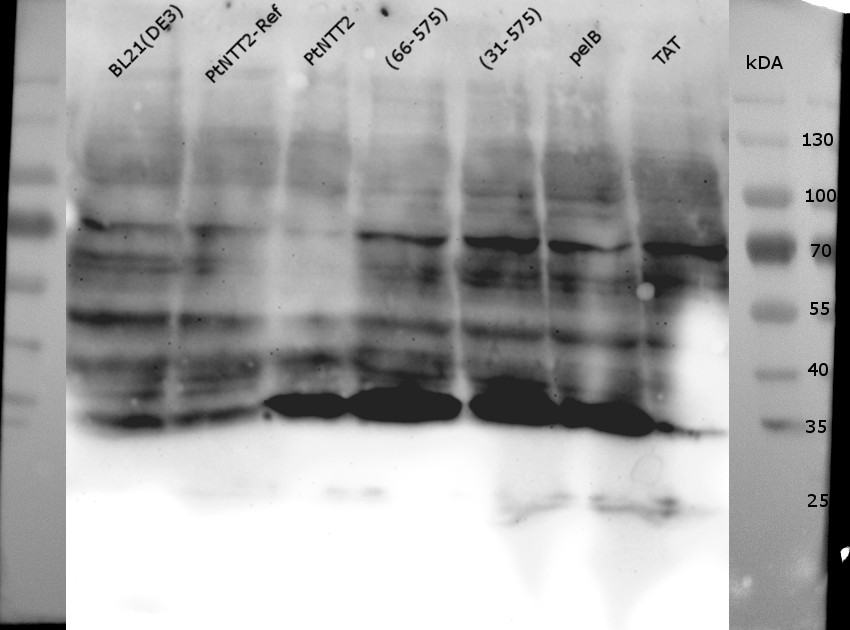
Figure 21: Western Blot of the samples prepared using the fast cell lysis for SDS PAGE protocol.
An anti-GFP antibody was used for the detection of PtNTT2-cMyc-GFP variants. E . coli BL21(DE3) and E. coli BL21(DE3) pSB1C3-PtNTT2 were used as negative controls. Much unspecific binding of the anti-GFP antibody could be observed, which is not surprising given that the entire proteome of the cells was analyzed. Thick band can be observed for PtNTT2-cMyc-GFP, PtNTT2(66-575)-cMyc-GFP, PtNTT2(31-575)-cMyc-GFP and PtNTT2(pelB)-cMyc-GFP around 35 kDa. This indicates that only the cMyc-GFP linker was detected and that the linker might be cleaved of from PtNTT2 due to the high difference in hydrophobicity.

In a second approach, the cells were lysed using a nitrogen cooled Precellys Homogenizer. After three cycles, cells were centrifuged at 4 °C and the membrane fraction was isolated as described in the methods section. After boiling the membrane fraction, the samples were loaded onto two SDS PAGEs, one of which was consequently used for a Western Blot, if the fusion proteins were used. For the Western Blot, two different antibodies were tested, an anti-GFP antibody and an anti-cMyc antibody. Figure 22 shows the SDS-PAGE after isolation of the membrane fraction. Again, no clear difference between the negative controls and the samples could be observed around 90 kDa.

Figure 22: SDS PAGE performed with the isolated membrane fractions.
The cMyc-GFP fusion proteins were used, which should be visible around ~90 kDa, differing slightly based on the PtNTT2 variant used. No bands could be observed around 90 kDa, which was subsequently proofed by performing a Western Blot.

The Western Blot (figure 23) performed with the same samples verified these results, since only bands around ~28 kDa could be observed for all samples except for PtNTT2(TAT)-cMyc-GFP and not for the negative controls. These bands can again be associated with the cMyc-GFP tag, providing further evidence that the tag can be cleaved of from the transporter. Again, no band could be observed for PtNTT2-cMyc-GFP, indicating that PtNTT2 with a TAT signal peptide is weakly integrated into the membrane, which would explain the lacking function of this variant. The weak growth characteristics of the strain producing PtNTT2 with a TAT signal peptide would therefore most likely be caused by accumulation of the protein within the cell.

Figure 23: Western Blot of the isolated membrane fractions of the strains expressing the cMyc-GFP fusion proteins.
Thick bands can be observed around 28 kDa for all samples except for PtNTT2-cMyc-GFP with a TAT signal peptide. The negative controls do not show the same band, but some unspecific binding of the anti-GFP antibody could be observed. Compared to the previous Western Blot, unspecific binding was substantially reduced. These results indicate, that the linker is most likely separated from the transporter either during the isolation process or already within the cell. This would be no surprise, given that the transporter is highly hydrophobic while the linker is hydrophilic.

To investigate if the transporter can be visualized on a gel using an anti-cMyc antibody, the same experiment was repeated, and the Western Blot performed using an anti-cMyc antibody. In case that the cMyc epitope tag remains attached to the transporter during possible cleavage events, it should be possible to visualize the transporter on a gel using the cMyc antibody.

Figure 24: Western Blot of the isolated membrane fraction using an anti-cMyc antibody.
Again, fragments can be observed around 35 kDa for all samples except for PtNTT2-cMyc-GFP with a TAT signal peptide. No bands can be observed for the full construct, but a very weak band can be seen between 55 and 70 kDa for the fusion protein of the native transporter.

Once again, bands could be observed for all transporter variants except for the TAT signal peptide variants around 35 kDa. One very weak can be observed for the fusion protein of the native transporter between 55 and 70 kDa. All these results show how difficult the isolation of integral membrane proteins can be. A number of reasons can be brought forward to explain why isolation of PtNTT2 from the membrane proved to be so challenging. First of all, PtNTT2 has 10 transmembrane domains, making it a highly hydrophobic protein. To find a correct detergent to solubilize the protein from the isolated membrane fraction also proves challenging. The European Molecular Biology Laboratory (EMBL) lists dozens of possible detergents on their site (European Molecular Biology Laboratory - Protein Purification). To find a best suited detergent is also a challenge. Another reason why the visualization of membrane proteins on SDS PAGEs and Western Blots is challenging is that membrane proteins tend to aggregate when boiled and that they often exhibit “gel shifting” (Rath et al., 2009). For that reason, another SDS PAGE was run using the isolated membrane fractions of the PtNTT2 constructs without cMyc-GFP tag, but this time the samples were loaded onto the gel without previous boiling.

Figure 25: SDS PAGE of the isolated membrane fraction without previous boiling
No thick bands can be observed around 70 kDa. Slightly above 100 kDa, bands can be observed for all PtNTT2 variants but not for the negative controls. But given that the samples ran quite different on the gel compared to the boiled samples, no definite conclusion can be drawn from this gel.

Based on these findings it can be concluded that PtNTT2 is located in the inner membrane of E. coli and that isolation of the entire protein remains challenging. Since it could be shown that the tags are present in the inner membrane fraction, it is very likely that the entire construct PtNTT2-cMyc-GFP could simply not be solubilized enough. In all Western Blots, the tag of PtNTT2-cMyc-GFP with a TAT signal peptide was far weaker compared to the other samples, indicating that PtNTT2 with a TAT signal peptide is weakly integrated into the membrane. This would also concur with our previous results and would explain the lacking function of this construct.

References

EMBL Protein Purification - Extraction and Clarification - Solubilisation of Membrane Proteins. https://www.embl.de/pepcore/pepcore_services/protein_purification/extraction_clarification/solubilisation_membrane_proteins/index.html, Date Accessed: 1st of November, 2017
Facey, S.J. and Kuhn, A. (2004). Membrane integration of E. coli model membrane proteins. Biochim. Biophys. Acta - Mol. Cell Res. 1694: 55–66.
Käll, L., Krogh, A., and Sonnhammer, E.L.L. (2007). Advantages of combined transmembrane topology and signal peptide prediction-the Phobius web server. Nucleic Acids Res. 35: 429–432.
Rath, A., Glibowicka, M., Nadeau, V.G., Chen, G., and Deber, C.M. (2009). Detergent binding explains anomalous SDS-PAGE migration of membrane proteins. Proc. Natl. Acad. Sci. 106: 1760–1765.
Zhang, Y., Lamb, B.M., Feldman, A.W., Zhou, A.X., Lavergne, T., Li, L., and Romesberg, F.E. (2017). A semisynthetic organism engineered for the stable expansion of the genetic alphabet. Proc. Natl. Acad. Sci. 114: 1317–1322.