Team:EPFL/Results/Lysates


Results
As the project was based on working with cell-free systems, the first objective was to develop an optimized, cheap, easy-to-use and secure protein expression system. The solution to this was to develop functional home-made lysate and to increase the efficiency of protein production in order to achieve an optimal signal generation system.
What was accomplished ?
In order to chronologically summarize our best accomplishments or discoveries during the elaboration of our project before presenting our results, here is a list:
- Successful production of functional lysates from different cell strains.
- Determination of which lysate is the best for protein production.
- Characterization of GFP-mut3b and EGFP in cell free expression system.
- Successfully shown the positive effect for protein expression upon adding gamS.
- Successfully exhibited the two ways of adding gamS to the cell-free reaction: by adding purified gamS or by mixing the lysate with Top10-gamS.
- Determination of the best quantity of Top10-gamS to add to the lysate reaction.
- Discovery of the importance of T7 RNA polymerase and thus the discovery of a limiting factor for protein expression.
- Successfully tested lysates with lacZ reporter and determined which one was the best.
- Successful α-complementation.
- Successful lyophilized cell free reactions.
Lysates preparation and characterisation
Preparing functional lysate was the first goal we accomplished. In order to determine which bacterial strains yielded a lysate with the highest protein production efficiency, we made 6 different lysates derived from the following strains: BL21(DE3), M15, M15-T7, Dh5, Top10 and Top10-gamS. For every lysate, we performed a Bradford assay in order to determine the concentration of protein present in the lysate. This gives an indication about the efficiency of the lysates, however we also had to test our lysate in an in-vitro transcription-translation reaction to determine if the protein present was still viable. The Bradford assay results for BL21(DE3), M15 and M15-T7 always showed a protein concentration between 50 and 80 mg/ml. For Top10 and Top10-gamS, the results were between 30 and 50 mg/ml. The lower protein concentrations in the Top10 cells could be attributed to the fact that our original protocol for lysate production was optimised for BL21 cell strains. Although these parameters seemed to work well for both BL21 and M15 cell strains, it is possible that further optimisation could improve the protein yield for Top10 cells.


Now that the protein concentrations in lysates are known, the production of protein by the different lysates must be tested. GFP-muts3b (a green fluorescent protein variant) was chosen as a protein to express for lysate characterization for two reasons: first, it is a protein that can be measured quantitatively as the fluorescence measured is proportional to the quantity of GFP expressed and secondly, it is a bioprick part (Part:BBa_E0040) that could be characterized in cell free for the first time.
GFP-mut3b was resuspended from the iGEM plate and amplified by PCR with primers that add the T7 promoter, which is a highly efficient promoter, especially in cell-free. However, in order to express DNA with a T7-promoter, only lysates made from cells that produce T7 RNA polymerase (here BL21(DE3) and M15-T7) can be used.
In this experiment, cell-free GFP-mut3b synthesis was analysed using a home-made E. Coli lysate from strain BL21(DE3). Fluorescence was measured at 37°C for five hours on a platereader. Here (figures 2a & 2b), we have shown three repeats with a negative control, as well as a shaded error graph with the negative control subtracted, summarizing this result. GFP-mut3b expression yields high fluorescent signal in lysate, enabling it to serve as a reporter while working on a cell-free chassis. Saturation of protein expression occurs after about five hours.


GFP-mut3b expression was tested in M15-T7 lysate in order to determine if there was a difference of expression between the BL21(DE3) and M15-T7 lysates (figure 3). The lysate reaction contains M15-T7 lysate, energy solution, buffer A, nuclease free water, DNA coding for GFP-mut3b and purified gamS or Top10-gamS lysate. GamS is a protein that protects the DNA from exonuclease present in the lysates. It can be added in two manners: either as purified gamS protein or as a mixture of top10-gamS lysate with M15-T7 lysate (see next chapter). The control is without coding DNA. The fluorescence was measured for 6 hours at 37°C.

Since the units of the two last graphs are different (they were measured on two different platereaders), we cannot make a quantitative comparison. However, a qualitative comparison shows that the expression of GFP-mut3b in M15-T7 reaches its maximum after only 1 hour of incubation while the maximum in BL21(DE3) is reached after 5 hours. Furthermore, the fluorescence of the +DNA measurements is approximatively 5X the –DNA measurements for the M15-T7 lysate and respectively 3X for BL21(DE3). Hence, with these two observations, we drew the conclusion that M15-T7 lysate is to be preferred for GFP expression. This was good news for our project as we planned to incorporate the expression of β-galactosidase (LacZ), an enzyme which is not present in M15-T7 cell strains, in our diagnostic tool. A second positive result is that we were able to achieve similar expression levels by adding purified gamS or Top10-gamS lysate, meaning that we could bypass the usage of purified gamS proteins, which is a more timely and costly process.
EGFP (enhanced green fluorescent protein) was chosen as an alternative protein to be expressed for lysate characterization because the progression over time of protein expression is observable, it is a bioprick (BBa_K1123017) part and it gives a higher fluorescent signal than normal GFP. The lysate reaction contains BL21(DE3) lysate, energy solution, buffer A, nuclease free water, coding DNA for EGFP and gamS or Top10-gamS as described in the previous experiment. The control is without coding DNA. The fluorescence was measured for approximatively 5 hours at 37°C.

In this experiment (figure 4), three things are important to notice. First, as was seen in the previous experiment with GFP-mut3b, the protein expression in BL21 (DE3) is slower than in M15-T7 lysate, which confirms the previous conclusion. Secondly the difference between the +DNA (pink) and –DNA (royal blue) (when gamS is added) is clearly bigger than the two preceding experiments (approximatively 3X), probably due to higher fluorescence of EGFP. Finally, we see a very interesting effect due to the presence of gamS: 10x higher expression of protein expression can be observed between the +gamS (pink) and the –gamS (light blue) signal. This experiment confirms the positive effect of gamS that will be further shown in future experiments when using linear template DNA.
Optimisation of lysates: GamS
The gamS protein from phage lambda increases protein expression when the DNA template is added in linear form because it protects linear DNA from degradation by exonucleases. As gamS protein could have a great potential for lysate optimisation, we decided to characterise this part. Most importantly we needed to prove the importance of adding gamS to our cell-free reactions and define the best quantity of gamS to add.
In proving that the addition of gamS helps the reaction to take place, we tested two possible scenarios: adding either purified gamS or Top10-gamS lysate. Top10-gamS lysate was derived from the bacterial strain Top10 which we had transformed with a plasmid containing the gene encoding the gamS protein, enabling the expression of gamS in these cells. In fact, two of our published biobricks are the gamS gene (BBa_K2203001 and BBa_K2203000), therefore any iGEM team can add this to their lysate cell strains for improved expression when using linear DNA templates.
In order to determine the improvement of protein expression by adding gamS and whether mixing two lysates would also improve the reaction, three separate reactions were tested (figure 5). Each of the three solutions contains M15-T7 lysate, energy solution, buffer A, nuclease free water and DNA coding for T7-EGFP. In addition to the aforementioned components, the first reaction additionally contains gamS purified protein (pink bar), the second reaction Top10-gamS mixed with M15-T7 (1.25 µl of each lysates) (purple bar) and the last reaction does not contain gamS in any form (blue bar). The respective controls were subtracted. The measures were taken by platereader measuring fluorescence at 37°C for approximatively 5 hours.

This experiment (figure 5, and the last two experiments figures 4 & 3) clearly showed that adding gamS in any form to the lysate reaction is incontestably increasing the protein production. The best solution is to add purified gamS but adding the gamS by mixing Top10-gamS with M15-T7 lysate is still improving the reaction. This last solution is cheaper and easier as the protein does not need to be purified. Thus, we are totally independent as we know how to produce Top10-gamS lysate. Hence, the majority of the following experiments were performed by adding Top10-gamS.
Now that we have shown that the addition of gamS clearly increases protein expression compared to lysate reactions without gamS, we wanted to see if this advantage was consistent in other types of lysates and which ratios of added Top10-gamS were ideal. Here, three lysate reactions were performed (figures 6a & 6b): the first containing BL21(DE3) lysate and purified gamS (pink), the second mixing BL21(DE3) and Top10-gamS lysates (dark blue) and the last mixing BL21(DE3) and Top10 lysates as well as purified gamS (light blue) in order to determine the proportion of protein expression done by Top10 lysate (as Top10-gamS is a home-made recombinant bacteria made from the Top10 strain). The controls were made by doing the same lysate reaction without adding DNA for T7-EGFP.


The first observation (figure 6a & 6b) that can be made is that adding either purified gamS or Top10-gamS gives a similar result (respectively pink & dark blue). The light blue measures indicate that Top10 lysate does not significantly help the protein expression but gamS does when adding Top10-gamS lysate. This is probably because that Top10 cells do not produce T7 RNA polymerase and thus cannot participate as much as BL21 in protein expression, which leads us to think that the polymerase and thus the mRNA translated is a limiting factor for the cell-free reaction. Hence, one solution to explore in order to further optimise the lysate reaction is to transform M15-T7 or BL21(DE3) with a plasmid coding for gamS protein in front of an E. Coli promoter in order to have both T7 RNA polymerase and gamS produced simultaneously.
As we decided to mostly add gamS by mixing lysates with Top10-gamS, the next step for gamS characterisation was to determine which quantity of Top10-gamS is ideal. Hence, EGFP expression was measured according to different ratios of M15-T7 and Top10-gamS lysates with all reactions containing the same total amount of lysate (figure 7). The ratios tested ranged from 1:1 to 1:4. The controls are the lysate reaction without adding DNA. The average of three repeats for all four ratios is shown here (errors bars are not shown for readability).

What can be concluded here (figure 7) is that the two best ratios are 1:1 and 1:2. The two other ratios give a lower protein expression, maybe because of the lack of T7 RNA polymerase.
LacZ expression
As the best functional lysate was determined, we next wanted to choose an ideal reporter for our system. The goal of aptasense was to be able to detect both DNA/RNA and protein in a simple manner. Hence lacZ was chosen as reporter for our diagnostic tool because it is qualitative and the signal is visible by eye because when β-galactosidase is expressed, it catalyzes the reaction of a substrate molecule, causing the colour of the lysate reaction to turn purple. Before choosing this reporter for our diagnostic tool, we needed to determine with which lysates this reporter could be used, as bacteria usually also produce β-galactosidase. Thus, we must use a lysate that does not already contain this enzyme. For this, bacteria must have a mutation in the region coding for the enzyme in order to avoid the production of β-galactosidase. If β-galactosidase is not present in the solution, it will be possible to see the progression of signal with time by measuring the absorbance at 595 nm on a platereader.
To determine if β-galactosidase is present in a given lysate and to check whether the lysate is contaminated with the enzyme, an experiment was performed where substrate (chlorophenol red) alone or with magnesium chloride was added to the different lysates. We did this for BL21(DE3), M15 and M15-T7 lysates (figure 8a) and saw that the reaction turns purple, β-galactosidase was inherently present.


As expected, we discovered that β-galactosidase is present only in the first tube containing BL21(DE3) lysate. Otherwise, others lysates (shown here: M15 & M15-T7, otherwise: Dh5, Top10 & Top10-gamS) do not contain the enzyme and, thus, can be used for β-galactosidase expression.
Having chosen ß-galactosidase as the main reporter protein, the choice for the lysate that we will use was made based on the best expression of β-galactosidase. Hence, lacZ DNA with an E. Coli promoter was added to the different lysates with energy solution, buffer A, chlorophenol red and nuclease free water (figures 9a & 9b).


The measurement showed that BL21(DE3) already contains β-galactosidase, which was expected (figure 9a). However, the BL21(DE3) lysate derived from cells grown on YTPG medium started with a lower expression level than the normal BL21(DE3) lysate. This is most probably due to the different pathways of metabolism and the inhibition of ß-galactosidase production in YTPG growth medium. In YTPG, the enzyme ß-galactosidase is not used for the general metabolism as the cells’ growth in YTPG is based on glucose.
The expression levels of Top10-GamS lysate are very unexpected (figure 9a), the expression should be smaller. It is most likely due to overspill or pipetting errors during the preparation of the experiment. Both M15-T7 lysates (pink and blue) reach the best level of ß-galactosidase expression that produces a colour change visible by naked eye (figure 9b). Thus, the M15-T7 lysate will be our lysate of choice since the expression of ß-galactosidase is ideal, and the lysate does not contain ß-galactosidase, but does contain T7 RNA polymerase, enabling expression under a T7 promoter in future experiments.
Further experiments were done in order to be sure that lacZ can be used as reporter for our toehold (figures 10). Three reactions were made: T7-lacZ DNA is added to BL21(DE3) lysate (figure 10a), to BL21(DE3) YTPG (figure 10b) and to M15-T7 (figure 10c).


The measured absorbance does not change over time in BL21(DE3) lysate and no difference in observed in control. The results from the last experiment in BL21(DE3) YTPG is confirmed here: the absorbance is growing over time and there is a difference between the + and – DNA control. For the experiment in M15-T7, a clear difference of absorbance between the + and – DNA can be seen and this reporter can be used for further experiments.
α-Complementation
In order to optimize our reactions, we thought to characterize the expression of lacZ in cell free systems, something that has not been shown previously. We wanted to know if the expression of only lacZα, instead of lacZ, would lead to the formation of a functional ß-galactosidase since the entire enzyme is quite long to produce while the α part is significantly smaller. B-galactosidase is a tetramer of four subunits (two α and two Ω parts) and lysates normally used for blue-white screening do not lack the entire ß-galactosidase but rather produce the Ω subunit and are mutated only for the lacZα part.
Hence, in order to see if the α complementation (assembly of α and Ω parts in order to produce a functional ß-galactosidase) is possible. We made an experiment that consisted of adding lacZα DNA in front of a T7 promoter in a lysate reaction to see if the solution turned purple. In this experiment (figures 11), we used T7-LacZ as a positive control and toehold-lacZ as the negative control.


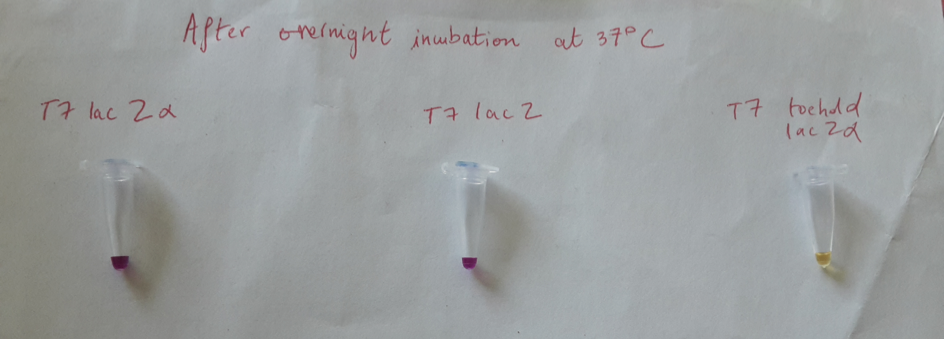
B-galactosidase complementation was successful: the colour change was witnessed after two hours of incubation at 37°C. Here (figures 11), the T7-lacZα is less efficient than the entire T7-lacZ but later, some additional experiments were done, in fact the colour change can be observed more rapidly, especially when using the toehold (figure 12).

In order to improve the characterization of the lacZα fragment in cell-free reactions and make further experiments in order to be sure that the α complementation works, lacZα is added in T7-M15 cell lysate. The figure below shows the expression of a functional ß-galactosidase in T7-M15 cells upon the assembly of the different α and Ω parts and confirms the possibility to further use the T7-lacZα for the next experiments.

Lyophilisation
Lyophilisation of cell lysate permits long and easy storage although it can reduce the efficiency of protein production. Hence, the goal of the first experiment was to determine the ultimate loss of protein synthesis due to lyophilisation (figures 13).


The loss was determined measuring the levels of fluorescence of EGFP protein (enhanced green fluorescent protein) on platereader. The loss of EGFP protein expression by adding T7-EGFP DNA in rehydrated freeze-dried reactions is 60% compared to the non freeze-dried reactions (figure 13b), however the expression is still high enough for detection (figure 13a).
The next step was to test if the production of β-galactosidase in a lyophilised reaction is detectable since this enzyme was the main reporter used. E. Coli lacZ DNA producing β-galactosidase was added to M15-T7 lyophilised lysate (figures 14).


The production of protein was detectable since the substrate for β-galactosidase changed colour both by eye and showed an absorbance of 0.5 at OD 595 nm after 5 hours. This result is enough for detection, even if the lost of protein expression in rehydrated freeze-dried reactions is about 50% compared to the fresh lysate reactions (OD about 1).