Team:HFLS H2Z Hangzhou/sub/enzyme
Template loop detected: Template:HFLS H2Z Hangzhou<!DOCTYPE html>
Enzyme
Overview
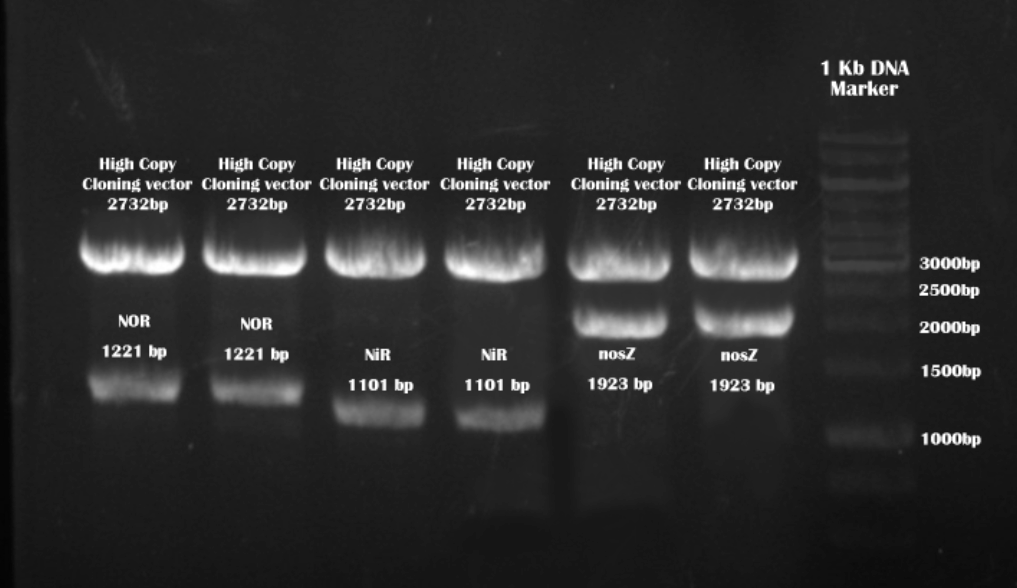
To meet with the parameter we set in Design, we first researched on possible ways to eliminate Nitrite ions. We settled down with three target enzymes to form a substrate channeling system(see Design concerning goal one): NiR (nitrite reductase), NOR(nitric oxide reductase), nosZ(nitrous oxide reductase).
Construct the Expression Vectors
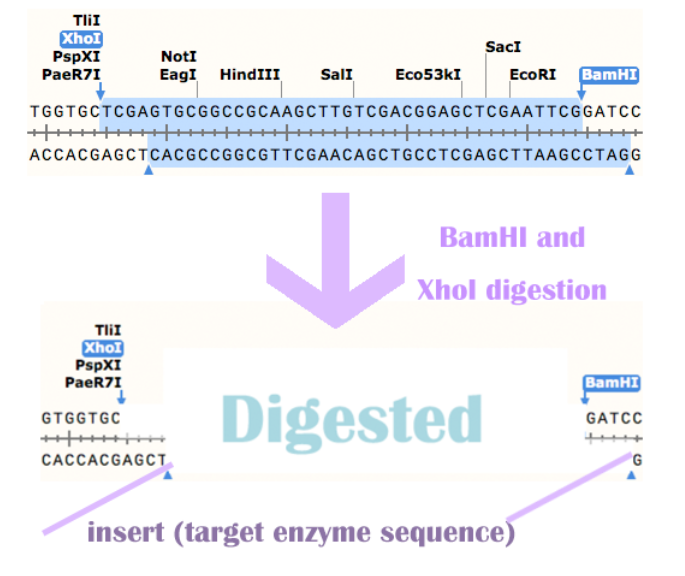
Before we send out the order for the synthesis of our three enzymes' sequence, we added the restriction site BamHI before 5' of the sequence, we added the restriction site XhoI after 3' of the sequence.The sequence of BamHI: ggatcc
The sequence of XhoI: ctcgag
Construction of expression vectors
We also avoided the following restriction site in our synthesis order: NdeI,NheI,BamHI,EcoRI,EcoRV,HindIII,NotI,XhoI,SacI,SalI,NcoI, XbaI, SpeI, PstI. Among these, XhoI, EcoRI, SpeI, XbaI, NotI are avoided for the ease of RFC10 standardization.
Target enzyme sequences after BamHI and XhoI digestion
We received our orders in plasmids. After transformation, culture and mini prep, we used BamHI XhoI to digest our target sequences from high copy vectors.
The backbone(high copy cloning vector) is provided by DNA synthesis company.
We also digested linearized pET28a with these two restriction enzymes.
The primers for bulk PCR of pET28a are:
Forward primer: TCGAATTCGGATCCGCGACCCATTTGCTGT Tm=68 °C
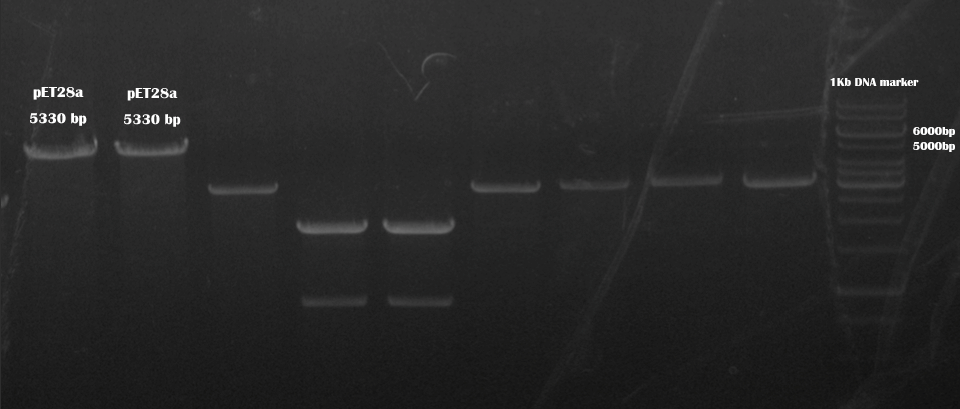
pET28a afte BamHI and XhoI digestion
Reverse primer: GGCCGCACTCGAGCACCACCACCACCACCA Tm=74 °C
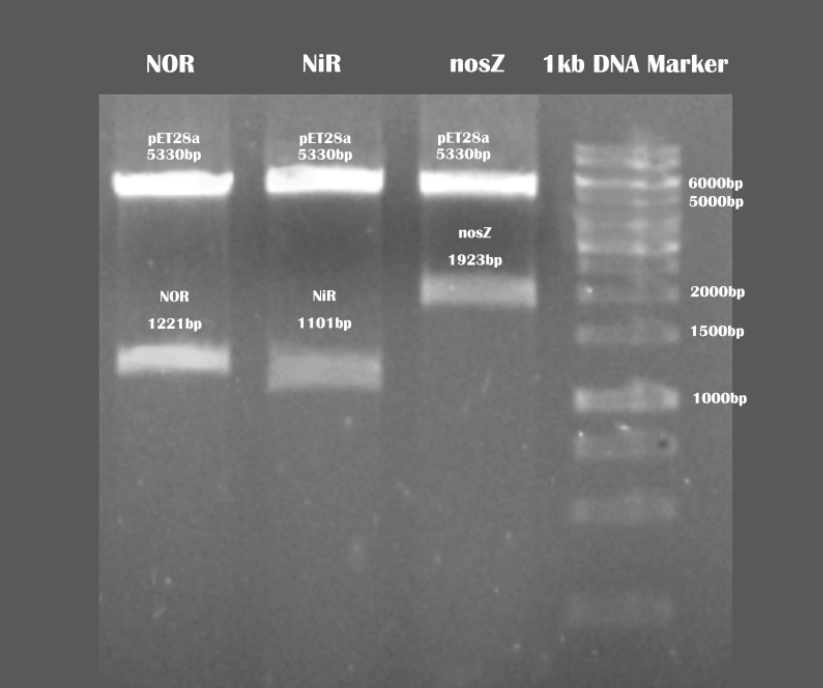
Verification of our expression vectors using BamHI and XhoI restriction enzymes
Then, we ligated our target enzyme sequences with pET28a vector, and after verification and sequencing, we moved to the next stage.
Purification of Proteins with His-tag
Materials
Cell cultures1M IPTG
1xPBS buffer
Ni-NTA
Imidazole
Gravity Chromatography Columns, 5ml
Ultrasonic Cell Disruptor
Process
1 |
Grow 30mL cultures of cells with LB for 3-4 hours. |
2 |
Measure OD of the cells. |
3 |
Add 3µL IPTG into cell cultures if OD is between 0.4-0.6. (Continue incubation if OD is still below 0.4) |
4 |
Incubate the cultures at 16°C, 150rpm overnight. |
5 |
Centrifuge the overnight cultures at 6,000rpm for 5 mins. |
6 |
Remove the supernatant(LB) after centrifugation. |
7 |
Add 20mL 1xPBS into the centrifuge tube, suspend the cell deposit. |
8 |
Centrifuge at 6,000rpm for 5 mins again to remove LB remains. |
9 |
Crack the cells using a ultrasonic cell disruptor for 20 minutes. (5s on / 10s off) |
10 |
Centrifuge the products at 12,000 rpm, 4°C for 5 mins. |
11 |
Collect the supernatant and add 100µL Ni-NTA. |
12 |
Place the mixture on a shaker for 1h. |
13 |
Add the protein solution into the gravity chromatography columns and collect the effluent. |
14 |
Add 20mM Imidazole into the columns to wash away impurities. |
15 |
Add 250mM Imidazole into the columns to wash off the proteins. Collect the effluent. |
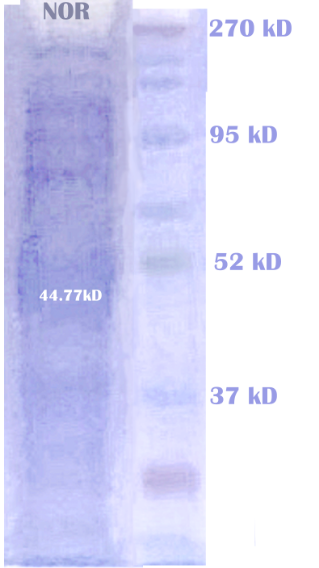
SDS-PAGE Analysis
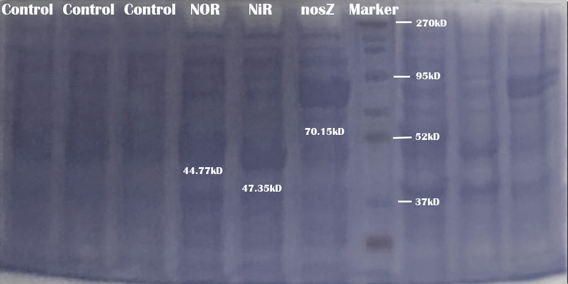
SDS-PAGE analysis
To test the expression and reactivity of each enzyme—NOR, NiR, and NosZ—we expressed them seperately on E.coli strain BL21(DE3). Please see our protocol Purification of Proteins with His-tag. After purification, we examined each sample for the presence of enzymes using SDS-PAGE analysis. The results indicated that all three enzymes were successfully expressed and purified.
Overview
To make sure our three enzymes' successful expression and reaction in $E. coli$ chassis, we conducted assays on three enzymes individually in vitro. Then, if the assay method can be applied to in vivo conditions, we perform the assay of enzyme activity in vivo.Throughout our experiments, we concluded there are three possible ways to assay enzymes in our case.
| Measure the reduction in substrate concentration. | |
| Measure the increase in product concentration. | |
| Measure enzyme reactivity by monitoring the electron loss (specific to our case: all three enzymes catalyze reduction—enzyme loses electrons while substrate gains electron hence reduced). |
We measured the reactivity of NiR both in vivo and in vitro. This was because the method we leant from ZECCC was sensitive and accurate(see our Integrated Human Practice). For enzyme nosZ however, we only found one method which is investigating enzyme's electron loss rate using intermediate color reagent so we measured its reactivity in vitro. We simply cannot use this method in vivo because not only the reagent toxic to metabolic activity, but the intermediate color reagent is unstable.
For the other enzyme NOR(nitric oxide reductase), we tried several methods, the first two while feasible in theory, were unsuccessful because of the unavoidable limitations in practice. We did manage to found correct method but could not access the high-end Gas-Phase Molecular Absorption Spectrometry, so we cited the experiment results from the paper measuring the same enzyme expressed in same chassis $E.coli$.
$\mbox{NiR}$ (Nitrite Reductase)
Background
 The first enzyme NiR is the product from expression of nirS gene amplified from Alcaligenes eutrophus DSM 530. The NiR catalyzes the reduction of nitrite (NO2-) to nitrogen monoxide(NO), as the first step of our substrate channeling system.
Biology
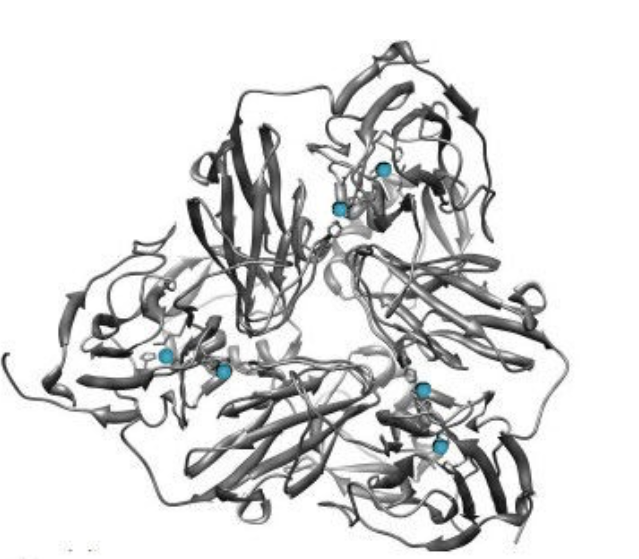
Nitrite reductase's tertiary structure
We expressed the nitrite reductase with a His-tag in E.coli using a pET28a vector. The proteins are then extracted from the cells and purified using a HIS-trap column. After further purification, we ran electrophoresis to check the correct expression of NiR. The result of protein electrophoresis is shown below.
Assay method
We used N-(1-naphthyl)ethylene diamine dihydrochloride spectrophotometric method, a common approach in waste water treatment, to measure the concentration of nitrite in the solution to track the reaction process. The nitrite concentration was measured using a color-showing reagent consisting of p-aminobenzenesulfonamide and 1g n-(1-naphthyl)-ethylenediamine dihydrochloride.The reagent reacts with nitrite to form the redish pink diazo salt in the solution, which has a maximum absorbance around 540nm. A standard curve was first made by measuring the absorbance at 540nm of the reaction system under various nitrite concentration.
Stand curve between Absorbance-540nm and Sodium Nitrite concentration is shown below.

Standard curve between Absorbance-540nm and Sodium Nitrite concentration
Reactivity assay in vitro
To assay the reactivity of the protein. We put the enzyme, sodium nitrite and pbs buffer together to establish a reaction system. We recorded the nitrite concentration over 24 hours, under temperature of 37 degree Celcius. A standard curve was first made(as seen above) by measuring the absorbance at 540nm of the reaction system under various nitrite concentration.According to our results, the absorbance dropped from 0.633 to 0.008 over 24 hours, which indicates a drop of nitrite concentration from 0.196 mg/L to roughly zero. Currently we are still testing samples with shorter and various reaction time-length to plot the closest curve of the reactivity.
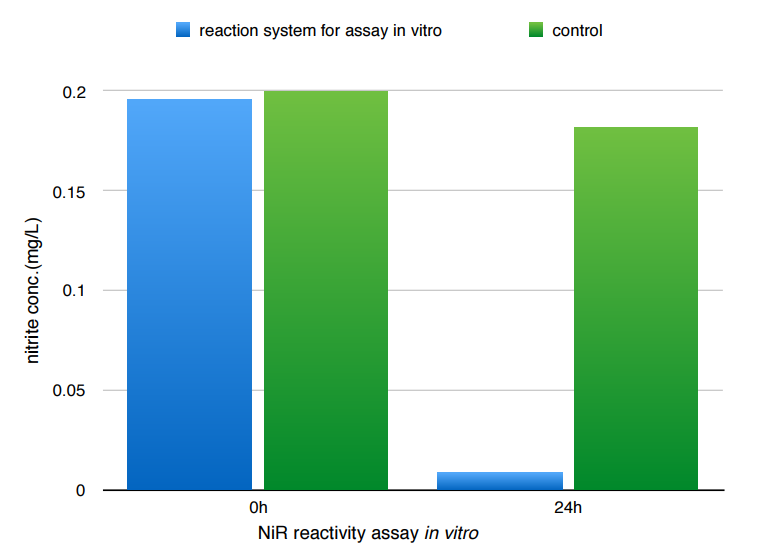
NiR reactivity assay in vitro
Since the application of these enzymes will be in vivo, we are satisfied with NiR's reactivity was verified. We are much more interested in NiR's ability to react in vivo with much greater concentration of nitrite.
Reactivity assay in vivo
Protocols
| Add IPTG into prepared cultures of E.coli (IPTG concentration: 0.1mg/L) | |
| Induce at 16 °C, 150 rpm overnight | |
| Add sodium nitrite solution at various concentration (Target concentration: ~65mg/L) | |
| Culture the bacteria at 37 °C,150 rpm | |
| Take samples (500uL) of the cultures at various time points | |
| Measure optical density(600nm) of the samples | |
| Centrifugate at 6,000 rpm for 60s | |
| Take 100uL samples from supernatant and dilute with 900uL ddH2O | |
| Take 100uL samples from the diluted solution and dilute again with 900 uL ddH2O | |
| Add 20uL of chromogenic agent to the solution | |
| Stand the solution for 20 mins and wait for the color to develop. | |
| Measure the absorbance(540nm) of the solutions | |
| Record data in Excel forms |
*Prepare the chromogenic agent as follows:
1 |
In 500mL beaker
|
||||||||
2 |
Transfer the solution to a 500mL volumetric flask and dilute with ddH2O to standard volume. |
Results
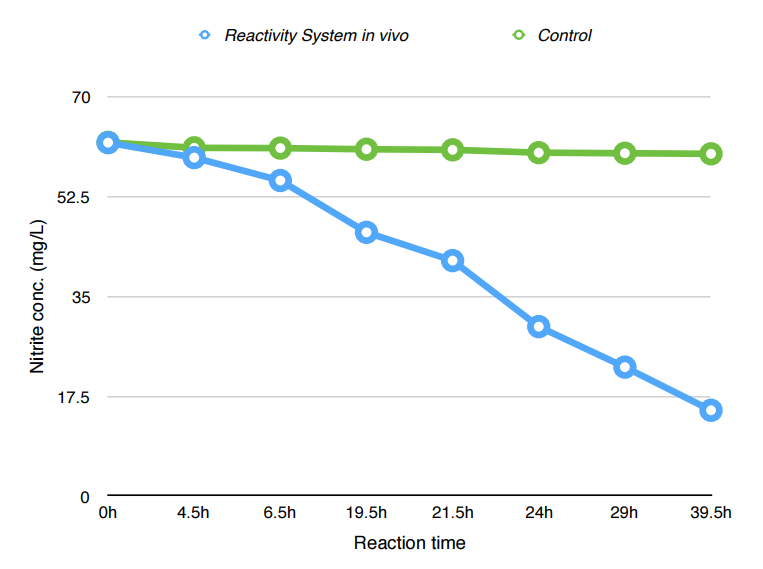
Nitrite conc. against reaction time
| According to our results, the absorbance at 540nm dropped from 0.410 to 90.105 over 45.5 hours, which indicates a drop of NaNO2 concentration from 62.0(mg/L) to 14.9(mg/L). | |
| According to the graph, the reactivity of NiR is the highest during 20-30hours. About 76% of total nitrite is degraded at the end of assay. Also, there is no obvious reduction in nitrite concentration in control group. |
$\mbox{NOR}$ (Nitric oxide reductase)
Background
Cytochrome P450 55B1 from Chlamydomonas reinhardtiiGeneral Equation: $ \ce{2NO + NAD(P)H + H+ → N2O + NADP+ + H2O} $
 We found three assay methods to test the activity of nitric oxide reductase: using NO measurement Kit, titration and Gas-Phase Molecular Absorption Spectrometry. The first two methods were failed, and the details and reasons were recorded below. Due to limitations of lab equipment, we were not able to conduct the experiment using the third method.
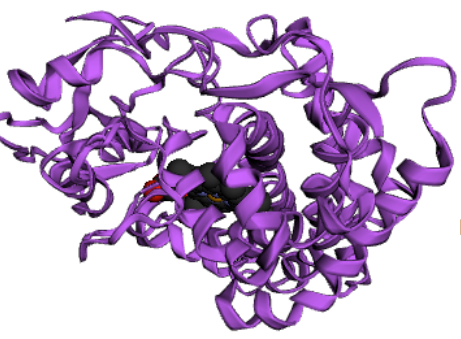
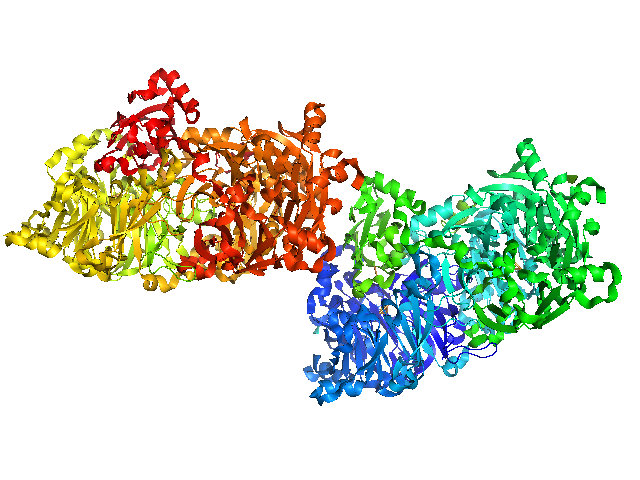
Nitric oxide reductase's tertiary structure
Assay method 1: NO Measurement Kit
The NO kit we planned to use was developed by Nanjing Jiancheng Bioengineering Institute, and the concentration of NO in the solution can be calculated by the concentration of $\ce{NO3-}$, because NO will be reduced to $\ce{NO3-}$ in blood plasma of chicken or mice. We prepared the solution according to the method as below:1 |
Remove the air in the flask by passing through nitrogen gas for 30 minutes. |
2 |
Pass through nitric oxide gas for 45 minutes in Flask C that contains ddH2O. |
3 |
Flask A contains 30% H2O2 solution, and Flask B contains KMnO4 / NaOH solution, to oxidize and absorb the undissolved gas.[1] |
However, although the NO solution we prepared using this method was saturated, the concentration was too low for the verification to proceed.
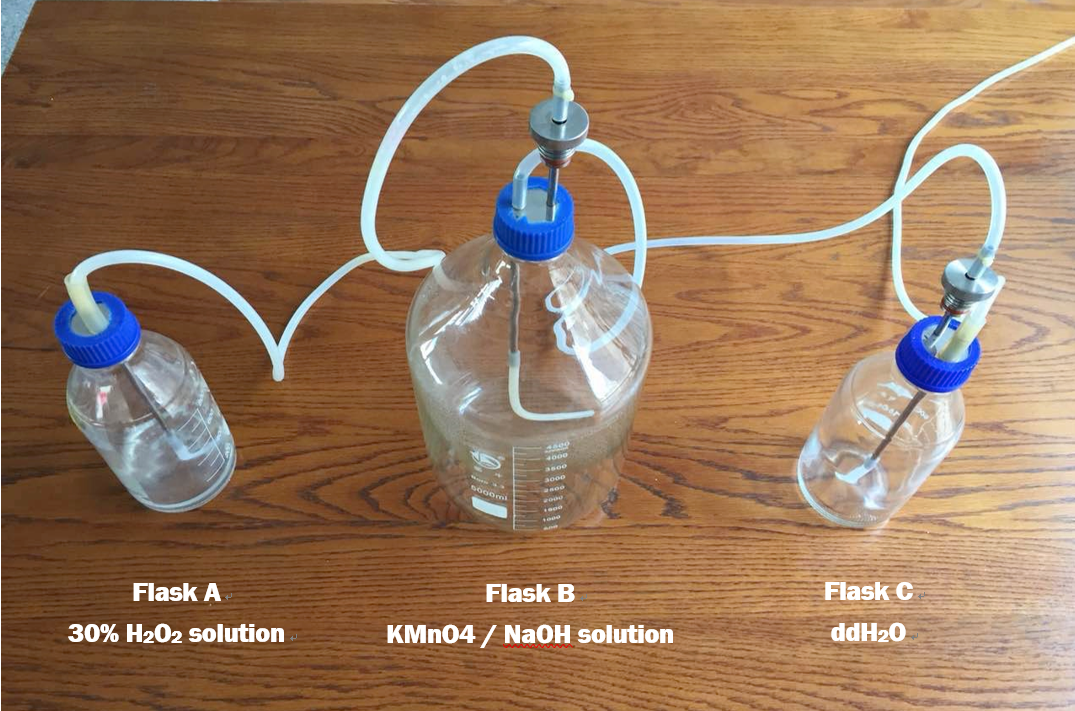
Fig 1. Setup of equipments for preparing NO solution
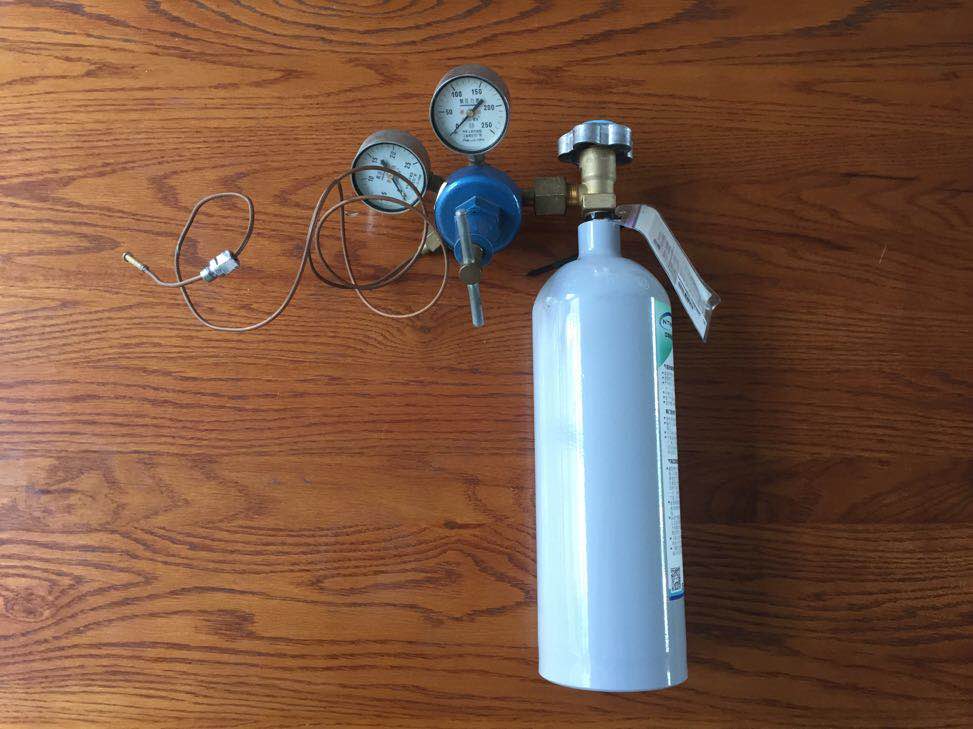
Fig 2. NO gas container
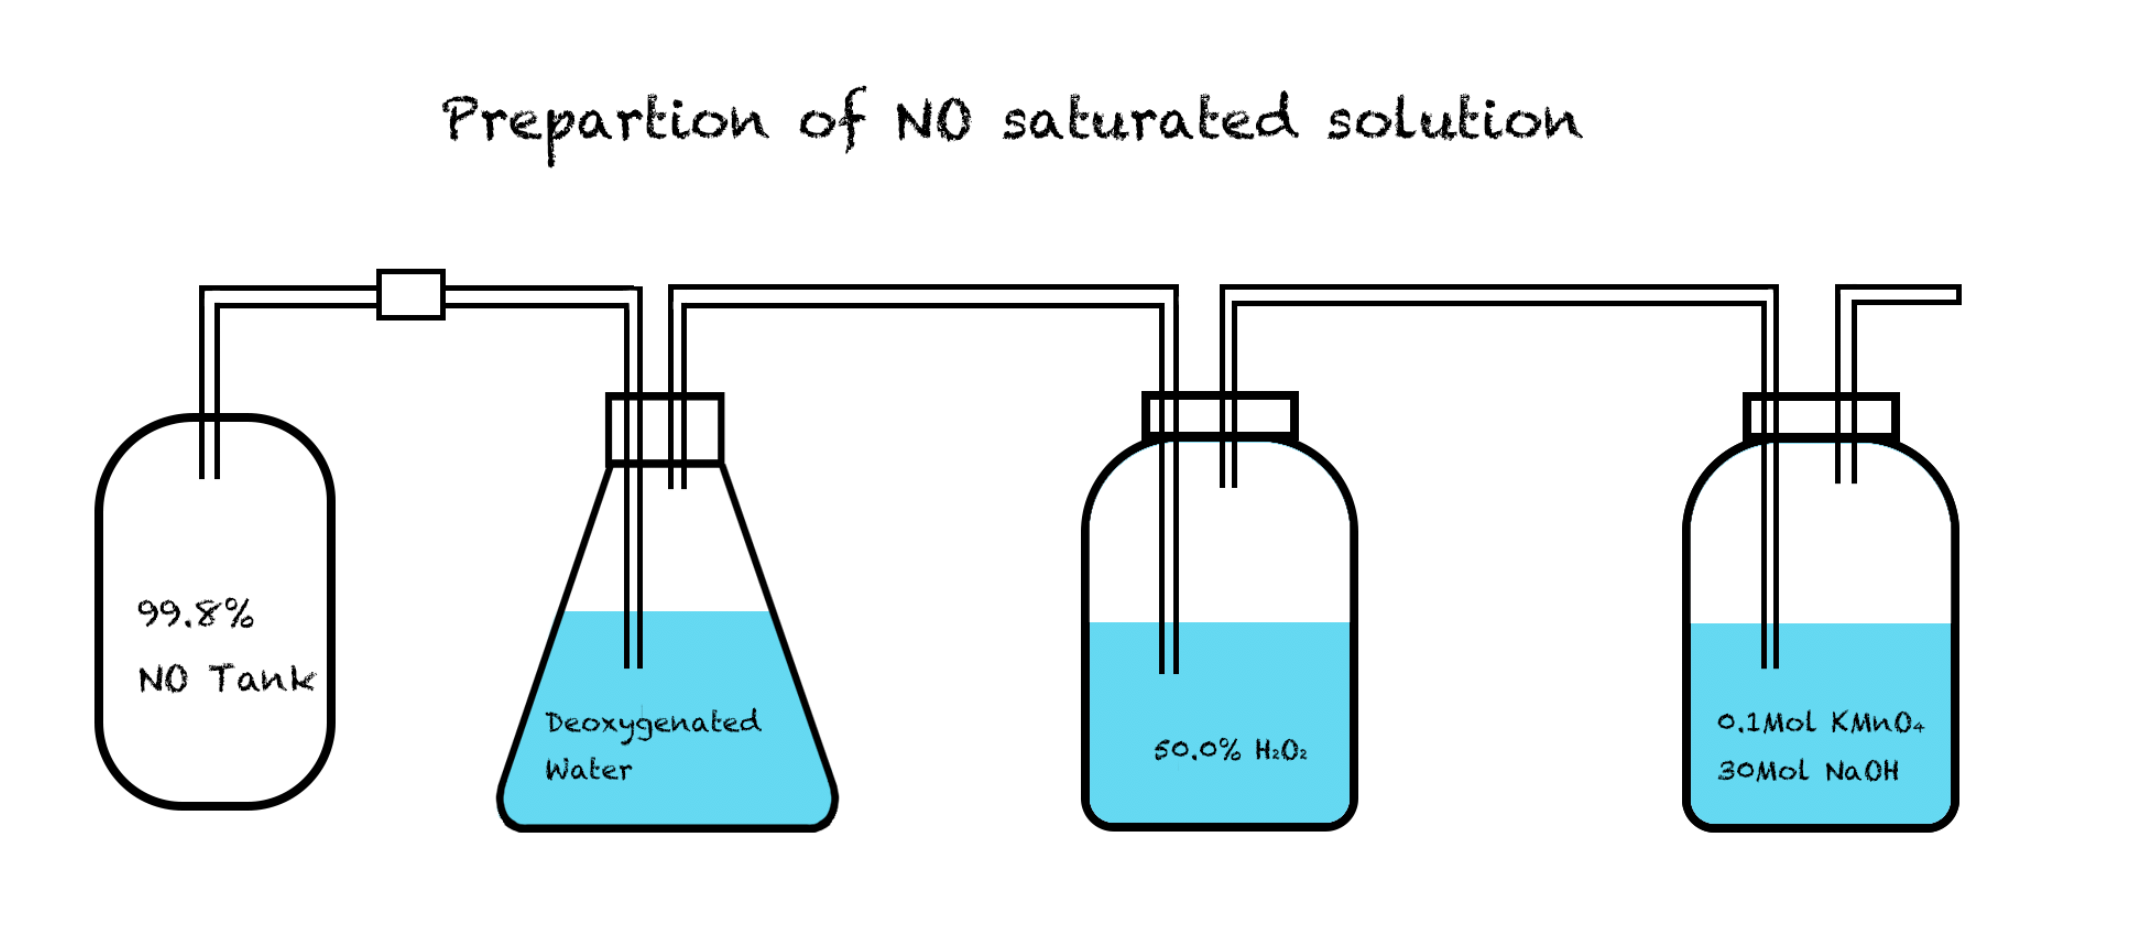
Fig 3. Equipments setup
Assay Method 2: Titration
By measuring the concentration of nitrous oxide—the final product of the reduction of nitric oxide, the amount of nitric oxide reacted can be calculated, and therefore the activity of nitric reductase can be verified. When the reaction is complete, acidic potassium permanganate is added to the solution, and the highly oxidative potassium permanganate reacts with nitrous oxide. We then use oxalic acid to titrate the remaining potassium permanganate. Therefore, the amount of potassium permanganate used in the reaction with nitrous oxide can be calculated, and the amount of nitrous oxide produce can be found.However, even for the most stable solution of nitrous oxide—the standard solution of 1.00mg/ml, nitrous oxide will escape in gas form, and the escaping speed is not constant. As a result, the method of directly measuring the amount of nitrous oxide is not valid.

Fig 4. Standard N2O solution
Assay Method 3: Gas-Phase Molecular Absorption Spectrometry
The turnover of the overall reaction of nitric oxide reductase was determined by monitoring the NADH consumption rate under various concentrations of NO, where the NO concentration was controlled by bubbling the NO/N2 mixed gas produced with the gas divider (ESTEC SGD-SC-0.5L). Unfortunately, since we could not find access to the required gas divider, we were not able to verify the results. The results from the original paper was shown in Fig 4.Protocol
1 |
Prepare the buffer: 0.1 M sodium phosphate at pH 7.2. |
2 |
Add reduced form of NADH. |
3 |
Purge the air in the buffer solution by nitrogen gas to prevent formation of NO2 before adding NO. |
4 |
Introduce NO gas into the sample solution after passing 1 M KOH and the buffer solutions. |
5 |
Incubate the buffer solution containing NO (2.5, 2.0, 1.6, 1.5, 1.2, or 1.0 mM) and NADH (0.16 mM) in the optical cell at 10°C for 5 min. |
6 |
Measure the absorbance (340nm) of the solutions. |
Results
Due to limited access to equipments, we could not directly measure the reactivity of NOR. However, experiments had been carried out for the same enzyme expressed also expressed in E.coli, with method listed above. For the continuation of our project, we had to draw conclusion from other's experiment results.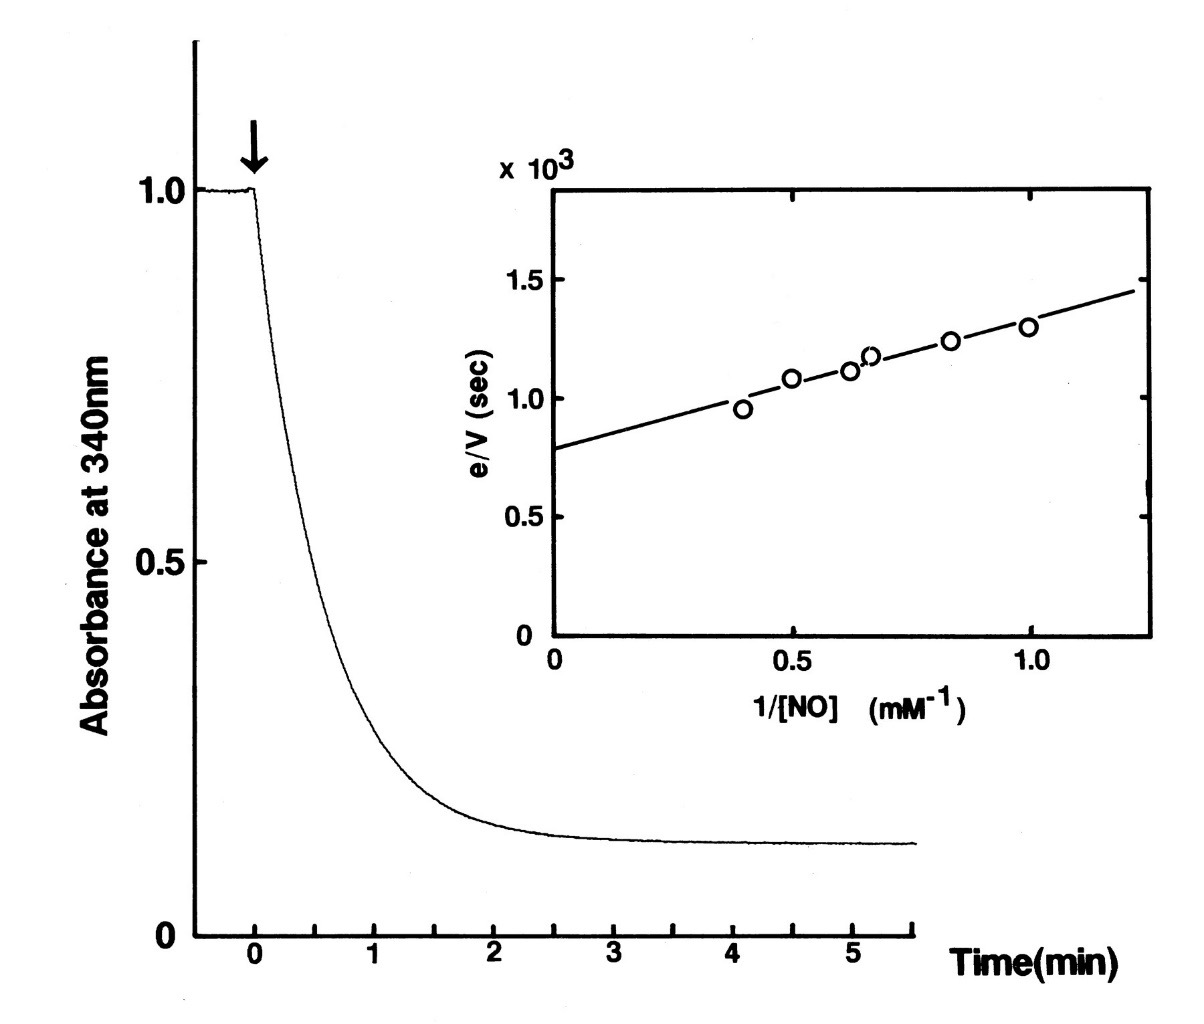
Fig 5. Time course of the absorption change of the reduced form of NADH at 340 nm in the NO reduction reaction catalyzed by P450nor. [2]
Conclusion
We delightedly found out that the curve became smooth and parallel to the x-axis just within the course of five minutes. This represented nearly all the substrates had been converted to products in an extremely rapid rate: much more rapid than nitrite reductase. This means that whenever NO is released from nitrite reductase as product, NOR can utilize it as substrate quickly.Reference
1 |
程得胜, 黄曜, 黄郁芳. 一氧化氮标准储备水溶液浓度的测定及稳定性分析[J]. 分析测试学报, 2007, 26(4):566-569. |
2 |
Shiro Y., Fujii M., Iizuka T., Adachi S., Tsukamoto K., Nakahara K., Shoun H. 1995. Spectroscopic and kinetic studies on reaction of cytochrome P450nor with nitric oxide. Implication for its nitric oxide reduction mechanism. J. Biol. Chem. 270, 1617–162310.1074/jbc.270.4.1617. |
3 |
Shoun H, Fushinobu S, Jiang L, et al. Fungal denitrification and nitric oxide reductase cytochrome P450nor[J]. Philosophical Transactions of the Royal Society of London, 2012, 367(1593):1186. |
$\mbox{NosZ}$ (Nitrous Oxide Reductase)
Background

Nitrous oxide reductase's tertiary structure
This enzyme catalyzes the reduction of nitrous oxide(N2O) to nitrogen(N2) and oxygen(O2). The enzyme comes from Agrobacterium tumefaciens. The enzyme contains two copper center, namely CuA and Cuz, which can transfer the electron.
Assay Method
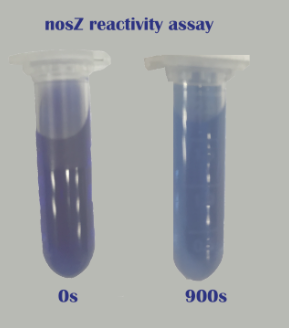
We prepared a standard measuring mixture(2ml) consisting of 50mM Tris-HCL(pH9), 0.5mM methyl viologen, a proper amount of NosZ and 1mM sodium dithionite and 160uL of nitrous oxide solution.Methyl viologen and sodium dithionite will go on to react and form a blue intermediate product, with a relativelly stable absorbance at 600nm. The blue intermediate product serves as an electron donor for the reduction process of nitrous oxide. Therefore, as the reaction goes on, the blue substance starts to lose electrons and its color dims, resulting in a lower 600nm absorbance. Thus, by directly measuring the change of 600nm absorbance of the system, we are able to track the processing of the reaction.
Results
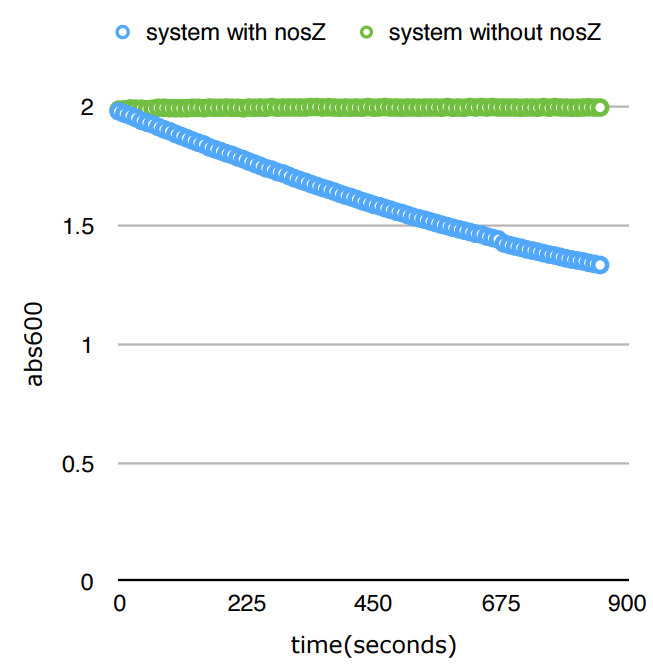
Conclution
We delightedly found out that for just 900 seconds, the abs600 value of the color reagent dropped 32%. This represented nearly all the substrates had been converted to products in an extremely rapid rate: much more rapid than nitrite reductase.And even though we cannot make the statement which among nosZ and NOR has a faster reactivity rate, we do know the fact that both enzymes react in a much faster rate than NiR.
Reference
1 |
Braker, Gesche & Fesefeldt, Andreas & P Witzel, K. (1998). Development of PCR Primer Systems for Amplification of Nitrite Reductase Genes (nirK and nirS) To Detect Denitrifying Bacteria in Environmental Samples. Applied and environmental microbiology. 64. 3769-75. |
2 |
Gong, B., Liang, X., Li, Y., Xiao, Q., Yang, P., & Wu, Y. (2017). Expression and purification of cytochrome p450 55b1 from chlamydomonas reinhardtii and its application in nitric oxide biosensing. Applied Biochemistry & Biotechnology(10), 1-11. |
3 |
Henry, S., Bru, D., Stres, B., Hallet, S., & Philippot, L. (2006). Quantitative detection of the nosz gene, encoding nitrous oxide reductase, and comparison of the abundances of 16s rrna, narg, nirk, and nosz genes in soils. Applied & Environmental Microbiology, 72(8), 5181-5189. Mu, Yunlong, et al. Molecular cloning and expression of a gene encoding nitrite reductase from Alcaligenes faecalis TR126. |
4 |
Kristjansson, Jakob K., and Thomas C. Hollocher. “First Practical Assay for Soluble Nitrous Oxide Reductase of Denitrifying Bacteria and a Partial Kinetic Characterization.” The Journal of Biological Chemistry, vol. 255, 27 Aug. 1979. |
5 |
Liu, Xueqian, et al. "The nos gene cluster from gram-Positive bacterium Geobacillus thermodenitrificans NG80-2 and functional characterization of the recombinant NosZ." FEMS Microciol Lett, vol. 289, no. 46, ser. 52, 2008. 52. |
6 |
Yeung, Natasha, et al. “Rational Design of a Structural and Functional Nitric Oxide Reductase.” Nature, 24 Dec. 2009. |