

Theoretically, our designed microorganism Follower D can produce lipase and therefore can be used to decompose fat into fatty acids. This activity of Follower D has been proved in our experiments and our conclusion is that microorganism Follower D can work properly as we designed.
The enzymatic reaction is suitable for the Michaelis-Menten equation. Therefore, in this part, we will use Michaelis-Menten equation to deeply discuss the relationship between the concentration of fat and production rate of fatty acids using mathematical modeling.
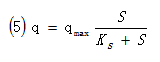
1. Equation constructedMichaelis-Menten equation
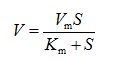
In those equations: S----Concentration of fat V----Fatty acid production rate (μmol/(L·h))
Therefore, based on equation, we constructed a simple relationship between concentration of fat (S) and production rate of fatty acids (V).
2. Experimental data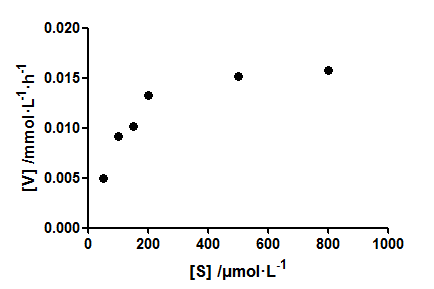
Fig. 1. Experimental data of fatty acid production rate (V) with different concentrations of fat (S)
Clearly, the relationship between S and V is not a linear correlation. At low concentrations of S, the V increases sensitively. While the concentrations of S reach a higher level, the V will tend to saturate. The curve satisfies the classical Michaelis-Menten equation, so it can be described by the Michaelis-Menten equation.
3. FittingThe following figure is what we fit the experimental data. Because the curve satisfies the classical Michaelis-Menten equation, we used the double countdown method to solve the parameters, fitting with least squares.
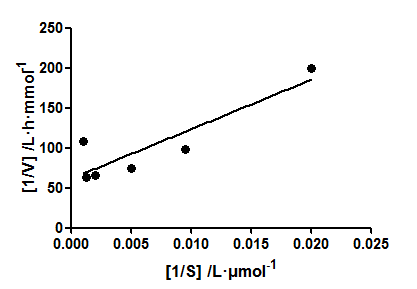
Fig. 2. Experimental data of 1/S versus 1/V
So, we got the following parameters: Vm= 21.37 μmol/(L·h), Km=157.66 μmol/L The equation: V=21.37S/(152.48+S) fit (1) The fitting result is pretty good (R2=0.978). In summary, we got a suitable equation to describe the relationship between the concentration of fat (S) and production rate of fatty acids (V).
 Modeling II
According to the Modeling I, we added a certain amount of Follower D, and we found a suitable equation to describe the relationship between the concentration of fat (S) and production rate of fatty acids (V). Thus, in the modeling II, we will deeply discuss the relationship between the concentration of Follower D and the concentration of fat (S) using mathematical modeling.
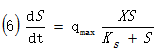
1. Equation constructionThe growth of Follower D and the kinetic equation of fat degradation. We need to consider three aspects. First, the growth rate of Follower D per unit. Second, the consumption of each unit of fat by Follower D (X). Third, the rate of utilization or degradation of fat per unit of Follower D. For these three aspects, we designed a set of equations that are listed as following:
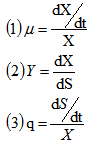
According to these three equations, we can get another equation:

Bringing (4) into the Monod equation, we get the following equation:
Based on the equations (3) and (5), we can get the following equation:
Based on the equation (6), we can get the following equation:
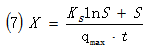
Finally, based on (7), we constructed a simple relationship among the concentration of Follower D (X), the concentration of fat (S) and the experimental time (t). In those equations: S----Concentration of fat qmax----The maximum rate of utilization of fat at per unit of Follower D. X----Concentration of Follower D Ks----Saturation constant μmax----The maximum growth rate of Follower D at per unit
2. Experimental data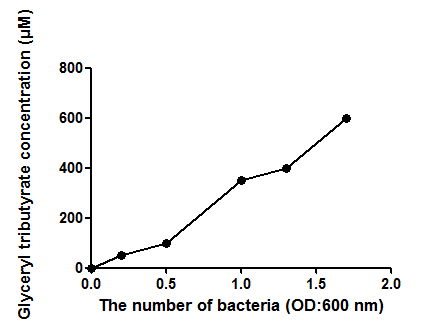
Fig. 3. Experimental data of different concentrations of Follower D (X) versus different concentrations of fat (S).
Clearly, the relationship between X and S is proportional; with elevated concentration of Follower D, the concentration of fat also increases.
3. FittingThe following figure is what we fit the experimental data. Based on the trend of the experimental data, we chose quadratic polynomial as the basic equation to fit our data.
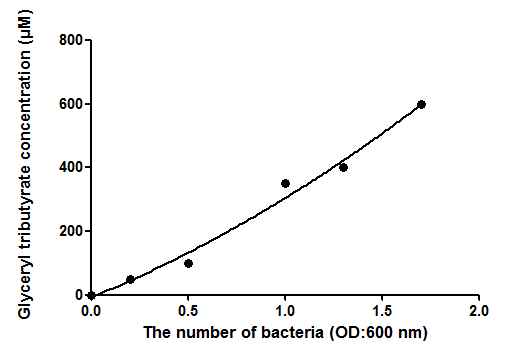
Fig. 4. The fitting experimental data of different concentrations of follower D (X) versus different concentrations of fat (S)
The equation: S=99.489X2+183.49X+0.5965 fit (2) We found that the fitting result pretty good (R2=0.9974).
In summary, we got a suitable equation fit (1) to describe the relationship between the concentration of Follower D (X) and the concentration of fat (S). When the rate of fatty acid production reaches the highest, we can easily use the equation above to predict the amount of the Follower D to be used in sewage treatment in any scenario of fat concentration to maximize fatty acid production efficiency.