Nagahama
Contents
- 1 Result and Discussion
- 1.1 Identification of yeast of Funazushi
- 1.2 proof of concept
- 1.3 Confirmation whether sod2 were inserted into pYES2 plasmid.
- 1.4 Confirmation that S. cerevisiae expressing sod2 acquired salt tolerance
- 1.5 Confirmation whether carotene synthesis genes (crtYB, crtI, and crtE) and tHMG1 were expressed.
- 1.6 GC/MS
- 1.7 HPLC
- 1.8 Reference
Result and Discussion
Identification of yeast of Funazushi
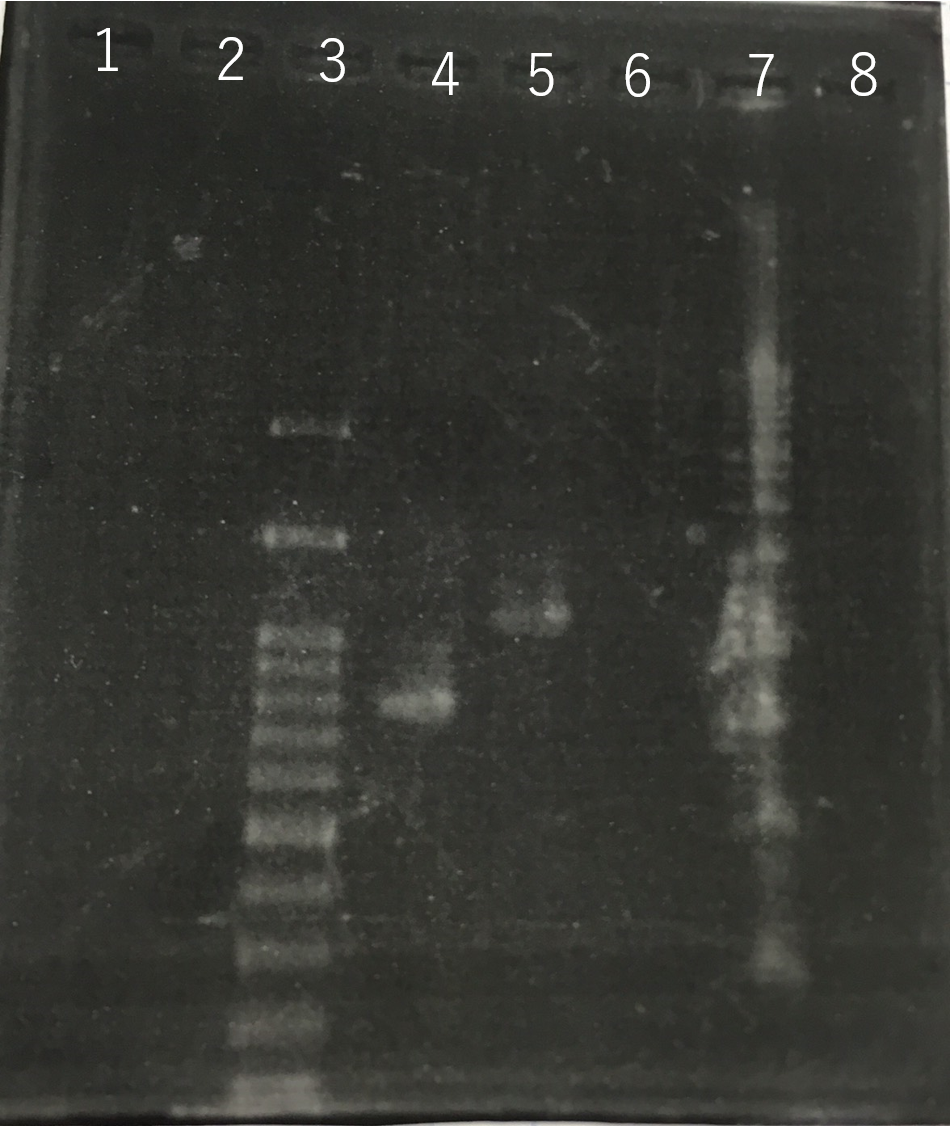
Funazushi was touched with a toothpick and streaked in YPD medium to grow yeast colonies. Colony PCR was performed with a primer that amplifies ITS 1 region. We sequenced the PCR products and identified yeasts of Funazushi. From the result of the sequence, the yeast of Funazushi was identified as S. cerevisiae. Therefore we decided to use S. cerevisiae BY 4742 which is commonly used in experiment as yeast to add nutrition in Funazushi.
proof of concept
First, S. cerevisiae BY4742 in order to be dominant species at high salt concentration and low pH,we investigated whether it is necessary to develop a new recombinant S. cerevisiae adapting severe environment. Accoding thesis, it is known that the salt concentration of Funazushi is 4% and pH is 3.7.[1]So we experimented whether S. cerevisiae BY 4742 could grow like S. cerevisiae of Funazushi under this severe environment.
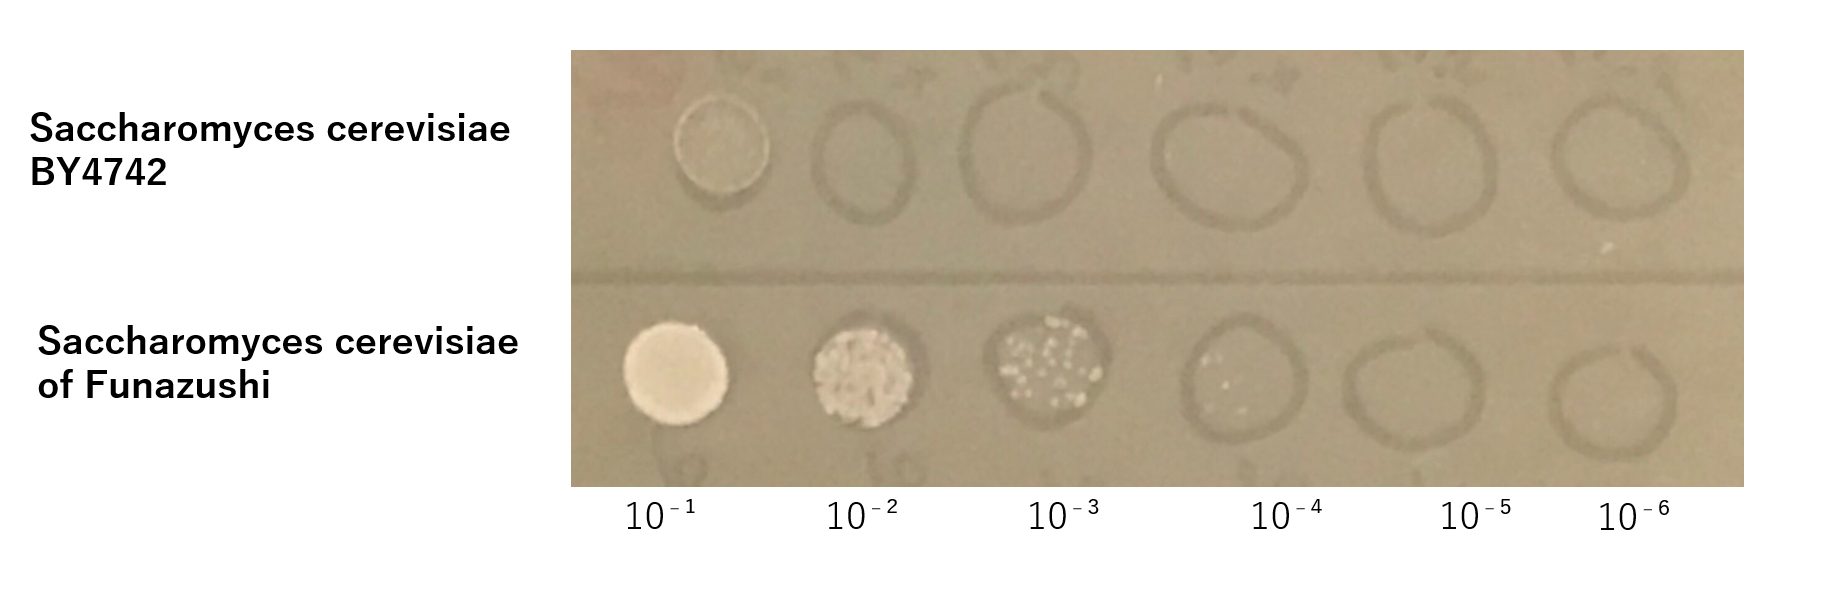
The growth of S. cerevisiae BY4742 cells and S. cerevisiae of Funazushi was tested on plates containing sodium.
This figure(fig.2) showed that S. cerevisiae of Funazushi's growth rate at high salt concentration was faster than S. cerevisiae BY4742.
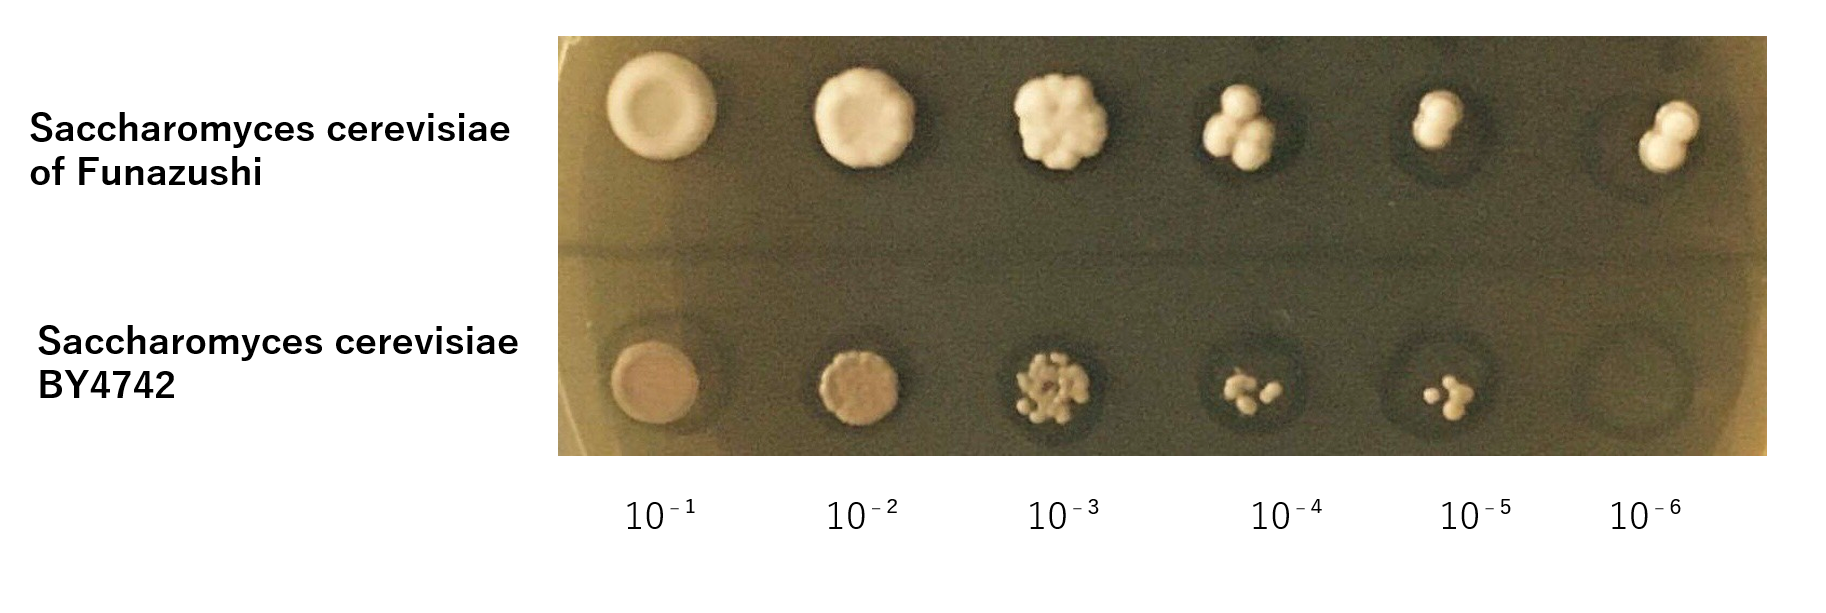
The growth of S. cerevisiae BY4742 cells and S. cerevisiae of Funazushi was tested on plates containing Lactic acid.
Confirmation whether sod2 were inserted into pYES2 plasmid.
The front and the back part of the intron of sod2 were separately amplified by PCR. The forward primer of sod2 located back the intron contained the sequence of reverse Primer in the front of intron as an adapter.
Using these two PCR products, fusion PCR was performed.
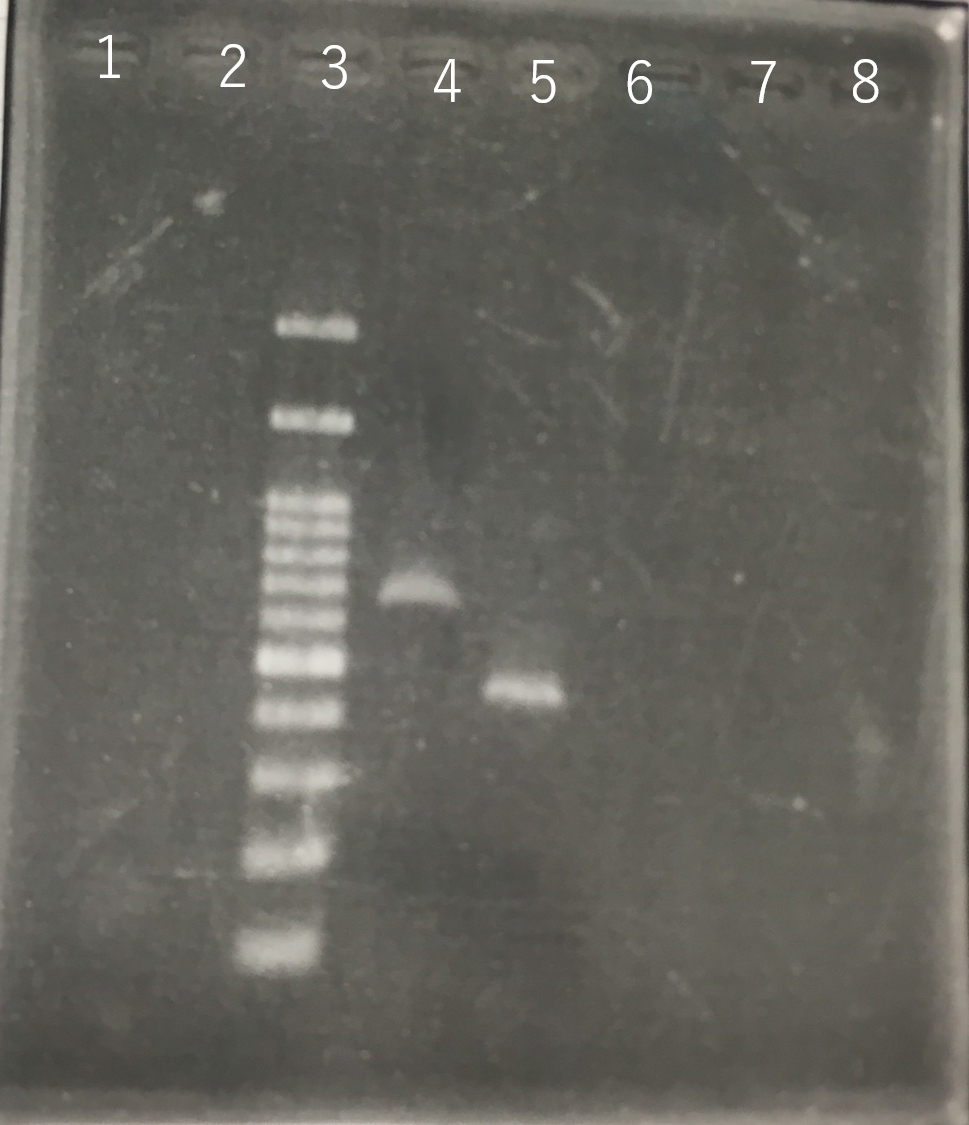
The completed PCR product of the coding region of sod2 was integrated into pYES2 plasmid and transfered the resultant plasmid into E.coli. Plasmid extraction was performed from the transformed E. coli . Using the restriction enzyme used to ligate the PCR product of sod 2 with pYES2 Plasmid, the plasmid extracted from E. coli was cut and the length was confirmed by electrophoresis.The length of pYES2 plasmid is 5856bp.
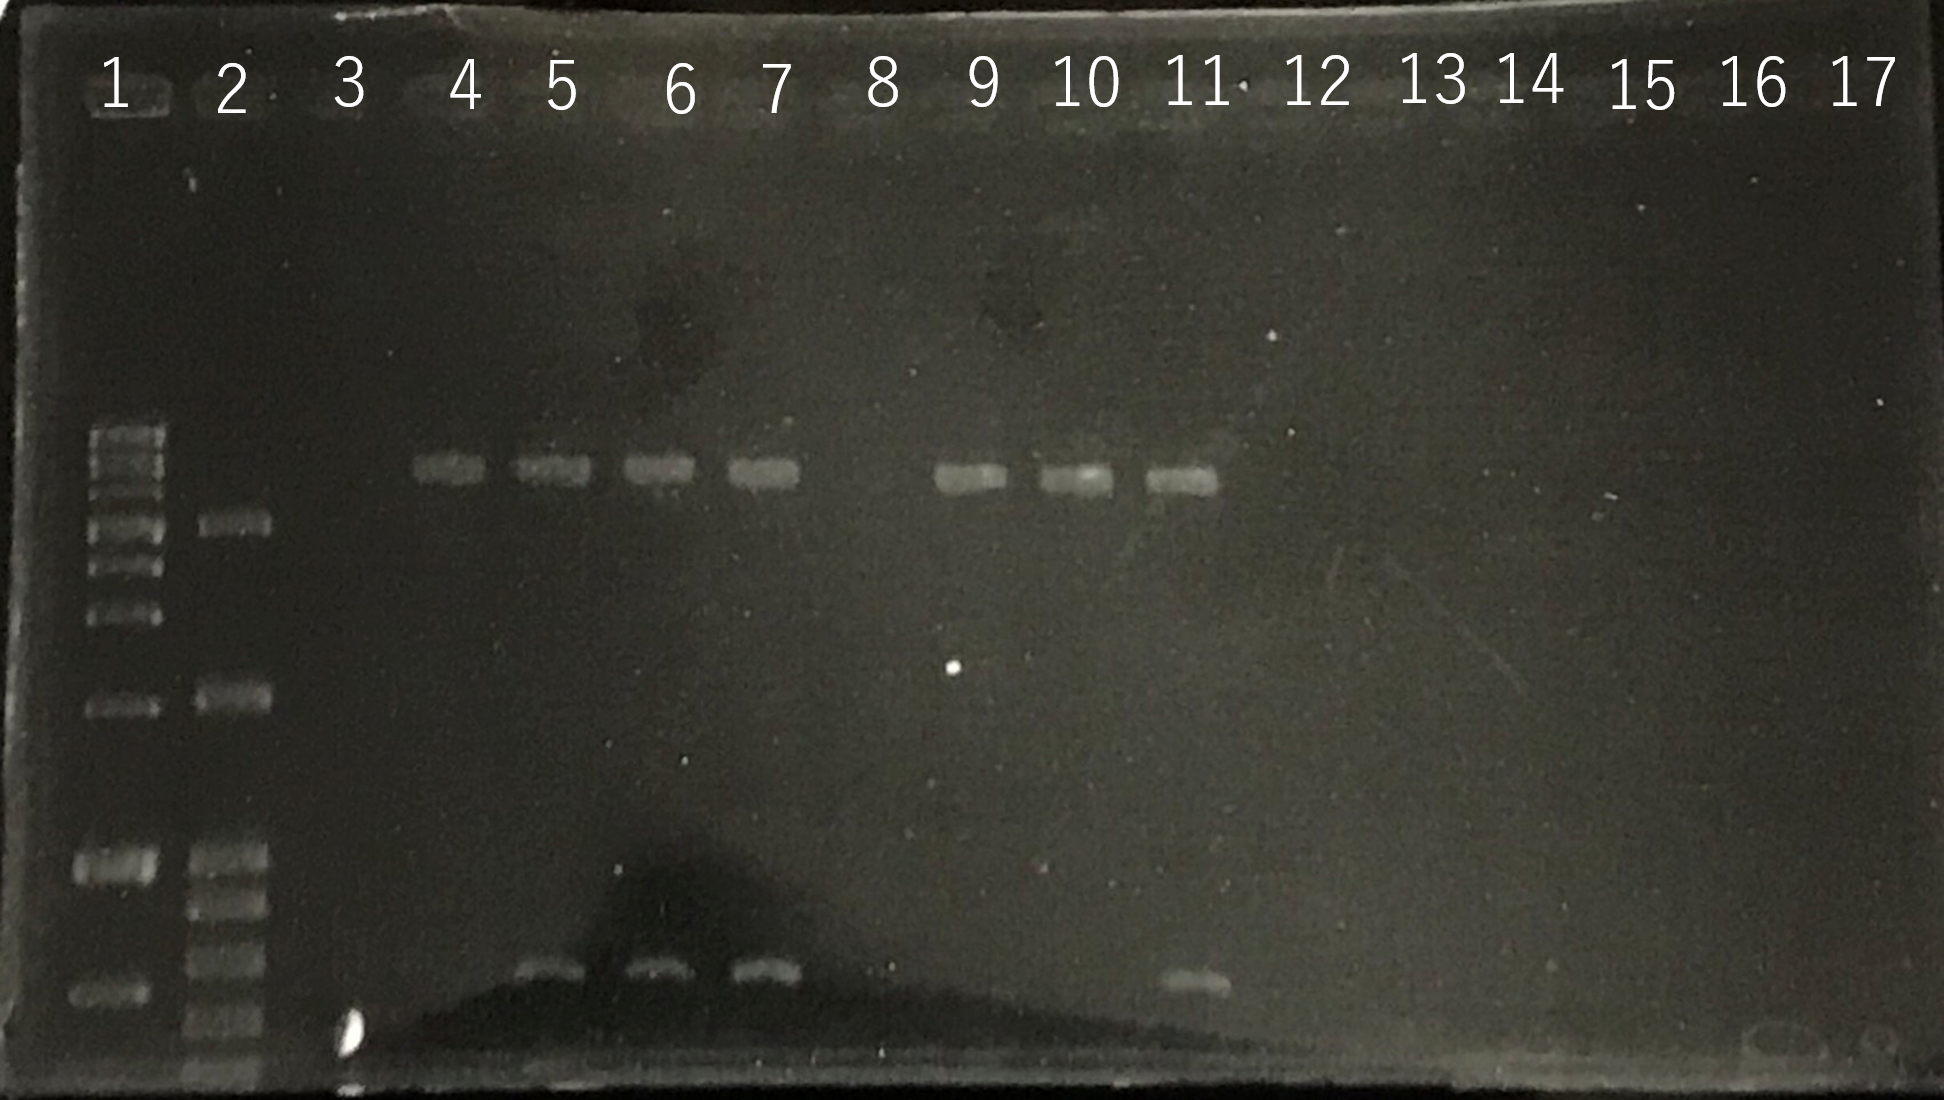
Lane1:1kb DNA ladder
Lane2:100bp DNA ladder
Lane3:Nothing
Lane4:Plasmid extraction from colony1
Lane5:Plasmid extraction from colony2
Lane6:Plasmid extraction from colony3
Lane7:Plasmid extraction from colony4
Lane8:Plasmid extraction from colony5
Lane9:Plasmid extraction from colony6
Lane10:Plasmid extraction from colony7
Lane11:Plasmid extraction from colony8
These result (fig.4,5,6,7)showed that sod2 was introduced into pYES2 extracted colony 2, 3, 4 and 8. S. cerevisiae BY4742 was transformed with the plasmid.
S. cerevisiae transformed was grown onto sd-ura medium. This figure(fig.8) shows that the pYES2 plasmid inserted sod2 was introduced into S. cerevisiae.
Confirmation that S. cerevisiae expressing sod2 acquired salt tolerance
The growth of S. cerevisiae BY4742 cells expressing sod2 was tested on plates containing sodium.
This figure (fig.9) shows that S. cerevisiae cells that overexpress the sod2 product is more survived on SD-ura medium supplemented with 4.0 % (w/v) NaCl than the counterpart control S. cerevisiae transformed with an empty vector.
Confirmation whether carotene synthesis genes (crtYB, crtI, and crtE) and tHMG1 were expressed.
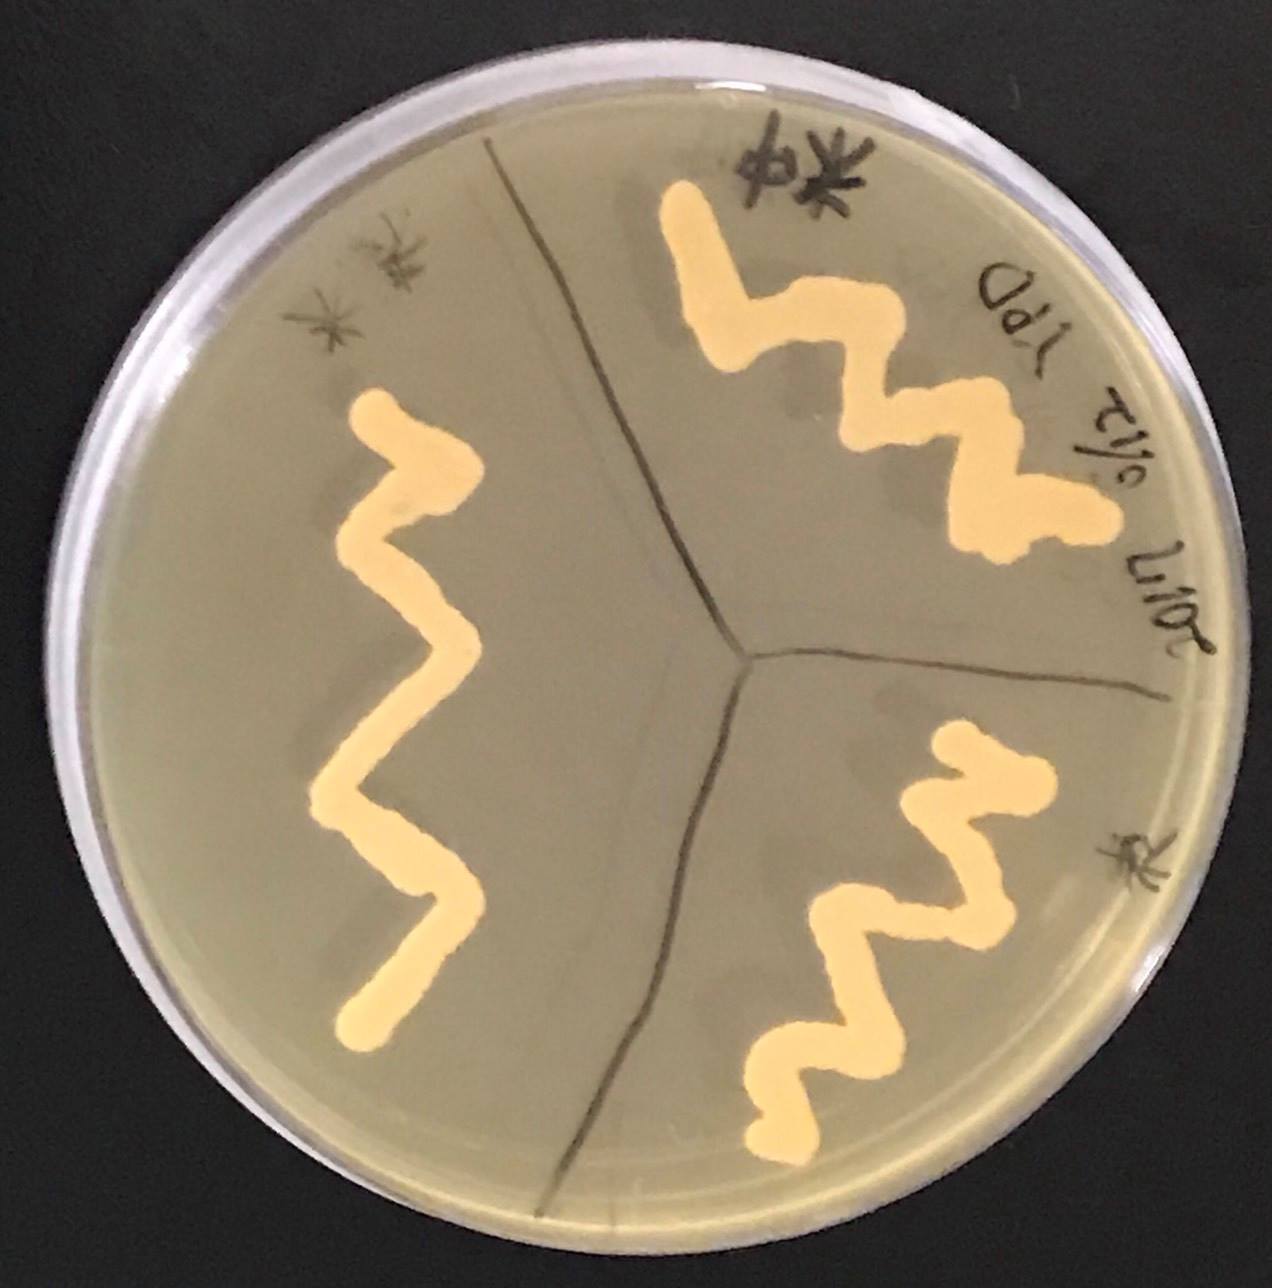
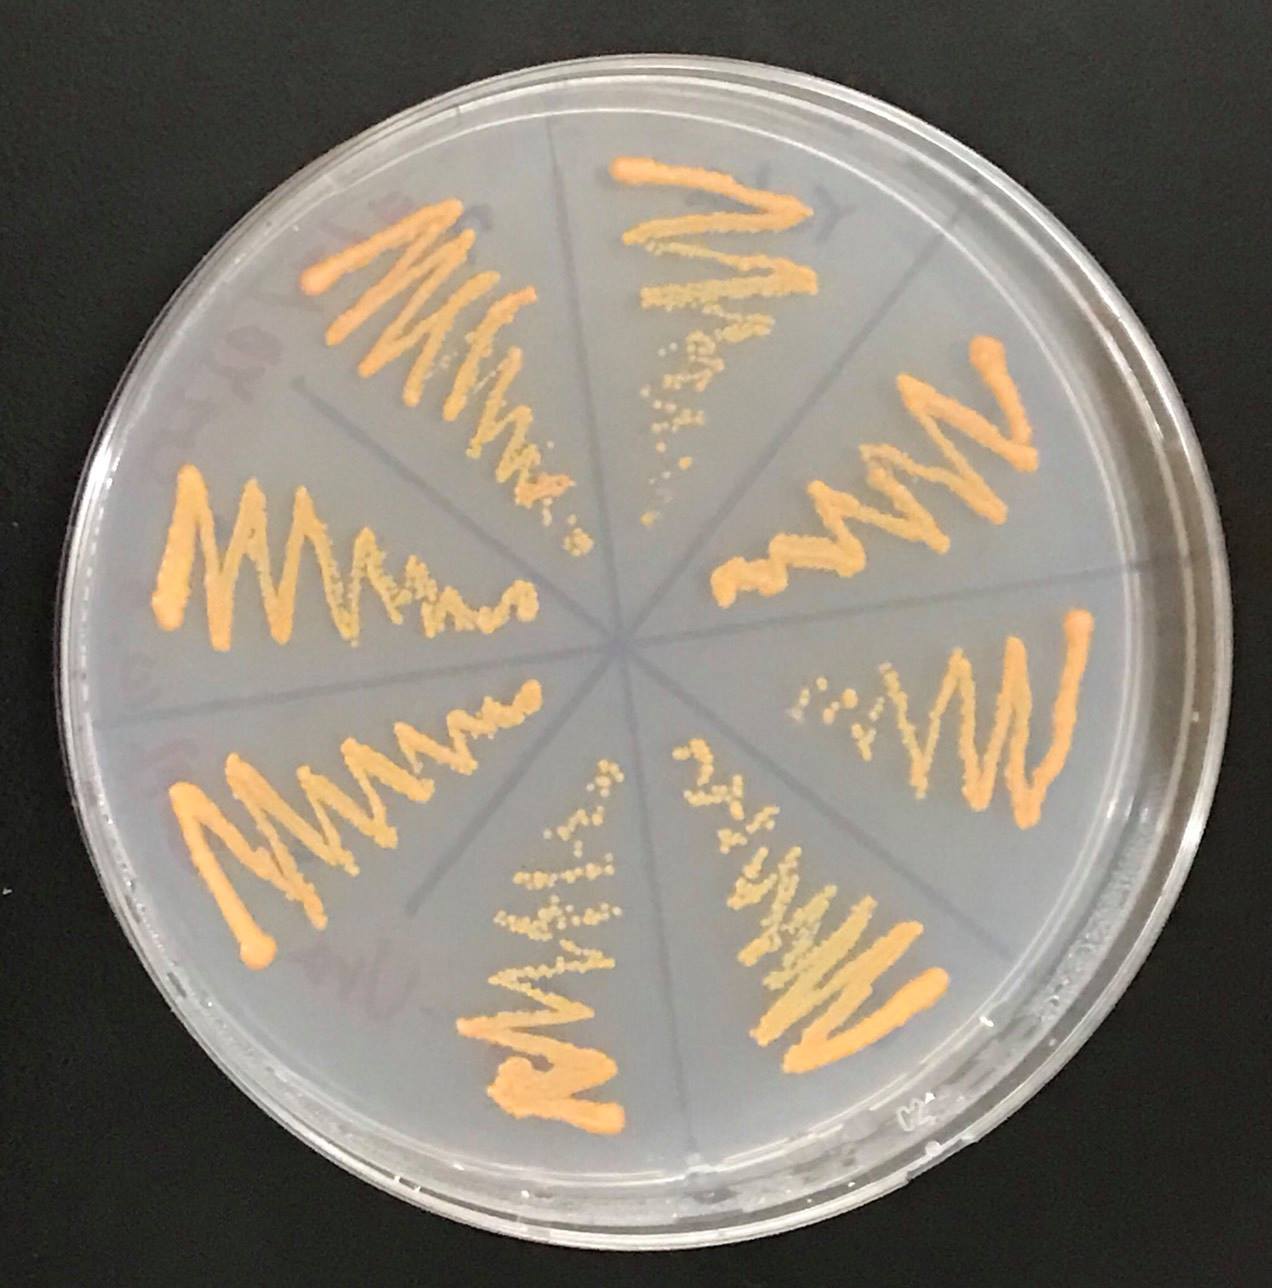
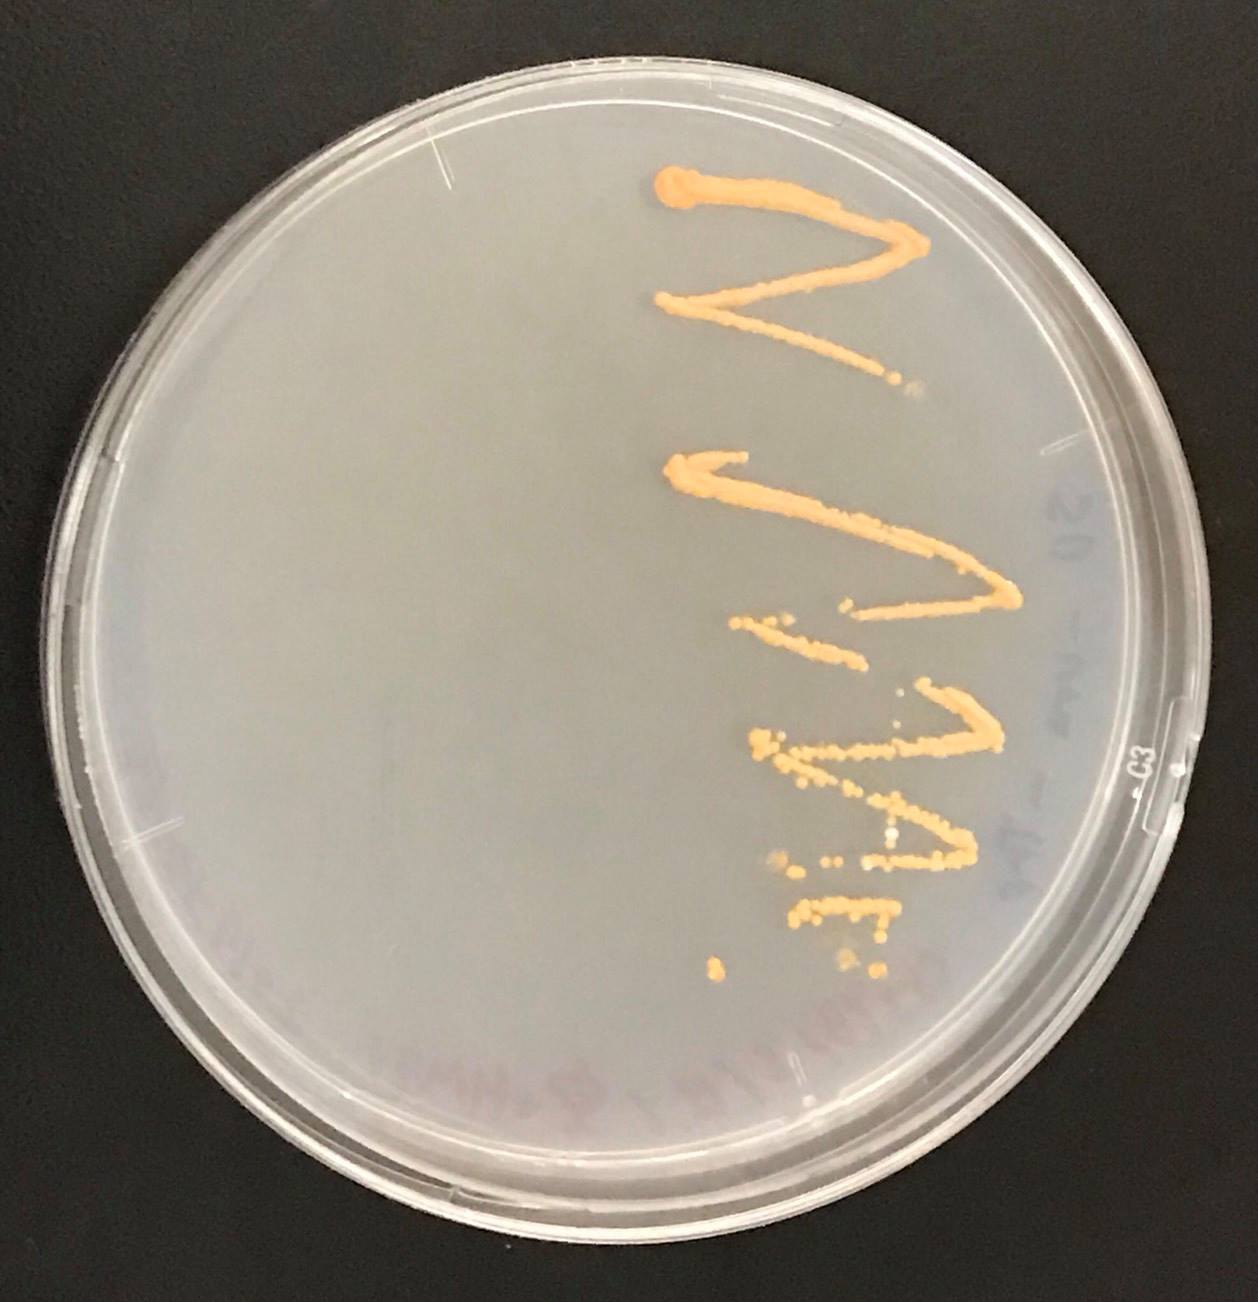
Constructs of carotenogenic genes were inserted on genome of S. cerevisiae. We insertion of crtYB, crtI and crtE resulted in orange colonies.(fig.10)
In addition, in order to increase production of beta-carotene, HMG1 gene was also inserted on the genome of S. cerevisiae. Transformation of tHMG1 to S. cerevisiae synthesizing carotenoid resulted in yellow colonies.(fig.11)
Transformation of tHMG1 resulted clear color difference.(fig.10,fig.11,fig12) From this result, it is considered that tHMG1 was integrated into S. cerevisiae.
We also introduced an empty vector of insert which tHMG1 was not inserted as control S. cerevisiae.
This Color change shows, show that carotene synthesis genes (crtYB, crtI, and crtE) and tHMG1 were expressed.
Accoding to the paper, when tHMG1 is introduced, the amount of β-carotene synthesized is increased seven times as compared with when not.[2] It is thought that S. cerevisiae which we created by inserting YB / I / E + tHMG1 also has increased β carotene content.
GC/MS
Analysis of odor component of Funa-zushi using GC / MS We analyzed the odor components of 3 types of Funa-zushi. We weighed 42.9 g of sample A, 48.6 g of sample B, 51.3 g of sample C (fish meat, only egg), shredded them, put each sample in a 1 liter round bottom flask, and put pure 30 ml into it . Each sample was steam distilled for 60 minutes, and 100 ml of these distillates were obtained. These distillates were extracted with ether three times to obtain 150 ml of ether extract. The ether extract was transferred to a 300 ml Erlenmeyer flask, placed in a 36 ° C. water bath, and concentrated at normal pressure until the volume reached 15 ml. This solution was transferred to a test tube with memory and concentrated to 1 ml with argon gas. From this, 5 μl was taken out with a syringe and analyzed with GC-MS (GC-2010 SHIMADZU, GC-MS-QP2010 Plus). Compounds detected as major peaks were collated with a database and the detected peaks of the standards of the compounds were compared with the detected peaks of the samples to determine that the compounds estimated therefrom were contained in the sample. The results (Table 1) suggest that Sample A contains propionic acid and oleic acid. It cannot be concluded that the other peaks are the compounds shown in Table 1. Sample B is considered to contain 4-allyl-1,2-dimethoxybenzene and oleic acid or palmitic acid. It cannot be concluded that the other peaks are the compounds shown in Table 1. Sample C is considered to contain 4-allyl-1,2-dimethoxybenzene. It ca not be concluded that the other peaks are the compounds shown in Table 1. It is thought that it is necessary to review the sample adjustment to obtain more accurate results.
HPLC
Amino acids were quantified to improve taste.
[[File:西川レーダー.png|500px|thumb|left]
[[File:竜王円.png|500px|thumb|left]
[[File:竜王レーダー.png|500px|thumb|left]
Reference
[1]Fujii T, Watanabe S, Horikoshi M, Takahashi H and Kimura B, PCR-DGGE analysis of bacterial communities in funazushi, fermented crucian carp with rice, during fermentation. Fish Sci 77: 1–7 (2011).
[2]Verwaal R, Wang J, Meijnen JP, Visser H, Sandmann G, van den Berg JA, van Ooyen AJ (2007) High-level production of beta-carotene in Saccharomyces cerevisiae by successive transformation with carotenogenic genes from Xanthophyllomyces dendrorhous. Appl Environ Microbiol 73(13):4342–4350


