Team:SCU China/Repressilator/Repressilator/rbs


Because we want to mimic the process of melatonin
production in human, we need to
elongate the period cycle of repressilator. According to the modeling results of
repressilator, faster translation is helpful to the period elongation; thus, a strong
ribosome binding site may be required. Then, we scanned the iGEM registry, finding that
we only have a small number of ribosome binding sites whose strengths have been
determined. Therefore, we decided to modify an existing RBS in iGEM registry by
ourselves to obtain a series of stronger ribosome binding sites.
Random mutation of RBS will generate a huge library,
which will increase our workload
grandly with numbers of useless mutations. Thus, we turned to a bioinformatics method to
predict the sequence of a synthetic RBS with a target translation initiation rate on a
proportional scale. We designed our RBS via the modeling in the website
(https://salislab.net/software/doForwardRBS)1, which was based on the theory that build
on previous work that characterized the free energies of key molecular interactions
involved in translation initiation and on measurements of the sequence-dependent
energetic changes that occur during RNA folding and hybridization.1
According to the modeling results of RBS
modification, we chose three designed RBS,
whose translation rate is predicted to be stronger than the original part: BBa_B0034.
The existing Part (BBa_I13521) is a reporter device constitute of TetR repressible
promoter (BBa_R0040), RBS (BBa_B0034), mRFP1 (BBa_E1010) and double terminator
(BBa_B0015). In our project, we managed to alternate the RBS region with our designed
RBS and to construct new part named Part:BBa_K2276007,Part:BBa_K2276008,
Part:BBa_K2276010 separately.
According to the mathematical modeling result of RBS prediction by the RBS Calculator, the predicted translation initiation rate of BBa_B0034 was 2297.59au. And we chose three designed RBS,which was predicted to be 5、10、50 times stronger than B0034,and was separately designated as P1, P2,P3. (Table 1)
| Synthetic RBS | Sequence | Translation Initiation Rate | Relative Prediction Strength |
|---|---|---|---|
| P1 (BBa_K2276007) | TATAAGGAGTAAATACC | 11153.91 au | 4.86 |
| P2 (BBa_K2276008) | AAATAAGGAGG | 25075.0 au | 10.91 |
| P3 (BBa_K2276010) | AAATAATAAGGGGTTTAC | 41213.03 au | 17.94 |
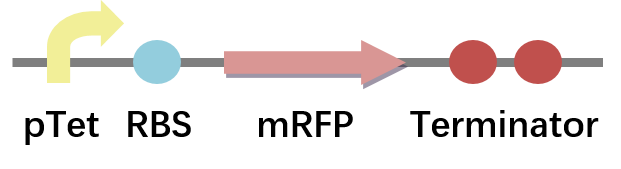
Then, we constructed the plasmid containing pTet, synthetic RBS, CDS of mRFP and double terminator. (Fig.1) The only difference between the different constructed plasmids and the pSB1C3-BBa_I13521 plasmid is RBS.(Fig.2) And these plasmids were characterized via sequencing.

Next, we measured the fluorescence intensity and the absorption the absorption value in
OD600nm of these cultures with different plasmids according to the following methods:
1. Streaked the plate with Bacterial Glycerol containing the constructed plasmid.
2. Picked single clones from the plate and incubate overnight
3. 12ml tubes containing 1ml liquid LB was inoculated with the overnight cultures using
a 1:100 dilution.
4. Tested the fluoresce strength every 2 hours after inoculation sampled from different
tubes via plate reader.
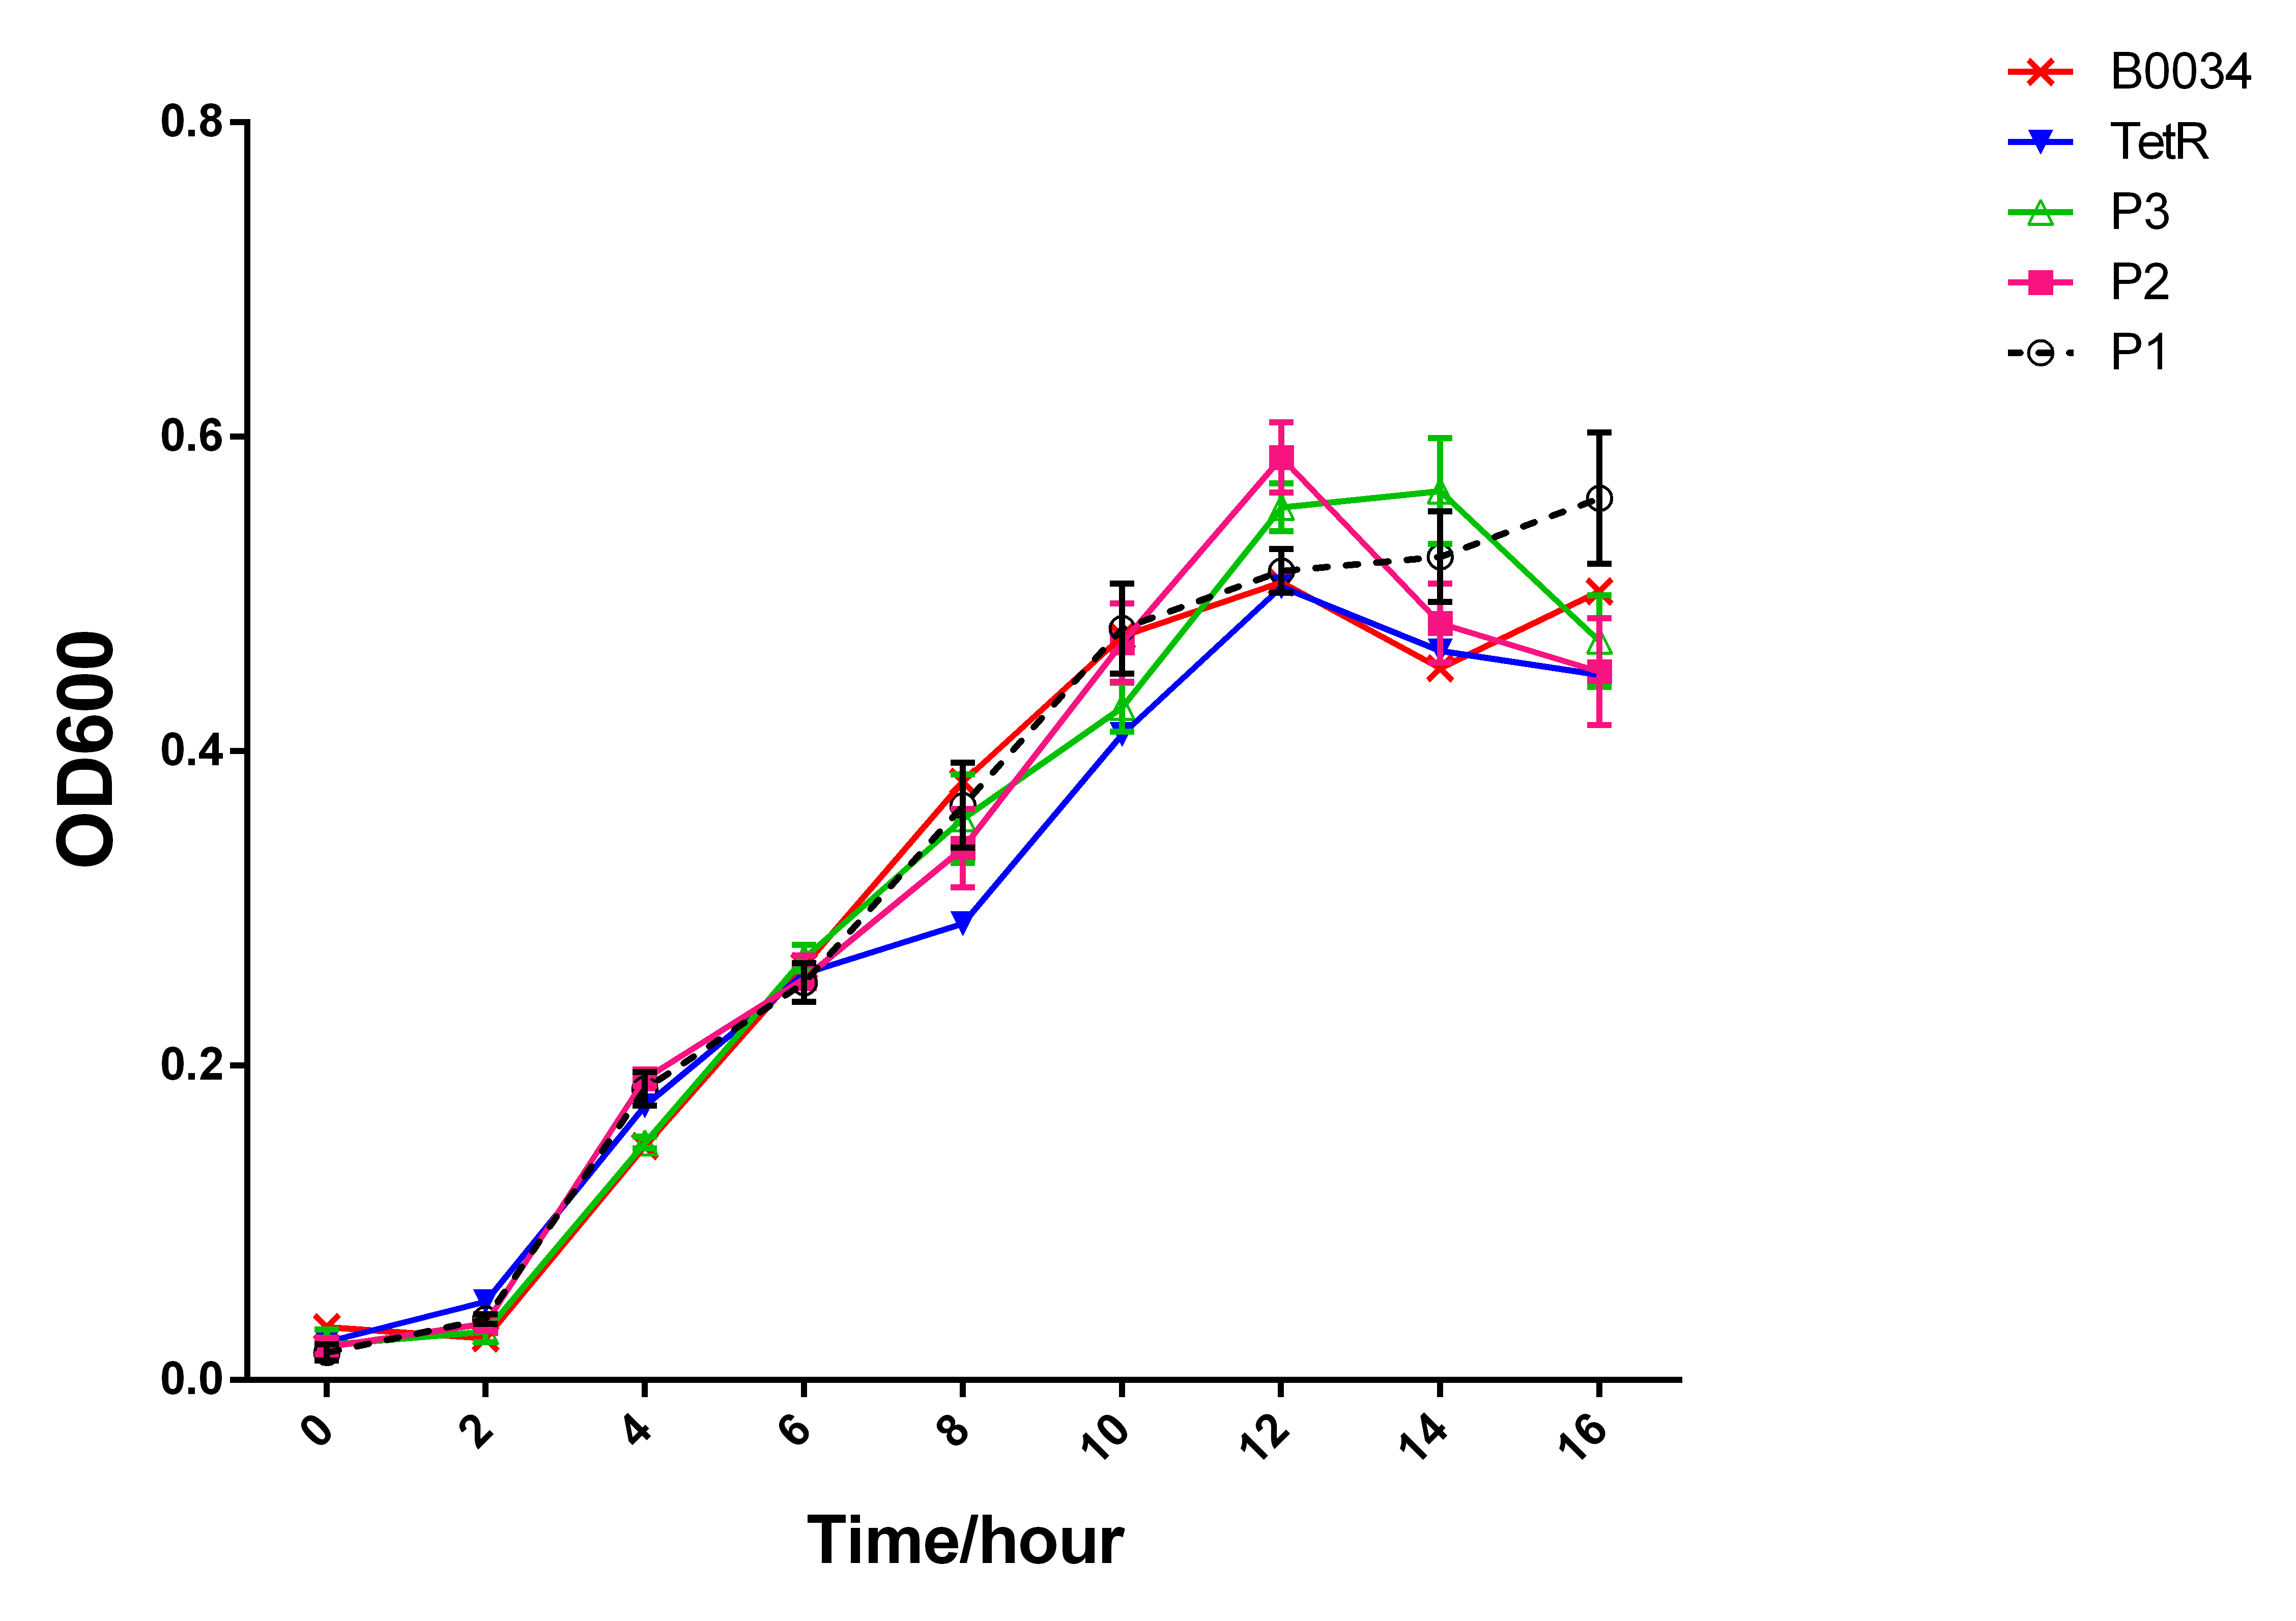
We can see that those strains have similar growth pattern,which indicated that the
fluorescence discrepancy had nothing to do with the quantity of the bacteria and the
growth conditions. (Fig.3)
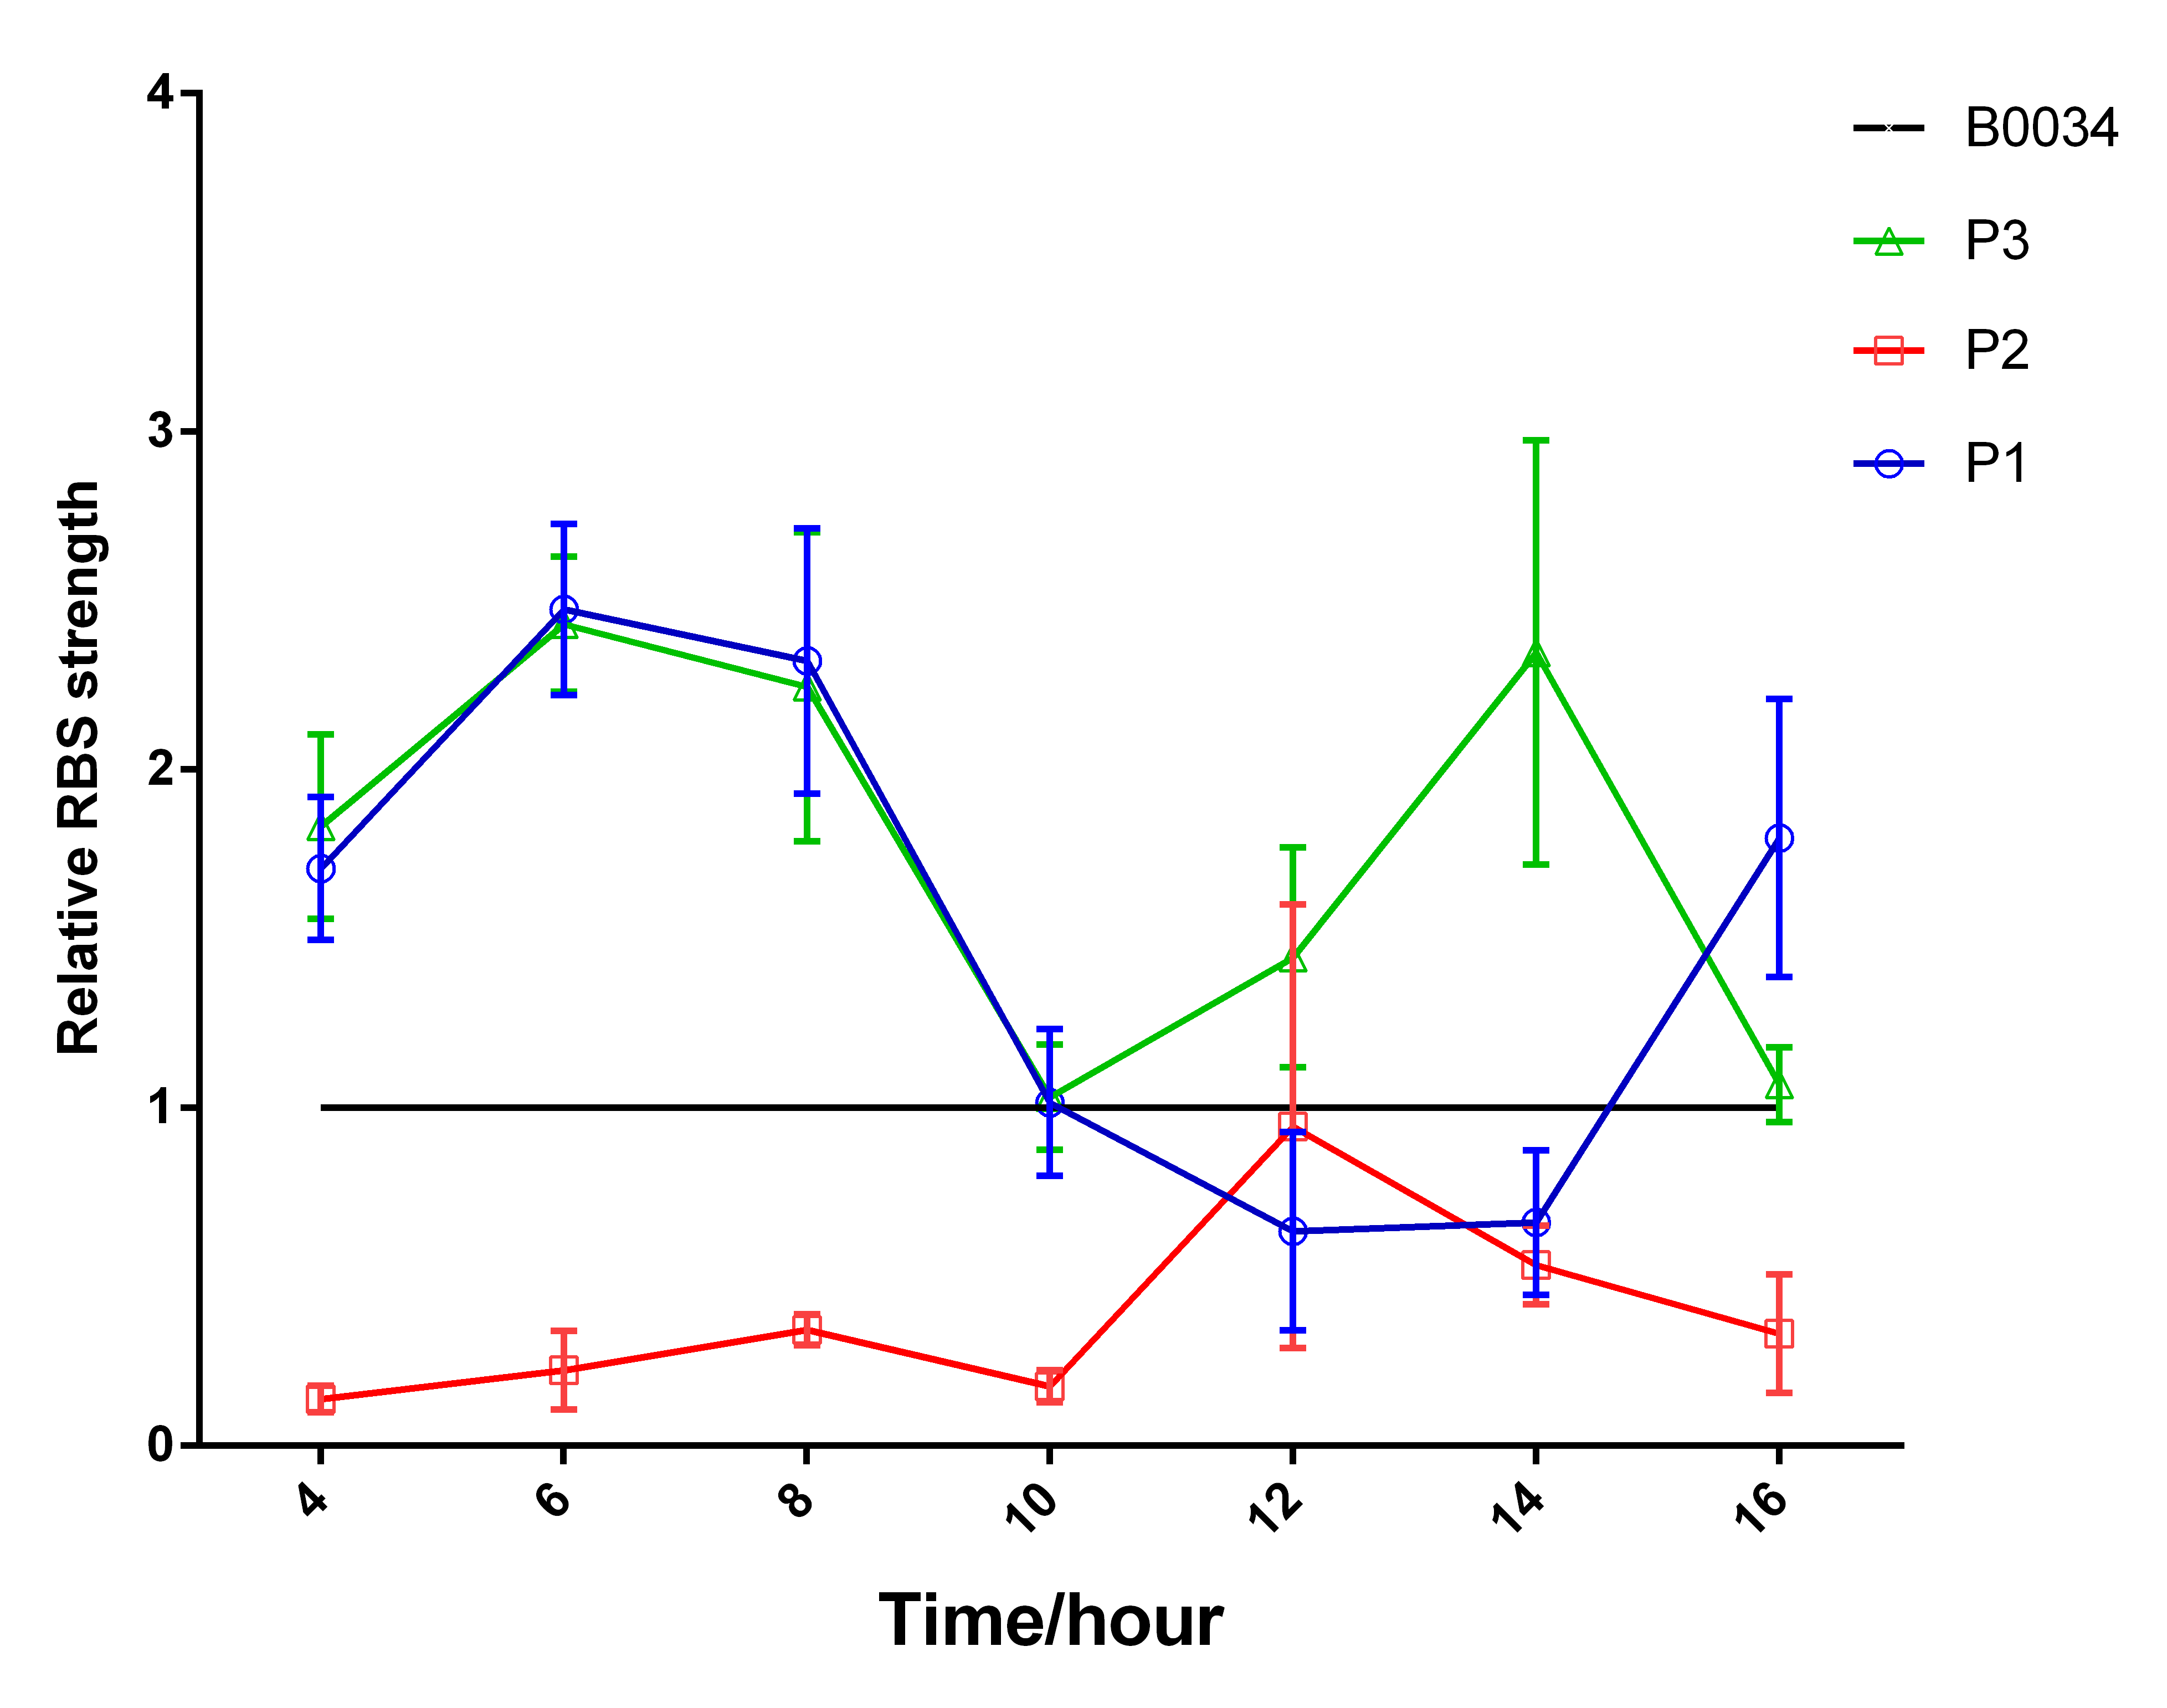
And the fluorecent measurement results showed that synthetic RBS P1 and P3 were obviously strong than RBS BBa_B0034. (Fig.4) In addition, we calculated the relative RBS strength via dividing (fluorescence intensity/ OD 600) by (fluorescence intensity of B0034). And this result further illustrated that the synthetic RBS (P1 and P3), especially P3, had obviously higher RBS strength than B0034; that is, the function of the original part (BBa_I13521) was indeed improved by us. (Fig.5)The drop at 16hours of P3 strain may result from the self-quenching which will happen when the concentration is too high. The cause may be the overlap of the emission spectrum and the absorb spectrum or the interaction between stimulated molecule. (Fig.4)(Fig.5)
However, the experimental results of synthetic RBS P2 was not consistent with the prediction results; that is, the synthetic RBS P2 was weaken than the original RBS. In addition, the relative strength of these three synthetic RBS were less than the prediction results (Fig.5). Nevertheless, the qualitative results was consistent between RBS prediction results and experimental results in most cases. Thus, the results convinced us that the design method was reliable so that we can anticipate if we apply the method in our project, and we could increase the translation rate of interested protein and elongate the periodic cycle.