Team:UBonn HBRS/Description/Enzyme Assays
Enzyme Assays
This enzyme assay was performed to measure the enzymatic activity of the enzyme Glycosyltransferase-SI (also known as Glucansucrase, EC 2.4.1.5) from Streptococcus mutans. It makes use of the Dinitrosalicylic Acid Method which is described by Gail Lorenz Miller in her paper from 1959.¹ In fact nowadays more exact ways of determining the Glucansucrase activity are known, since the dinitrosalicylic acid method tends to strong over-oxidization.² We still decided to use it, due to its simple execution and little amount of enzyme needed. This assay will later be used to evaluate the inhibition of the enzymatic activity of GTFC through possible aptamers.Miller reaction
The Miller assay is based on the detection of fructose which is formed upon the sucrose hydrolysis of the glycosyltransferases from S.mutans. The glucansucrase cleaves sucrose (a dissacharide consisting of fructose and glucose) and connects the glucose-units to glucans, i.e. a polysaccharide consisting solely of glucose molecules. The cleavage of the sucrose delivers fructose-monomers.

In the Miller reaction, the fructose produced by GTFC reduces
3,5-dinitrosalicylic acid (DNS) to 3-amino-5-nitrosalicylic acid.

3-amino-5- nitrosalicylic acid has its absorption maximum at 575nm (red) and can thus be detected photometrically. An increasing absorption at 575nm is proportional to the production of 3-amino-5-nitrosalicylic acid and thus the production of fructose.
Results
In order to be able to convert the absorption of 3-amino-5-nitrosalicylic acid at 575nm to defined fructose concentrations, we first produced a standard curve with known fructose concentrations. (Figure 1)
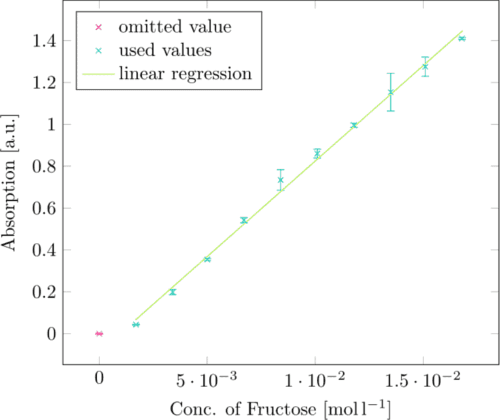
The linear regression of this standard curve can be converted from
Absorption = 91.190 764 · c(Fructose) − 0.08723
to
c(Fructose)=[Absorption + 0.08723]/91.190764
giving us a fructose concentration for absorbance values at 575nm.
Then we performed the assay with sucrose concentrations of 30, 20, 15, 10 and 5 mM, adding 1µg of GTFC and incubated at 37˚C for 24, 18, 12 and 6 minutes. It is important not to use too low sucrose concentrations and not to set the incubation time too long. For a Lineweaver-Burk plot we need the initial velocities v₀. If we let the enzyme incubate too long or use not enough sucrose, fructose concentrations will reach a constant level. Values in this area shouldn’t be used to calculate v₀! The absorption values at 575nm were converted into fructose concentrations using the equation above. Subsequently, the linear regression of the fructose concentration plotted against the time was determined for every substrate concentration. The slope of the linear regression gives us the velocity of the hydrolysis catalysed by the enzyme. (Figure 2)
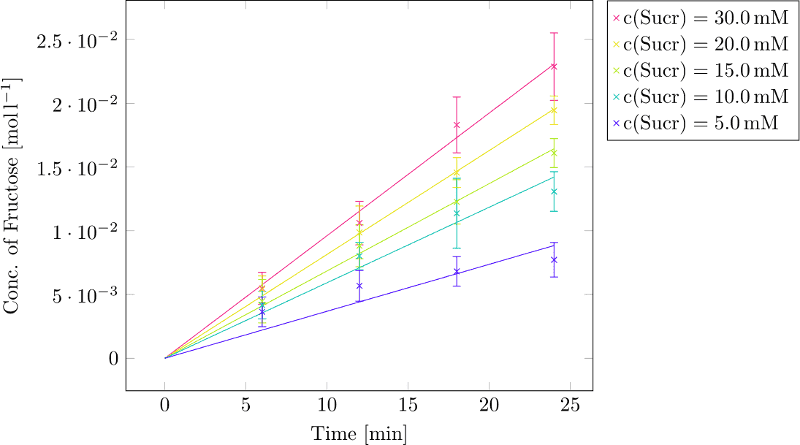
The resulting velocities are indicated here after:
C(Sucrose)=30mM: v₀=0.0009617 [M*min⁻¹]; R²=0.99802
C(Sucrose)=20mM: v₀=0.0008148 [M*min⁻¹]; R²=0.99958
C(Sucrose)=15mM: v₀=0.0006850 [M*min⁻¹]; R²=0.99878
C(Sucrose)=10mM: v₀=0.0005924 [M*min⁻¹]; R²=0.99212
C(Sucrose)= 5mM: v₀=0.0003685 [M*min⁻¹]; R²=0.96760
Now the reciprocal sucrose concentration was plotted against the velocity giving us a Lineweaver-Burk-plot. (Figure 3)
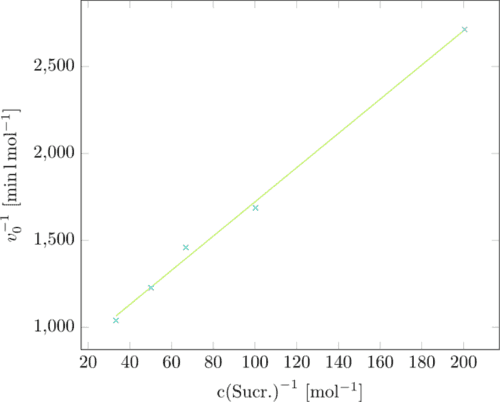
The Lineweaver-Burk-plot delivers the kinetic parameters we were looking for:
the y-intercept is the reverse maximal velocity vmax, the highest velocity the
enzyme can reach. The slope is KM/vmax whith KM being the Michaelis constant.
KM indicates the concentration in substrate where half of the maximal velocity
is reached. Our calculations resulted in the following values:
vmax=0.0013558 mol*min⁻¹
KM=13.351 mM
Protocols used
Miller assay
In case of the enzyme assay, the indicated sucrose concentrations were diluted in Mondelli buffer and 1µg Enzyme was added to the reaction and incubated for the incubated times at 37˚C. The reaction was performed in a volume of 40 µl. As a blank, the corresponding sucrose concentrations were measured in the Miller assay without addition of enzyme and once the reaction was performed adding 1µg of BSA which did not influence the reaction.
The Miller reagent consists of 1% 3,5-Dinitrosalicylic acid, 0.02% Phenole, 0.05 % Na2SO3, 1% NaOH. The NaSO3 was added immediately before the reaction to prevent oxidation of 3,5-Dinitrosalicylic acid. After incubation of enzyme and sucrose, 50µl of Miller reagent were added to the 40µl of reaction volume and the solution was heated at 95˚C for 15 min. Subsequently, the solution was cooled down to 20˚C for 1 min and the 3-amino-5-nitrosalicylic acid is stabilized by adding 17 µl of 40% potassium sodium tartrate tetrahydrate (also called Rochelle Salt). The absorbance at 575nm was then measured by an infinite M200 from NanoQuant.
References
- 1. G. L. Miller: “Use of Dinitrosalicylic Acid Reagent for Determination of Reducing Sugar”. Anal. Chem., 1959, 31(3): 426–428. ISSN: 15206882. DOI: 10.1021/ac60147a030.
- 2. M. H. P. B. Vettori, R. Mukerjea, and J. F. Robyt: “Comparative study of the efficacies of nine assay methods for the dextransucrase synthesis of dextran”. Carbohydr. Res., 2011, 346(9): 1077–1082. ISSN: 00086215. DOI: 10.1016/j.carres.2011.02.015.