Difference between revisions of "Team:Tianjin/Demonstrate"
Zsy5691750 (Talk | contribs) |
|||
| Line 437: | Line 437: | ||
<h5>2) Verification of RFP in the TVRVC</h5> | <h5>2) Verification of RFP in the TVRVC</h5> | ||
<hr> | <hr> | ||
| − | <p>The main | + | <p>The main characterization method of verification of <i>RFP</i> in the TVRVC applied by us is observing the expression of <i>red fluorescent protein</i> under the fluorescence microscope. By this way, it will be much more intuitive so that we can directly get the results. We took pictures under different visions and the results are as follows.All the experiment including PVRVC regulation system use this assay method.</p> |
<div id="threepic1"> | <div id="threepic1"> | ||
| Line 513: | Line 513: | ||
<p>There are 325 yellow colonies and 31 white colonies in the field of view.</p> | <p>There are 325 yellow colonies and 31 white colonies in the field of view.</p> | ||
<p>Apart from mating, we also transformed plasmid <i>pRS416</i> with <i>vika</i> gene into the PVRVC. The efficiency is up to 91.3 percent in this figure.</p> | <p>Apart from mating, we also transformed plasmid <i>pRS416</i> with <i>vika</i> gene into the PVRVC. The efficiency is up to 91.3 percent in this figure.</p> | ||
| − | <p>Compare above two methods, mating and transformation of plasmid, we find that mating is not as efficient as the transformation of the plasmid. After analysis, we came to the conclusions as follows. For the mating method, <i>vika recombinase</i> has stop expressing when <i>BY4742</i> mated with PVRVC in YPD medium. The previously expressed | + | <p>Compare above two methods, mating and transformation of plasmid, we find that mating is not as efficient as the transformation of the plasmid. After analysis, we came to the conclusions as follows. For the mating method, <i>vika recombinase</i> has stop expressing when <i>BY4742</i> mated with PVRVC in YPD medium. The previously expressed Vika recombinase may be degraded during the growth. In contrast to this, with another method that the plasmid was transformed into PVRVC directly, <i>vika recombinase</i> is continuously expressed during cell growth. So the efficiency of the second method is higher than the first method.</p> |
<div class="zxx_zoom_demo_qqqqq" align="center"> | <div class="zxx_zoom_demo_qqqqq" align="center"> | ||
| Line 542: | Line 542: | ||
<p>These are parts of a successful result of mating mentioned above. Two figures one by one correspondence.</p> | <p>These are parts of a successful result of mating mentioned above. Two figures one by one correspondence.</p> | ||
| − | <p>To sum up, mating switcher can be presented in kinds of yeast with different forms. This proves that our Mating switcher is fast, flexible and efficient.</p> | + | <p>To sum up, the mating switcher can be presented in kinds of yeast with different forms. This proves that our Mating switcher is fast, flexible and efficient.</p> |
<p>Meantime, we cultured the transformed yeast in several 5mL liquid <i>SC-Leu</i> at 30℃ and 220 rpm for 12 hours ( Take three samples at a time). We used one sample for centrifugation to precipitate the bacterial and the remaining two remained unchanged. The difference is the fluorescence value we need, then we calculated the value of average them. The excitation wavelength is set at 540nm and the emission wavelength is set at 635nm. Hereafters, we measured the yeast concentration at OD<sub>600</sub>. At last, we divided the fluorescence value by OD<sub>600</sub> to normalize the value and the result data is as follows. | <p>Meantime, we cultured the transformed yeast in several 5mL liquid <i>SC-Leu</i> at 30℃ and 220 rpm for 12 hours ( Take three samples at a time). We used one sample for centrifugation to precipitate the bacterial and the remaining two remained unchanged. The difference is the fluorescence value we need, then we calculated the value of average them. The excitation wavelength is set at 540nm and the emission wavelength is set at 635nm. Hereafters, we measured the yeast concentration at OD<sub>600</sub>. At last, we divided the fluorescence value by OD<sub>600</sub> to normalize the value and the result data is as follows. | ||
</p> | </p> | ||
| Line 564: | Line 564: | ||
<p>Our mating switch plays an important role in many respects, such as including heavy metal treatment and cell signal switching. And we created a novel method to prove the effectiveness of the switch in an intuitive and effective way. The terminator of the first part (PVUVC) terminates the expression of the downstream gene, proving the validity of the switcher, and the second part (PVRVC) creates an evident method of color conversion to determine the state of the switcher.</p> | <p>Our mating switch plays an important role in many respects, such as including heavy metal treatment and cell signal switching. And we created a novel method to prove the effectiveness of the switch in an intuitive and effective way. The terminator of the first part (PVUVC) terminates the expression of the downstream gene, proving the validity of the switcher, and the second part (PVRVC) creates an evident method of color conversion to determine the state of the switcher.</p> | ||
| − | <p>Aiming to increase the | + | <p>Aiming to increase the Vika-vox system efficiency, we let Vika enzyme saturate expression, but the efficiency was still relatively low. We hypothesized that this phenomenon was caused by degradation of the Vika enzyme in the YPD culture medium. We’d better change the composition or proportion of YPD ingredients to find out the best culture conditions. We are looking forward to more research in this field so that we can make this system work better and even perfectly.</p> |
<p>We use the <i>RFP</i> as the reporting protein. But there exists a drawback that it’s detected with an expensive device. A more intuitive reporting strategy need to be developed, maybe it can be seen by bare eyes like <i>E.coli</i> in the near future.</p> | <p>We use the <i>RFP</i> as the reporting protein. But there exists a drawback that it’s detected with an expensive device. A more intuitive reporting strategy need to be developed, maybe it can be seen by bare eyes like <i>E.coli</i> in the near future.</p> | ||
| Line 822: | Line 822: | ||
<hr> | <hr> | ||
| − | <p>The Cu-induced promoter <i>CUP1</i> promoter is a previous BioBrick used by iGEM16_Washington, iGEM16_Waterloo, and other iGEM teams. However, the detailed characterization like what we did this year hasn't been shown on iGEM parts page. Moreover, this part hasn’t be improved by any means or in any | + | <p>The Cu-induced promoter <i>CUP1</i> promoter is a previous BioBrick used by iGEM16_Washington, iGEM16_Waterloo, and other iGEM teams. However, the detailed characterization like what we did this year hasn't been shown on iGEM parts page. Moreover, this part hasn’t be improved by any means or in any way. Under this situation, we plan to work on this promoter to improve its sensitivity and response peak, reduce the leakage expression, and create new parts for future work.</p> |
| Line 857: | Line 857: | ||
</div> | </div> | ||
| − | <p>Based on this mechanism, we redesigned the part sequence provided by iGEM16_Washington. We deleted irrelevant | + | <p>Based on this mechanism, we redesigned the part sequence provided by iGEM16_Washington. We deleted irrelevant based on the two ends of this promoter and retained the core sequence. In this way, this promoter played its key role with fewer bases. Strains of <i>S. cerevisiae BY4742</i> containing either BBa_K2165004-yEmRFP and BBa_K2407000-yEmRFP with an initial OD<sub>600</sub> of 0.1 were grown for 24 hours in SC-URA medium at 30 degrees Celsius, and then were induced with 0.1 mM Cu<sup>2+</sup>. Samples were tested with fluorescent spectrophotometer (Hitachi F-2700) after 1, 3, 6, 12, and 24 hours.</p> |
<div class="row"> | <div class="row"> | ||
| Line 989: | Line 989: | ||
<p>The figure shows the response ranges of biosensors with different promoters within 20 min. For most biosensors, the fluorescence intensity increases as copper ion’s concentration increases from 0 to 100 μM. However, when the concentration exceeds 100 μM, the responses of most biosensor become slow, and the fluorescence intensity decreases. A reasonable explanation is that high concentrations of copper can inhibit the biosensor's response within a short time. </p> | <p>The figure shows the response ranges of biosensors with different promoters within 20 min. For most biosensors, the fluorescence intensity increases as copper ion’s concentration increases from 0 to 100 μM. However, when the concentration exceeds 100 μM, the responses of most biosensor become slow, and the fluorescence intensity decreases. A reasonable explanation is that high concentrations of copper can inhibit the biosensor's response within a short time. </p> | ||
| − | <p>Fortunately, we still found a biosensor who met the requirements of an excellent biosensor. EP-5 has a less leakage and a higher sensitivity. Its fluorescence intensity is lower than the control group by 17 units with no induction and is higher by 21 units with 100-μM-Cu induction. By aligning the sequence with the CUP1 promoter, we found altered bases mainly located at | + | <p>Fortunately, we still found a biosensor who met the requirements of an excellent biosensor. EP-5 has a less leakage and a higher sensitivity. Its fluorescence intensity is lower than the control group by 17 units with no induction and is higher by 21 units with 100-μM-Cu induction. By aligning the sequence with the CUP1 promoter, we found altered bases mainly located at both sides of UASs and a deletion of one base even occurred between two UASs. We suspected that the change of sensitivity and leakage expression mainly due to the change of spatial distribution and the increase of A/T concentration, which both could influence the binding procedure of transcription factors.</p> |
<div class="row"> | <div class="row"> | ||
| Line 1,023: | Line 1,023: | ||
<hr> | <hr> | ||
| − | <p>In our characterization of both primary and improved promoters, we found the effect of induction is not as obvious as expected (Previous iGEM team’s results). After reading some references, we found the activation process is related to the acetylation of H3 and H4 located at <i>CUP1</i> promoter, which showed nucleosome reposition and transcription factors binding might be the main reason for the activation. However, our biosensors were ligated on plasmid pRS416, which usually exists in the nucleus in a supercoiled state. There is only little possibility for a plasmid to binds to histones, so the transcription process shows less activation than that on a chromosome.</p> | + | <p>In our characterization of both primary and improved promoters, we found the effect of induction is not as obvious as expected (Previous iGEM team’s results). After reading some references, we found the activation process is related to the acetylation of H3 and H4 located at the <i>CUP1</i> promoter, which showed nucleosome reposition and transcription factors binding might be the main reason for the activation. However, our biosensors were ligated on plasmid pRS416, which usually exists in the nucleus in a supercoiled state. There is only little possibility for a plasmid to binds to histones, so the transcription process shows less activation than that on a chromosome.</p> |
<p>In the future, we plan to construct this biosensor on chromosomes to see whether the result will be more positive. Meanwhile, we will continue enlarging the response peak and range to improve this biosensor.</p> | <p>In the future, we plan to construct this biosensor on chromosomes to see whether the result will be more positive. Meanwhile, we will continue enlarging the response peak and range to improve this biosensor.</p> | ||
| Line 1,084: | Line 1,084: | ||
<p>In terms of the respective ability to adsorb copper and cadmium, we compare genetically-engineered yeast, SCRaMbLE yeast and original one. | <p>In terms of the respective ability to adsorb copper and cadmium, we compare genetically-engineered yeast, SCRaMbLE yeast and original one. | ||
| − | <p>As is illustrated in Fig.5-1 and Fig.5-2, engineered yeast significantly absorbs more ion than control group without any improvement. Furthermore, SCRaMbLE yeast also shows excellent adsorption capacity, comparable to genetically-engineered one. Fig.X1 reveals the | + | <p>As is illustrated in Fig.5-1 and Fig.5-2, engineered yeast significantly absorbs more ion than the control group without any improvement. Furthermore, SCRaMbLE yeast also shows excellent adsorption capacity, comparable to genetically-engineered one. Fig.X1 reveals the adsorption of copper ion, which relatively faster than cadmium, showed in Fig.X2.</p> |
<div class="zxx_zoom_demo_qqqqqqq"> | <div class="zxx_zoom_demo_qqqqqqq"> | ||
<div class="small_pic_demo_qqqqqqq" style="float:left;"> | <div class="small_pic_demo_qqqqqqq" style="float:left;"> | ||
Revision as of 11:50, 31 October 2017
/* OVERRIDE IGEM SETTINGS */
Demonstrate
Mating-type Switch and Mating Switcher
Obtaining the chassis
Aiming to achieve MTS for environmental use, it is essential to make sure that when the MAT locus has DSB (double strands break) cleaved by HO, our type-a (MATa) yeast can only become type-α (MATα). Therefore, we used a Ura-tag to replace the HMRa domain in chromosome Ⅲ. In this way the HMRa will no longer be the donor for the homologous recombination in the repairing process for MAT cleavage. Since the change of mating type may appear successively, there is a great possibility that the same type haploid mate with each other. After selection, by homologous recombination, we deleted the Ura-tag for further usage. We selected the target colonies (SynⅩ-dUra) via 5-FOA plates.

Fig. 1-1. The PCR strategy for testing whether we deleted the HMRa in SynⅩ-dUra.

Fig. 1-2. As we can see in the gel photo above, the UP and DOWN segments hasn’t been amplified in our SynⅩ-dUra comparing to the BY4741 as control. Which indicated that the HMRa gene has been successfully eliminated.
The result for constructing the Gal systems
In this pathway, we chose Gal1 as our inducible promoter for the expression of HO gene, CYC1 as the terminator, and PRS416(with Ura-tag) as our vector. As for segments ligation, we designed the cutting sites for Bsa1 enzyme in each part, hoping to achieve seamless ligation of these three parts.
We adopted the PCR method to amplify the Gal1-part (BBa_K2407001) and CYC1-part (BBa_K2407107) from a Gal1-Vika plasmid we had used in our former lab work with specially designed primers for this procedure. After PCR, the Gal1 has the cutting sites for SalⅠand BsaⅠon both ends, and CYC1 has that for BsaⅠand BamhⅠon both ends. Meanwhile, the HO (BBa_K2407109) gene was obtained by gene synthesis, flanked by specific hangtags for BsaⅠin order to be cohesive with Gal1 (upstream) and CYC1 (downstream). Thus, we have built our composite part (GHC).
After the ligation ofGHC (BBa_K2407100) and PRS416 Plasmid (GHC-416), we transformed the E. coli for the augment of our new plasmid——GHC-416. We examined the transformation result by PCR method to amplify the HO gene in the E. coli which we randomly selected in the plate.

Fig. 1-3. The results of PCR of #6, #7, #16, #20, #27, #36, #37, #55 colonies. HO gene (length of 1770bp). As we can see, HO gene in all 8 colonies has been amplified, which indicated that we succeeded in constructing the device for HO gene expression.
The result of mating type switching(MTS)
We transformed the chassis yeasts for the new device——GHC-416, the new yeasts we selected in the Sc-Ura plate is named as SynⅩ-dUra-416.
In this section, we only got to test the Gal System due to time limit. And we figured that the result for Gal System is adequately enough to represent the feasibility of our designed strategy for MTS.
The whole test process can be divided into three steps.
1) Step one
Activate the Gal1 promoter. After that, the expression of HO gene in the SynⅩ-dUra-416 can be initiated.
2) Step two
Cultivate two groups of yeasts together. (one is SynⅩ-dUra-416, the other is normal BY4741 MATa) If the MTS has been accomplished (SynⅩ-dUra-416 can become MATα), the two groups of haploids can mate with each other and become diploids.
3) Step three
Test the results of mating by PCR method. We designed the primers for both MATa locus and MATα locus. The amplification of both MATa locus and MATα locus indicates that the yeasts has turned into diploids, the MTS has been achieved in other words.
According to our design, after activating the Gal1 promoter, the expression of HO gene in the SynⅩ-dUra-416 can be initiated.
Then we cultivated two groups of yeasts together. (one is SynⅩ-dUra-416, the other is normal BY4741 MATa) If the MTS has been accomplished (SynⅩ-dUra-416 can become MATα), the two groups of haploids can mate with each other and become diploids.
To test whether MTS has happened, we selected some colonies in the selective plates (Sc-Ura ) and adopted PCR method. With designed primers for both MATa locus and MATα locus, the amplification of both MATa locus and MATα locus can indicate that the yeasts has mated with each other, and turned into diploids, in other words, the MTS has been achieved.

Fig. 1-4. (a) showed the PCR results for MATa locus. The MATa gene was amplified in all colonies except the first 24 colonies.

Fig. 1-4. (b) showed the PCR results for MATα locus. The MATα gene was amplified in all 96 colonies.
Discussion & Expectation
To our delight, we verified that our strategy, namely Gal System, is able to trigger the Mating Type Switching in yeasts when induced by galactose. Thereby, we succeeded in building a new kind of on-off device in our target yeast—— SynⅩ-dUra-416, where the whole system is ready to perform as a mating switcher to turn on/off other functional genes for further usage in our project——Romantic Switcher.
References
[1] Sara J. Hanson, and Kenneth H. Wolfe. An Evolutionary Perspective on Yeast Mating-Type Switching.
[2] James E. Haber, Mating-Type Genes and MAT Switching in Saccharomyces cerevisiae.
Characterization of Mating Switcher
OVERVIEW
After realizing that we need more intuitive characterization of Mating Switcher, we thought of two kinds of gene expression products in different colors, red fluorescent protein and β-carotene. We carried out a reasonable experimental design, and decided to realize functional conversion from red fluorescent protein to β-carotene by Mating Switcher.
At first, we built expression vector with TEF promoter, which was a strong promoter in Saccharomyces cerevisiae. Although we obtained results as we expected, it is not so perfect that we decided to change a stronger promoter. Then, we constructed another expression vector with TDH3 promoter. We redid the same qualitative and quantitative experiments to characterize our results.
CONSTRUCTION
In the early stage of the project, we constructed two composite parts with TEF promoter: BBa_K2407306 (called PVUVC), BBa_K2407307 (called PVRVC). At the end of our project, we also constructed one composite part with TDH3 promoter called TVRVC. Among them, yEmRFP is modified from a mCherry mRFP to adapt to the transcription environment in yeast. We did overlap PCR to combine them together. After that, we sequenced these parts, and sequencing result showed that this construction was successful.

Fig 2-1. Red fluorescent protein expression vector construction flow chart.

Then we first inserted BBa_K2407306 to the Synthetic chromosome Ⅴ of Saccharomyces cerevisiae . Through the screening of SC-Ura solid medium and PCR experiments, we obtained the required strains called PVUVC. Second, we integrated the second composite part into this chromosome through homologous recombination, allowing the RFP gene to replace the Ura3 gene. The 5-FOA solid medium and PCR experiments were used to screen correct colony PVRVC. The conversion of the last fragment refers to the previous method. This process is graphically displayed on the above figure.
To achieve mating, another mating type of wild type haploid yeast Saccharomyces cerevisiae BY4742 was used for modification. By digestion and ligation, we construct vika gene on plasmid pRS416 which contains a selective marker Ura3, and plasmid pRS413 which contains a selective marker His. Then we introduced those two different plasmids into BY4742 respectively.
Results of Characterization of Mating Switcher
1) Proof of Existence of Composite Parts
We built three composite parts in total. They are integrated into the chromosomes of Saccharomyces cerevisiae by transformation. We use colony PCR to proof the existence of these three parts in our strain. The result is showed as below.


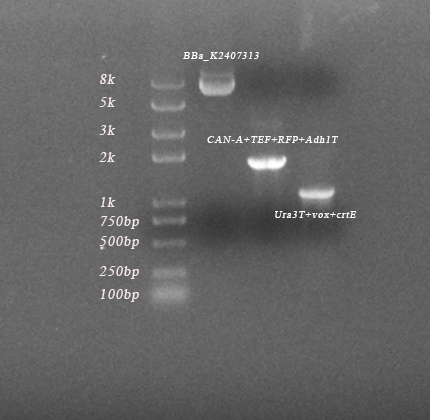
Fig 2-2. Microscope image of yeast cultured with SC-Leu with no yEmRFP gene transformed.
The PCR’s results confirmed that the target genes were ligated into chromosome correctly.
2) Verification of RFP in the TVRVC
The main characterization method of verification of RFP in the TVRVC applied by us is observing the expression of red fluorescent protein under the fluorescence microscope. By this way, it will be much more intuitive so that we can directly get the results. We took pictures under different visions and the results are as follows.All the experiment including PVRVC regulation system use this assay method.


Fig 2-3. Microscope image of yeast cultured with SC-Leu with yEmRFP gene transformed.


Fig 2-3. Microscope image of yeast cultured with SC-Leu with yEmRFP gene transformed.
From these images we can clearly see the expression of yEmRFP. These images undoubtedly verify the yEmRFP gene has been transformed succeessfully.
3) Result of Mating
After we got the strain that introduced the red fluorescent protein gene, we let it mate with another mating type haploid yeast, which had plasmid with vika gene. The result is showed as follows:

Fig 2-4. Three modified colonies and one resulting colony.

The upper left corner of the bacteria is synthetic Saccharomyces cerevisiae, we integrated modified fragment into its synthetic chromosome V. (PVUVC) The upper right corner is also synthetic Saccharomyces cerevisiae. (PVRVC) It is imported red fluorescent protein gene based on the upper left corner of the yeast. Both of them are single-celled organism called a. The lower right corner of the yeast is another mating type of haploid yeast called α. It has plasmid pRS416 with vika gene. The yeast in the lower left corner are diploid Saccharomyces cerevisiae, which is obtained by mating the two yeasts on the right side of the figure.
The yellow colony in the figure is mating successfully. After the induction of galactose, vika recombinase was expressed, and red fluorescent protein gene and terminator was deleted so that β-carotene expresses. The color of colony was changed from white to yellow. In addition to it, we also tried other methods to turn on the switch.

Fig 2-5. Bacteria after mating cultivated on the Sc-His plate.

There are 377 yellow colonies and 365 white colonies in the field of view.
We used another α-type yeast named BY4742, which has a plasmid called pRS413 with selective marker His. It could express vika recombinase before mating. It mated with a-type Saccharomyces cerevisiae PVRVC, and then yeast cultured on Sc-His plate. As can be seen from the figure above, the reorganization efficiency is high, which reaches 50.8 percent. This proves that our Mating switcher is fast and efficient.

Fig 2-6. Bacteria after mating cultivated on the Sc-Ura plate.

There are 325 yellow colonies and 31 white colonies in the field of view.
Apart from mating, we also transformed plasmid pRS416 with vika gene into the PVRVC. The efficiency is up to 91.3 percent in this figure.
Compare above two methods, mating and transformation of plasmid, we find that mating is not as efficient as the transformation of the plasmid. After analysis, we came to the conclusions as follows. For the mating method, vika recombinase has stop expressing when BY4742 mated with PVRVC in YPD medium. The previously expressed Vika recombinase may be degraded during the growth. In contrast to this, with another method that the plasmid was transformed into PVRVC directly, vika recombinase is continuously expressed during cell growth. So the efficiency of the second method is higher than the first method.

Fig 2-7. Four modified coloniesinserted with promotor-vox-RFP-terminators-vox-crt structure

We also used other a type Saccharomyces cerevisiae to achieve mating switcher. After changing TEF promotor to TDH3 promotor, we repeated the test according to the above two methods. The four strains are all a-type haploid synthetic Saccharomyces cerevisiae named TVRVC NO.2 (upper left), NO.4 (upper right), NO.11 (lower left) and NO.19 (lower right) respectively. The color appears to be white because β-carotene is not expressed.

Fig 2-8. Mating successfullycolonies

These are parts of a successful result of mating mentioned above. Two figures one by one correspondence.
To sum up, the mating switcher can be presented in kinds of yeast with different forms. This proves that our Mating switcher is fast, flexible and efficient.
Meantime, we cultured the transformed yeast in several 5mL liquid SC-Leu at 30℃ and 220 rpm for 12 hours ( Take three samples at a time). We used one sample for centrifugation to precipitate the bacterial and the remaining two remained unchanged. The difference is the fluorescence value we need, then we calculated the value of average them. The excitation wavelength is set at 540nm and the emission wavelength is set at 635nm. Hereafters, we measured the yeast concentration at OD600. At last, we divided the fluorescence value by OD600 to normalize the value and the result data is as follows.

Fig 2-9. Normalized fluorescence value was calculated by dividing fluorescent value by cell concentration(OD600)

From the data we can find that the successful transformation of the yeasts' fluorescence intensity is more than twice that of the wild type, there was low red fluorescence was detected after mating, which was considered the influence of β-carotene.
DISCUSSION & FUTURE WORK
Our mating switch plays an important role in many respects, such as including heavy metal treatment and cell signal switching. And we created a novel method to prove the effectiveness of the switch in an intuitive and effective way. The terminator of the first part (PVUVC) terminates the expression of the downstream gene, proving the validity of the switcher, and the second part (PVRVC) creates an evident method of color conversion to determine the state of the switcher.
Aiming to increase the Vika-vox system efficiency, we let Vika enzyme saturate expression, but the efficiency was still relatively low. We hypothesized that this phenomenon was caused by degradation of the Vika enzyme in the YPD culture medium. We’d better change the composition or proportion of YPD ingredients to find out the best culture conditions. We are looking forward to more research in this field so that we can make this system work better and even perfectly.
We use the RFP as the reporting protein. But there exists a drawback that it’s detected with an expensive device. A more intuitive reporting strategy need to be developed, maybe it can be seen by bare eyes like E.coli in the near future.
Reference
[1]Altamura E, Borgatti M, Finotti A, Gasparello J, Gambari R, Spinelli M, et al. (2016) Chemical-Induced Read-Through at Premature Termination Codons Determined by a Rapid Dual-Fluorescence System Based on S. cerevisiae. PLoS ONE11(4): e0154260. https://doi.org/10.1371/journal.pone.0154260
[2]Leslie A. Mitchell, James Chuang, Neta Agmon, Chachrit Khunsriraksakul, Nick A. Phillips, Yizhi Cai, David M. Truong, Ashan Veerakumar, Yuxuan Wang, María Mayorga, Paul Blomquist, Praneeth Sadda, Joshua Trueheart, Jef D. Boeke; Versatile genetic assembly system (VEGAS) to assemble pathways for expression in S. cerevisiae, Nucleic Acids Research, Volume 43, Issue 13, 27 July 2015, Pages 6620–6630.https://doi.org/10.1093/nar/gkv466
SCRaMbLE: Improve Resistance to Heavy Metal Ions
OVERVIEW
After doing relevant literature reading, we found that yeast’s tolerance level of ambient copper and cadmium ions has a threshold concentration, approximately 3mM and 0.5mM in SC culture media respectively.
In order to increase yeast strains’ inherent tolerance of copper or/and cadmium ions in their growing environment, we used this cutting-edge biological technology—SCRaMbLE, which stands for Synthetic Chromosome Rearrangement and Modification by Loxpsym-mediated Evolution, to obtain yeast strain with better tolerance to heavy metal ions .[1].
We constructed three yeast strains namely 079, 160, and 085. They all have a plasmid containing the CRE-EBD sequence and different nutritional labels[2]. 079 and 160 strains have a URA3 label, 085 strain has a HIS label. After proper induction and screening, we successfully obtained mutated 079, 085 and 160 strains that have a manifest growing advantage over control groups when cultured in SC solid media which contain 0.14 mM cadmium ions or 4.8 mM copper ions. We named those mutated strains with increased tolerance capacity of cadmium ions S1, S2, S3, and S4, and as for copper, S5, S6, S7, and S8.
In order to characterize their increased tolerance of copper or/and cadmium ions, we designed and conducted two different sets of experiments, in both visible and quantitative manner, to test their ability to cope with adverse environmental conditions.
CONSTRUCTION
This vector consists of three parts, an estrogen-inducible PCLB2 promoter (BBa_K2407002), the Cre-EBD sequence (BBa_K2407005) and a CYC1 terminator(BBa_K2407003). We used overlap PCR to ligate these three parts and then the plasmids with URA3 and HIS nutritional label respectively through enzymatic digestion and ligation. Then this composite part (BBa_K2407011),was sequenced and proved to be accurate by using the promoter's forward primer and the terminator's reverse primer. The electrophoresis results below also showcased that the sequence length (about 2800bp) was correct.

Fig.3-1 This is a simplified version of this vector expressing the Cre recombinase enzyme. Cre-EBD is the coding sequence of Cre recombinase; PCLB2 is a constitutive promoter in yeast; CYC1 is a terminator.
CHARACTERIZATION
Dilution Assay
We conducted dilution assay on SC solid media containing 0.14 mM cadmium ions. Experimental groups are S1, S2, S3, and S4; control groups are synX (the yeast strain containing a synthetic chromosome X), BY4741 (wild-type haploid yeast), and BY4743 (wild-type diploid yeast). Results are shown in the picture below.

Fig.3-2 Experimental groups: S1, S2, S3, and S4; control groups: synX, BY474, and BY4743. Yeast cells were picked up from single colonies on solid growth media and diluted by 10, 100, 1000, 10000, and 100000 times.
Apparently, the experimental groups have a survival advantage over control groups. In this picture, S1 is able to develop a large single colony even after it is diluted to 100000 times on SC solid media containing 0.14 mM cadmium ions; S3 and S4 are able to grow when diluted to 100000 times but the colonies are much smaller than that of S1. Although S2 is not as good as the other three, it still shows higher resistance to cadmium ions than the control groups do. Wild-type yeast strains BY4741 and BY4743 can barely grow on this growth media, while synX cannot grow, which means that synX is unable to survive such high concentration of cadmium ions. The results clearly demonstrate that these mutated yeast strains have an improved phenotype-increased resistance to cadmium ions.
Another assay was conducted on SC solid media containing 4.8 mM copper ions. Results are shown in the picture below.

Fig.3-3 Experimental groups: S5, S6, S7, and S8; control groups: synX, BY4741, and BY4743. Yeast cells were picked up from single colonies on solid growth media and diluted by 10, 100, 1000, 10000, and 100000 times.
The experimental groups also have a survival advantage over control groups. From this picture, S5, S6, and S8 are able to develop a large single colony after diluted to 100000 times on SC solid media containing 4.8 mM copper ions. S7 is not as tough as the other three experimental groups, but it still shows higher resistance to copper ions compared with BY4741 when diluted to 100 times. BY4743 can hardly grow on this media, while synX cannot grow, which means that synX is unable to tolerate such high concentration of copper ions. The results clearly showcase that the mutated yeast strains have an improved phenotype-increased resistance to copper ions.
Survival Rate Experiments
This experiment aims to quantify mutated yeast strains’ ability to survive in copper or cadmium ions solution. Same amount of yeast cells are added to the copper or cadmium ions solution at the beginning; after that, a certain amount of this solution is taken out at regular intervals, namely 10min, 30min, 1h, and 2h, then diluted and plated on YPD solid media. After yeast colonies emerge from the growth media, the number of the colonies are counted and recorded to calculate the survival rate of this strain in this solution.
We choose the seemingly best strain, S1, as the experimental strain to test its ability to survive high concentration of cadmium compared with the control strain, synX. Results are shown in the pictures and tables below.

Fig.3-4 The left: Colony numbers of synX and S1. Experiments were repeated for three times. Cadmium concentration: 5mM for the first and the third experiments; 10 mM for the second experiment.
The right: Survival rates of synX and S1 in cadmium ion solution. In order to eliminate the error brought by the different amount of cells picked up from the media, the survival rate equals the value of the number of the colonies developed on growth media after immersed in cadmium solution for a certain amount of time divided by that of the colonies developed on growth media after immersed in cadmium solution for 10 minutes. Mean values are shown in the graph. The error line stands for the standard deviation.

Fig.3-5 Picture of the third survival rate experiment results. Growth media: YPD. Experimental strain: S1; control strain: synX. Cells were plated onto the media after immersed in 5 mM cadmium solution for 10 minutes, 30minutes, 1 hour, and 2hours.
The Fig.3-4 and Fig.3-5 showcase that the survival rate of S1 is higher than that of synX after yeast cells are immersed in cadmium ions solutions of identical concentration for the same amount of time. We painstakingly counted and recorded the number of the colonies on each individual growth media. The quantitative results are that compared with the control strain, the experimental strain S1's ability to tolerate cadmium ions has increased by 23.8% (30 minutes), 231.9% (1 hour), and 192.4% (2 hours). The longer the time of immersion is, the more obvious the difference of survival rates is. The results are consistent with the dilution assay, which is that the mutated strain has a better resistance level of cadmium ions .
As for copper, the seemingly best strain, S5, is chosen as the experimental strain to test its ability to survive high concentration of copper ions compared with synX. Results are shown in the pictures and tables below.

Fig.3-6 The left: Colony numbers of synX and S5. Due to the time limit, we conducted this experiment for only one time. Yeast cells were immersed in 50mM copper solutions for 10 minutes, 30 minuets, 1 hour, and 2 hours.
The right: Survival rates of synX and S5 in copper solution. In order to eliminate the error brought by the different amount of cells picked up from the media, the survival rate equals the value of the number of the colonies developed on growth media after immersed in copper solution for a certain amount of time divided by that of the colonies developed on growth media after immersed in copper solution for 10 minutes. Mean values are shown in the graph. The error line stands for the standard deviation.

Fig.3-7 Picture of survival rate experiment results. Growth media: YPD. Experimental strain: S5; control strain: synX. Cells were plated onto the media after immersed in 50 mM copper solution for 10 minutes, 30minutes, 1 hour, and 2hours.
The Fig.3-6 and Fig.3-7 showcase that the survival rate of S5 is higher than that of synX after yeast cells are immersed in copper ions solutions of identical concentration for the same amount of time. The quantitative results are that compared with the control strain, the experimental strain S5's ability to tolerate copper ions has increased by 74% (1 hour), 72% (2 hours), and 698% (3 hours). It also can be extrapolated that the gap of survival rates between the mutated strain and synX strain will continue to widen as the immersion time increases. The results are consistent with the dilution assay too.
EXPECTATIONS
We are exhilarated to see that SCRaMbLE is really a feasible technology to enhance the yeast's ability to cope with adverse environmental conditions. Not just heavy metal ions, we are looking forward to seeing its future applications, be they, for example, alcohol tolerance or heat tolerance.
REFERENCES
[1]Shen, Y., Stracquadanio, G., Wang, Y., Yang, K., Mitchell, L. A., & Xue, Y., et al. (2016). Scramble generates designed combinatorial stochastic diversity in synthetic chromosomes. Genome Research, 26(1), 36.
[2]Lindstrom, D. L., & Gottschling, D. E. (2009). The mother enrichment program: a genetic system for facile replicative life span analysis in Saccharomyces cerevisiae.Genetics , 183(2):413.
Biosensor for Cu Ion's Detection
OVERVIEW
After communicating with professors, teachers, and factory superintendents, our HPers found that it was difficult to monitor the concentration of the copper ions in solution in real-time. Using a biosensor seems to be a good solution to this problem.
This idea was inspired by the naturally-occurring metal-ion-induced promoters. Ligating this kind of promoters with a reporter gene such as RFP is a common idea to visibly monitor the concentration of metal ions. Take copper as an example: after browsing through parts, we found copper-ion-induced promoters in both E.coli and S.cerevisiae. Actually, the ability of E.coli and S.cerevisiae to tolerate copper ions differs from each other. E.coli's maximum tolerance level to copper ions is 1 mM, which is much less than that of S.cerevisiae's (over 15mM in YPD medium and 6.25 mM in SC medium). Considering the response range, the budding yeast is a much better host for copper detection.
We built a biosensor based on the CUP1 promoter and yEmRFP to monitor the concentration of copper ions. The response range of this biosensor was characterized by a fluorescent spectrophotometer (Hitachi F-2700). To improve the sensitivity of the biosensor and enlarge the response intensity when it is induced, we used error-prone PCR to obtain lots of promoter mutants and then characterized them.
CONSTRUCTION
The biosensor consists of two main parts. One is the Cu-induced promoter CUP1p, the other is yEmRFP, which is modified from a mCherry mRFP to adapt to the transcription environment in yeast. The promoter was synthesized without RFC sites (XbaI) and the RFP was amplified by PCR. We used overlap PCR to combine the two parts and added two restriction sites on the ends. By digestion and ligation, we constructed this biosensor on the plasmid pRS416 which contains a selective marker URA3. After that, we sequenced this part with M13F and M13R as primers. The sequencing result showed that this construction was successful, so we can take the next step – characterization.

Fig. 4-1. Sequencing result of CUP1p and yEmRFP (alignment support by SnapGene®)

CHARACTERIZATION
Based on the CUP1 promoter (BBa_K2165004) provided by iGEM16_Washington, we constructed this biosensor. To characterize this biosensor, strains of S. cerevisiae BY4742 containing the plasmid with an initial OD600 of 0.1 were grown for 24 hours in SC-URA medium at 30 degrees Celsius, and then were induced with copper sulfate. Samples in different copper concentration were tested with the fluorescent spectrophotometer (Hitachi F-2700) after 1, 6, 12, and 24 hours. This protocol was based on the experience used by Waterloo and Washington iGEM teams and amended by our team.

Fig. 4-2. The fluorescence intensity of CUP1p-yEmRFP biosensor with different Cu concentration induced

Figure 4-2 showed the relationship between fluorescence intensity with induction time and Cu concentration. With 0.1 mM CuSO4 induced, the fluorescence intensity is 2 times over a control with no induction at 1 hour. As time went on, the fluorescence intensity slightly reduced. Moreover, as the Cu concentration increased, the fluorescence intensity decreased, and when the concentration reached 1 mM, the intensity was close to the control group. This might be due to the higher copper ion concentration influences the transcription, expression and even growth of yeast.
This result will be useful for teams who will use the parts (BBa_K2165004) & (BBa_K2407012) to build an effective Cu-induced biosensor in budding yeast. We noticed that this result is a little different with works done by Waterloo team. It may be due to the differences between Cu ion’s concentration and yeast species. However, we both verified the possibility of building a biosensor based on CUP1 promoter in yeast.
This result was provided for modeling of this biosensor and try to find a proper function to accurately describe the response procedure. Click here to see more information.
PARTS IMPROVEMENT
The Cu-induced promoter CUP1 promoter is a previous BioBrick used by iGEM16_Washington, iGEM16_Waterloo, and other iGEM teams. However, the detailed characterization like what we did this year hasn't been shown on iGEM parts page. Moreover, this part hasn’t be improved by any means or in any way. Under this situation, we plan to work on this promoter to improve its sensitivity and response peak, reduce the leakage expression, and create new parts for future work.
1) Redesign of CUP1 promoter
First, based on the part (BBa_K2165004) provided by iGEM16_Washington, we tried to ensure the core sequence for transcription. Researches about this promoter mainly published in the 1990s, and the mechanism of induction has been researched thoroughly. There exist 5 ACE1 binding sites (UAS), 2 TATA boxes, and one initiation element in the promoter. The complex of ACE1 and copper ions will bind the promoter, which causes the activation of CUP1 promoter with TATA boxes’ help. ACE1 complex’s binding directly increases the possibility for TBP (TATA-Box Binding Protein) to bind the promoter, which can enhance the expression.

Fig. 4-3. structure of redesigned CUP1 promoter used in our project, based on BBa_K2165004

Based on this mechanism, we redesigned the part sequence provided by iGEM16_Washington. We deleted irrelevant based on the two ends of this promoter and retained the core sequence. In this way, this promoter played its key role with fewer bases. Strains of S. cerevisiae BY4742 containing either BBa_K2165004-yEmRFP and BBa_K2407000-yEmRFP with an initial OD600 of 0.1 were grown for 24 hours in SC-URA medium at 30 degrees Celsius, and then were induced with 0.1 mM Cu2+. Samples were tested with fluorescent spectrophotometer (Hitachi F-2700) after 1, 3, 6, 12, and 24 hours.

Fig. 4-4. structure of redesigned CUP1 promoter used in our project, based on BBa_K2165004
Figure 4-4 shows the expression of yEmRFP with both the two promoters were very similar, so we can tell the deletion didn’t influence the core function of CUP1 promoter. Based on the new part, we carried out a further improvement.
2) Error-Prone PCR
In our experiment, we noticed that CUP1 promoter still has a certain degree of leakage expression. To make a better biosensor, we planned to reduce the leakage expression and increase the sensitivity. To reach this goal, we took the fluorescence intensity at both inductions or not into evaluation indexes.
The technology of error-prone PCR was taken into our experiment. Although there are many methods to introduce genetic diversity into a parent sequence, error-prone PCR is the most common way of creating a combinatorial library based on a single sequence. By adding some heavy metal ions into the PCR buffer and preparing dNTPs with different composition, new mutants were introduced into the CUP1 promoter. The whole procedure is shown in the following figure.

Fig. 4-5. The procedure for error-prone PCR experiment

The library of promoter mutants obtained from error-prone PCR were ligated into plasmid pRS416 with two restriction sites (BamHI and XbaI). After that, we enriched different plasmids from E.coli and established the plasmid library with 132 samples. Then, different plasmids were transferred into S.cerevisiae BY4742 to test the fluorescence intensity under different conditions.
First, we tested and selected mutants with less leakage. Compared with control group, we test the fluorescence intensity with no induction and selected two mutants with lower fluorescence intensity. Actually, we test a lot of mutants, but most of them were not positive result. We picked EP-3, EP-5, EP-9, and EP-28 whose fluorescence intensity was less or close to the control group, and sequenced them. The sequencing results can be found in the parts' information: BBa_K2407013 (EP-3), BBa_K2407014 (EP-5), BBa_K2407015 (EP-9), BBa_K2407016 (EP-28).

Fig. 4-6. The leakage expression of different promoters

Second, we worked on the sensitivity of the biosensor. Leakage expression was not the only thing needed to be solved, and we also needed to increase the response range when it was induced. A good biosensor needs less leakage and more sensitivity.
We tested the 4 selected biosensors and control group with 0, 10, 100, 500, and 1000 μM Cu2+ induced for 20 min, and the result is shown below with logarithmic coordinates.

Fig. 4-7. The leakage expression of different promoters

The figure shows the response ranges of biosensors with different promoters within 20 min. For most biosensors, the fluorescence intensity increases as copper ion’s concentration increases from 0 to 100 μM. However, when the concentration exceeds 100 μM, the responses of most biosensor become slow, and the fluorescence intensity decreases. A reasonable explanation is that high concentrations of copper can inhibit the biosensor's response within a short time.
Fortunately, we still found a biosensor who met the requirements of an excellent biosensor. EP-5 has a less leakage and a higher sensitivity. Its fluorescence intensity is lower than the control group by 17 units with no induction and is higher by 21 units with 100-μM-Cu induction. By aligning the sequence with the CUP1 promoter, we found altered bases mainly located at both sides of UASs and a deletion of one base even occurred between two UASs. We suspected that the change of sensitivity and leakage expression mainly due to the change of spatial distribution and the increase of A/T concentration, which both could influence the binding procedure of transcription factors.

Fig. 4-8. The base changes in EP-5

DISCUSSION & FUTURE WORK
In our characterization of both primary and improved promoters, we found the effect of induction is not as obvious as expected (Previous iGEM team’s results). After reading some references, we found the activation process is related to the acetylation of H3 and H4 located at the CUP1 promoter, which showed nucleosome reposition and transcription factors binding might be the main reason for the activation. However, our biosensors were ligated on plasmid pRS416, which usually exists in the nucleus in a supercoiled state. There is only little possibility for a plasmid to binds to histones, so the transcription process shows less activation than that on a chromosome.
In the future, we plan to construct this biosensor on chromosomes to see whether the result will be more positive. Meanwhile, we will continue enlarging the response peak and range to improve this biosensor.
Reference
Badi, L., & Barberis, A. (2002). The CUP1 upstream repeated element renders CUP1 promoter activation insensitive to mutations in the RNA polymerase II transcription complex. Nucleic acids research, 30(6), 1306-1315.
Koller, A., Valesco, J., & Subramani, S. (2000). The CUP1 promoter of Saccharomyces cerevisiae is inducible by copper in Pichia pastoris. Yeast, 16(7), 651-656.
Labbé, S., & Thiele, D. J. (1999). [8] Copper ion inducible and repressible promoter systems in yeast. Methods in enzymology, 306, 145-153.
Leblanc, B. P., Benham, C. J., & Clark, D. J. (2000). An initiation element in the yeast CUP1 promoter is recognized by RNA polymerase II in the absence of TATA box-binding protein if the DNA is negatively supercoiled. Proceedings of the National Academy of Sciences, 97(20), 10745-10750.
Shen, C. H., Leblanc, B. P., Neal, C., Akhavan, R., & Clark, D. J. (2002). Targeted histone acetylation at the yeast CUP1 promoter requires the transcriptional activator, the TATA boxes, and the putative histone acetylase encoded by SPT10. Molecular and cellular biology, 22(18), 6406-6416.
Heavy Metals' Enrichment
overview
Our HPers have conducteded research in Shanxi Province. They found some factories directly choose to only deal with one main kind of the heavy metals, then abandon others. The convenient treatment obviously can't satisfy the environmental requirements. Hence, we demand a type of bacterium to handle two types of heavy metal ions together.
The genetic circuit based on the Vika-Vox system enables stepwise treatment, owing to a switch from the expression of Cup1 (copper accumulation) to LIMT (cadmium accumulation). We grow our yeasts and measure the concentration of heavy metal ions in the supernatant at equal intervals to test the efficiency of our system.
Construction
The TEF promoter, the Cup1 gene, and the Ura3 terminator are ligated together, integrated into vox-ura3-vox system by homologous recombination. 5-FOA plate helps us to screen the correct cell. Similarly, the LIMT gene and the Ura3 nutritional label are integrated into the synthetic chromosome V, too.
PCR is used to check if we successfully completed the molecular biology construction.

Figure 5-1. The results of PCR of our S.C-Cu. LIMT gene (length of 319bp) 、Cup1(length of 186bp) and complete sequence(length of 3114bp)have been amplified. which indicated that we succeeded in the construction of genetic circuit.
Fig.5-1 the results of PCR. We use 2k plus Ⅱ as the marker. On four parallel lanes of the gel (number 1,2,3,4), run were four set of DNA molecules of known size ( 319bp for number 1, the LIMT; 186bp for number 2 and 3, the Cup1; 3114bp for number 4,the whole sequence contained Cup1). From the DNA band of number 1, we could analyze that vika has been expressed to delete the Cup1 and its terminor, so we can get the LIMT. From the DNA band of number 2, 3 and 4, we could delightedly prove that the fragments (TEF promoter, Cup1 and ura3 terminator) have successfully transformed to synthetic chromosome V.
Accumulation
Firstly, S.C-Cu, S8 (screened by SCRaMbLE) and BY4741 are cultured in YPD liquid media for 24 hours. Then add the 430 mg/L copper ions solution. Cells are cultured for another 45 hours (30℃). Atomic absorption spectroscopy is used to measure the concentration of copper ions in the supernatant every 5 hours. We depict the adsorption curve of copper ions.
In the same way, we culture Cd Yeast, S1 (screened by SCRaMbLE) and BY4741 in YPD liquid medium for 24 hours and then add xx mg/L cadmium ions solution to the media for another xx hours (30℃). the concentration of cadmium ions in the supernatant is measured every x hours.
In terms of the respective ability to adsorb copper and cadmium, we compare genetically-engineered yeast, SCRaMbLE yeast and original one.
As is illustrated in Fig.5-1 and Fig.5-2, engineered yeast significantly absorbs more ion than the control group without any improvement. Furthermore, SCRaMbLE yeast also shows excellent adsorption capacity, comparable to genetically-engineered one. Fig.X1 reveals the adsorption of copper ion, which relatively faster than cadmium, showed in Fig.X2.

Figure 5-2.The variations of copper(II) consumption with time for S.C-Cu、S8 and BY4741 at 430 mg/L copper(II) concentrations.
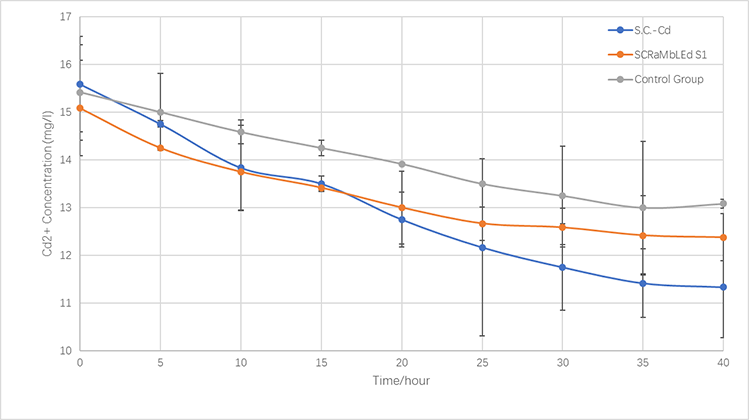
Figure 5-3.The variations of cadmium(II) consumption with time for S.C-Cd、S1 and BY4741 at 16 mg/L cadmium(II) concentrations
Afterwards, we check if the vika enzyme could work well. The Cu yeast with a plasmid expressing vika enzyme is grew in the medium with raffinose, then transferred to heavy metal solution.

Figure 5-4. S.C-Cu is cultivated in medium with raffinose including 320mg/L copper ions and 6mg/L Cadmium.galactose is added at 12 hours to turn on "switch".
Fig.5-4 clearly shows the change of the concentration of heavy metal ions in the supernatant. Firstly, the Cu yeast works smoothly. The concentration of copper ions declines over time while that of cadmium ions barely changes. 12 hours later, we add galactose to the solution. Situation changes. Galactose induces the enzyme, changing Cu yeast to Cd yeast. It leads to faster adsorption of cadmium but slower for copper..
DISCUSSION & FUTURE WORK
In the experiment, we find the LIMT doesn’t appear as ideal as we thought. In the future work, we plan to read involved references in order to complete protein modification by rational design.
Moreover, it’s a pity that we have no time to combine our genetic circuit and SCRaMbLE yeast. In subsequent experiments, it deserves a try to transform fragments into SCRaMbLE yeast, checking if it will double the absorption capacity or even better.
In the nutshell, we will be dedicated to improve the absorption efficiency and better our genetic circuit.
Reference
Wang J, Chen C. Biosorption of heavy metals by Saccharomyces cerevisiae: A review[J]. Biotechnology Advances, 2006, 24(5):427.
C. Baumann, A. Beil, S. Jurt, M. Niederwanger, O. Palacios, M. Capdevila, S. Atrian, R. Dallinger, O. Zerbe, Angew. Chem. Int. Ed. 2017, 56, 4617.
Dönmez G, Aksu Z. The effect of copper(II) ions on the growth and bioaccumulation properties of some yeasts[J]. Process Biochemistry, 1999, 35(1–2):135-142.