Difference between revisions of "Team:Newcastle/Results"
| Line 916: | Line 916: | ||
<div id="degfp" class="collapse"> | <div id="degfp" class="collapse"> | ||
| − | |||
| − | |||
| − | |||
| − | |||
| − | |||
<br /> | <br /> | ||
| Line 939: | Line 934: | ||
<h2 style="font-family: Rubik; text-align: left; margin-top: 1%"> Implementation </h2> | <h2 style="font-family: Rubik; text-align: left; margin-top: 1%"> Implementation </h2> | ||
| − | <p>The J23100-deGFP construct described above was Gibson assembled into a pSB1C3 plasmid using the NEB Hi-Fi assembly kit. To do this, pSB1C3 was digested with XbaI and SpeI to create a linearised plasmid backbone [LINK TO DIGEST PROTOCOL]. The deGFP gBlock DNA was prepared according to the IDT protocol [LINK HERE TO PROTOCOL] and assembled into the linear plasmid backbone according to the NEB Hi-Fi Protocol [LINK]. The assembly mixture was then transformed into commercial DH5α cells and incubated on chloramphenicol plates overnight [PROTOCOL LINK]. Colonies which were green under UV light were picked and grown in 5 mL LB broth overnight [PROTOCOL] before undergoing plasmid extraction [PROTOCOL]. DNA samples were then sent for sequencing to ensure that the construct was correct [DOWNLOAD LINK].</p> | + | <p>The J23100-deGFP construct (Figure 1) described above was Gibson assembled into a pSB1C3 plasmid using the NEB Hi-Fi assembly kit. To do this, pSB1C3 was digested with XbaI and SpeI to create a linearised plasmid backbone [LINK TO DIGEST PROTOCOL]. The deGFP gBlock DNA was prepared according to the IDT protocol [LINK HERE TO PROTOCOL] and assembled into the linear plasmid backbone according to the NEB Hi-Fi Protocol [LINK]. The assembly mixture was then transformed into commercial DH5α cells and incubated on chloramphenicol plates overnight [PROTOCOL LINK]. Colonies which were green under UV light were picked and grown in 5 mL LB broth overnight [PROTOCOL] before undergoing plasmid extraction [PROTOCOL]. DNA samples were then sent for sequencing to ensure that the construct was correct [DOWNLOAD LINK].</p> |
| Line 954: | Line 949: | ||
<p>The expression of deGFP was first tested in <i>E. coli</i> cells using an experimental procedure similar to that used in the Interlab study. Cells transformed with pSB1C3-J23100-deGFP were grown in 10 mL LB broth overnight and OD600 nm was measured. Culture was added to 3 separate falcon tubes and made up to 12 mL with LB with chloramphenicol such that the starting OD600 of the culture was approximately 0.02. This set-up was repeated with cells containing an identical plasmid and construct, except sfGFP was in place of deGFP. As a control, untransformed cells were also prepared identically except the LB did not contain chloramphenicol. Tubes with only LB and LB+chloramphenicol were also prepared as blanks. | <p>The expression of deGFP was first tested in <i>E. coli</i> cells using an experimental procedure similar to that used in the Interlab study. Cells transformed with pSB1C3-J23100-deGFP were grown in 10 mL LB broth overnight and OD600 nm was measured. Culture was added to 3 separate falcon tubes and made up to 12 mL with LB with chloramphenicol such that the starting OD600 of the culture was approximately 0.02. This set-up was repeated with cells containing an identical plasmid and construct, except sfGFP was in place of deGFP. As a control, untransformed cells were also prepared identically except the LB did not contain chloramphenicol. Tubes with only LB and LB+chloramphenicol were also prepared as blanks. | ||
</br></br> | </br></br> | ||
| − | The cultures were shake-incubated at 37oC. 300 μL samples from each tube were taken at time points of 15 mins, 2 hours, 4 hours, and 6 hours and stored at 4oC until the end of the experiment. 100 μL of each sample were then added to a 96-well plate. Fluorescence (excitation 485 nm, emission 510 nm) and absorbance (OD600 nm) were measured using a BMG-Labtech fluostar optima plate reader. Fluorescence intensity and grow rates for all three cell types were calculated over time (Figure | + | The cultures were shake-incubated at 37oC. 300 μL samples from each tube were taken at time points of 15 mins, 2 hours, 4 hours, and 6 hours and stored at 4oC until the end of the experiment. 100 μL of each sample were then added to a 96-well plate. Fluorescence (excitation 485 nm, emission 510 nm) and absorbance (OD600 nm) were measured using a BMG-Labtech fluostar optima plate reader. Fluorescence intensity and grow rates for all three cell types were calculated over time (Figure 2). It was found that while cells expressing sfGFP had a much higher fluorescence intensity than cells expressing deGFP, the growth rate for cells with deGFP was closer to that of untransformed cells. This suggests that in vivo, either deGFP has lower expression than sfGFP, or each molecule of deGFP emits less fluorescence. |
</br></br></p> | </br></br></p> | ||
| Line 963: | Line 958: | ||
<div> | <div> | ||
<img src="https://static.igem.org/mediawiki/2017/9/9e/T--Newcastle--BB_in_vivo_deGFP.png" width="600px"/> | <img src="https://static.igem.org/mediawiki/2017/9/9e/T--Newcastle--BB_in_vivo_deGFP.png" width="600px"/> | ||
| − | <p class="legend"><strong>Figure | + | <p class="legend"><strong>Figure 2:</strong> a) fluorescence intensity of <i>E. coli</i> cells overtime. Each bar represents an average of three repeats, and error bars represent +/- standard error. Fluorescence intensity was negative corrected to LB media. b) growth rate of <i>E. coli</i> cells over time. Each bar represents an average of three repeats, and error bars represent +/- standard error. OD¬600 was negative corrected to LB media.</p> |
</div> | </div> | ||
| Line 971: | Line 966: | ||
<div> | <div> | ||
<img src="https://static.igem.org/mediawiki/parts/e/e5/T--Newcastle--BB_deGFP.png" width="600px"/> | <img src="https://static.igem.org/mediawiki/parts/e/e5/T--Newcastle--BB_deGFP.png" width="600px"/> | ||
| − | <p class="legend"><strong>Figure | + | <p class="legend"><strong>Figure 3:</strong> Visual fluorescence of <i>E. coli</i> cells under UV light. Image shows WT cells (left), cells expressing deGFP (middle), and cells expressing sfGFP (right).</p> |
</div> | </div> | ||
| Line 980: | Line 975: | ||
<p> | <p> | ||
<img src="https://static.igem.org/mediawiki/2017/2/29/T--Exeter--startpage_logo.png" width="100px"/> | <img src="https://static.igem.org/mediawiki/2017/2/29/T--Exeter--startpage_logo.png" width="100px"/> | ||
| − | The <a href="https://2017.igem.org/Team:Exeter">Exeter iGEM team</a> aided us in characterising the deGFP using Fluorescence Activated Cell Sorting (FACS) to get single-cell data. The J23100-deGFP plasmid DNA (BBa_K2205002) was transformed into Top10 <i>E. coli</i> cells by the Exeter iGEM team. They then used a FACS machine to analyse the fluorescence of 10,000 cells in 2 cultures of wild types cells, and 5 cultures of Top10 cells expressing deGFP. We then analysed the data to determine that approximately ~50% of cells in the culture were fluorescent (Figure | + | The <a href="https://2017.igem.org/Team:Exeter">Exeter iGEM team</a> aided us in characterising the deGFP using Fluorescence Activated Cell Sorting (FACS) to get single-cell data. The J23100-deGFP plasmid DNA (BBa_K2205002) was transformed into Top10 <i>E. coli</i> cells by the Exeter iGEM team. They then used a FACS machine to analyse the fluorescence of 10,000 cells in 2 cultures of wild types cells, and 5 cultures of Top10 cells expressing deGFP. We then analysed the data to determine that approximately ~50% of cells in the culture were fluorescent (Figure 4). |
</p> | </p> | ||
<div> | <div> | ||
<img src="https://static.igem.org/mediawiki/2017/c/cc/T--Newcastle--BB_deGFP_FACS.png" width="600px"/> | <img src="https://static.igem.org/mediawiki/2017/c/cc/T--Newcastle--BB_deGFP_FACS.png" width="600px"/> | ||
| − | <p class="legend"><strong>Figure | + | <p class="legend"><strong>Figure 4:</strong> Single cell data for <i>E. coli</i> cells expressing deGFP (collected by Exeter iGEM). Columns 1-6: cells expressing deGFP. Columns 7 and 8: wild type Top10 cells. Red parts of the bar are non-fluorescent cells, green parts are fluorescent cells.</p> |
</div> | </div> | ||
| Line 991: | Line 986: | ||
<p> | <p> | ||
</br></br> | </br></br> | ||
| − | Expression of deGFP in a cell-free protein synthesis (CFPS) system was then tested. Commercial S30 cell free kits for circular DNA from Promega were used so that results could be easily compared between labs. Reactions were prepared as described in the manufacturer’s protocol. Briefly, a master mix for 10 reactions was prepared (200 μL S30 premix, 150 μL S30 extract, 25 μL amino acid mix minus leucine, 25 μL amino acid mix minus cysteine) and 40 μL was added to nine tubes. To three tubes 1.2 μg J23100-deGFP was added, and J23100-sfGFP plasmid DNA was added to a further three. All reactions were then made up to 50 μL with nuclease-free water and transferred to a 96-well plate. Reactions were incubated in a BMG Labtech Fluostar Optima plate-reader at 37oC with fluorescence readings (excitation 485 nm, emission 510 nm) every 15 mins. It was found that, as expected, expression of the J23100-deGFP construct showed fluorescence above background level (Figure | + | Expression of deGFP in a cell-free protein synthesis (CFPS) system was then tested. Commercial S30 cell free kits for circular DNA from Promega were used so that results could be easily compared between labs. Reactions were prepared as described in the manufacturer’s protocol. Briefly, a master mix for 10 reactions was prepared (200 μL S30 premix, 150 μL S30 extract, 25 μL amino acid mix minus leucine, 25 μL amino acid mix minus cysteine) and 40 μL was added to nine tubes. To three tubes 1.2 μg J23100-deGFP was added, and J23100-sfGFP plasmid DNA was added to a further three. All reactions were then made up to 50 μL with nuclease-free water and transferred to a 96-well plate. Reactions were incubated in a BMG Labtech Fluostar Optima plate-reader at 37oC with fluorescence readings (excitation 485 nm, emission 510 nm) every 15 mins. It was found that, as expected, expression of the J23100-deGFP construct showed fluorescence above background level (Figure 5). It was also found that expression of the J23100-sfGFP construct in a CFPS system results in higher levels of fluorescence than deGFP. Therefore, although deGFP may show improved expression in CFPS systems than other GFP variants, sfGFP still shows higher fluorescence levels. |
</br></br> | </br></br> | ||
<div> | <div> | ||
<img src="https://static.igem.org/mediawiki/parts/8/85/T--Newcastle--BB_CFPS_deGFP_sfGFP.png" width="600px"/> | <img src="https://static.igem.org/mediawiki/parts/8/85/T--Newcastle--BB_CFPS_deGFP_sfGFP.png" width="600px"/> | ||
| − | <p class="legend"><strong>Figure | + | <p class="legend"><strong>Figure 5:</strong> CFPS Expression of J23100-deGFP and J23100-sfGFP Constructs. Time course for increase in fluorescence intensity of CFPS systems expressing GFP constructs over time. Each data point is an average of triplicate results, and error bars show +/- standard error. CFPS system with no DNA (Red) was used as the negative control.</p> |
</div> | </div> | ||
Revision as of 18:47, 31 October 2017
spacefill
spacefill
Our Experimental Results
Below is a diagram of our Sensynova Framework. Clicking on each part of the framework (e.g. detector modules) links to the relevant results.
Alternatively, at the bottom of this page are tabs which will show you results for every part of the project
Framework |
Framework Chassis |
|||
|
Biochemical Adaptor 
|
||||
|
Target 
|
|
Detector Modules 
|
Multicellular Framework Testing 
|
|
|
|
||||
|
C12 HSL: Connector 1 
|
||||
|
|
||||
|
Processor Modules 
|
||||
|
|
Framework in Cell Free Protein Synthesis Systems 
|
|||
|
C4 HSL: Connector 2 
|
||||
|
|
||||
|
Reporter Modules 
|
||||
|
Looking for Interlab Study related results? Click below! 
|
||||
Sarcosine Oxidase
BioBricks used: BBa_K2205003 (New), BBa_K2205004 (New)
Rationale and Aim
Sarcosine Oxidase (SOX) is an enzyme that oxidatively demethylates sarcosine to form glycine, hydrogen peroxide and formaldehyde (Figure 1) (Trickey et al. 1999). SOX was selected to be an example of a possible solution to one of the 5 problems in biosensor production that we identified - unconventional substrates. We defined an unconventional substrate as a substrate that we have little prior knowledge of but that can be adapted into something with an existing biosensor. SOX was specifically chosen to demonstrate that glyphosate, an unconventional substrate which there is not a lot information on, can be converted into formaldehyde which there are existing biosensors for (Ling and Heng 2010). As part of our project, SOX was designed to be an ‘adapter’ that could link glyphosate into our framework via a formaldehyde detector module. This concept could then be applied to other molecules that have easily detectable substrates in their degradation pathways. The aim of this part of the project was to demonstrate that SOX can be expressed by E. coli cells and that when glyphosate is added SOX can convert it to formaldehyde to be detected via a biosensor.

Figure 1: Biochemical pathway of the degradation of glyphosate to glycine and formaldehyde.
Background Information
Glyphosate is a herbicide that works by blocking the activity of the enzyme enolpyruvylshikimate-3-phosphate synthase (EPSPS), which converts carbohydrates derived from glycolysis and the pentose phosphate pathway to plant metabolites and aromatic amino acids. We attempted to design a system capable of glyphosate detection. With little information regarding mechanisms of glyphosate interactions with the cell, we could not design a simple system, representative of the majority of synthetic biology biosensor designs, in which a responsive transcription factor was able to affect the production of a reporter gene. The mining of transcriptome data has previously been used to find responsive DNA elements to a molecule of interest (Groningen 2012). Therefore, we analysed differences in transcriptome data between glyphosate sensitive and insensitive plants. A number of genes were found which were differently expressed. However, it was determined that it is more likely that this differential expression was not due to glyphosate directly, but rather the aromatic amino acid starvation caused by EPSPS inhibition by glyphosate, making these systems unsuitable for direct glyphosate detection. Various other systems we designed were also far from ideal, with high levels of complexity and reliance on native plant machinery. Through conversations with biosensor developers, we found that this problem was common in biosensor development - large amounts of often unavailable data is required for system design. For the Sensynova framework, we needed a more generic solution to this issue. Therefore, we expanded our search to look for biochemical reactions which we could monitor instead. This resulted in our concept of “adapter” devices which can alter difficult to sense molecules using biochemical reactions.
Design Stage
To ensure the codon usage of our SOX protein was not differing significantly from the average codon usage of E. coli, rare codons were removed from the sequence using the IDT codon optimisation toolto produce high protein expression. E. coli BL21-DE3 cells have higher levels of protein expression than DH5α cells and so were a more practical choice. This led to the expression of SOX being placed under the control of a T7 promoter due to BL21-DE3 cells producing T7 polymerase after the addition of IPTG. During the initial design stage of the protein, parts of the sequence were lost between optimisation and sending it to be synthesised into a gBlock. This was not discovered until expression of SOX was induced by IPTG in BL21-DE3 cells and a sample analysed by SDS-Page gel electrophoresis (Figure 2). It was noticed that the band we were expecting was of a lower molecular weight than what it should have been; ~35kDa instead of ~42kDa. It was realised that the sequence in the PSB1C3 plasmid was different to the sequence origin. Therefore a new gBlock was synthesised using the proper sequence and an SDS-Page gel used to confirm that the protein expressed was of the correct molecular weight (Figure 3).
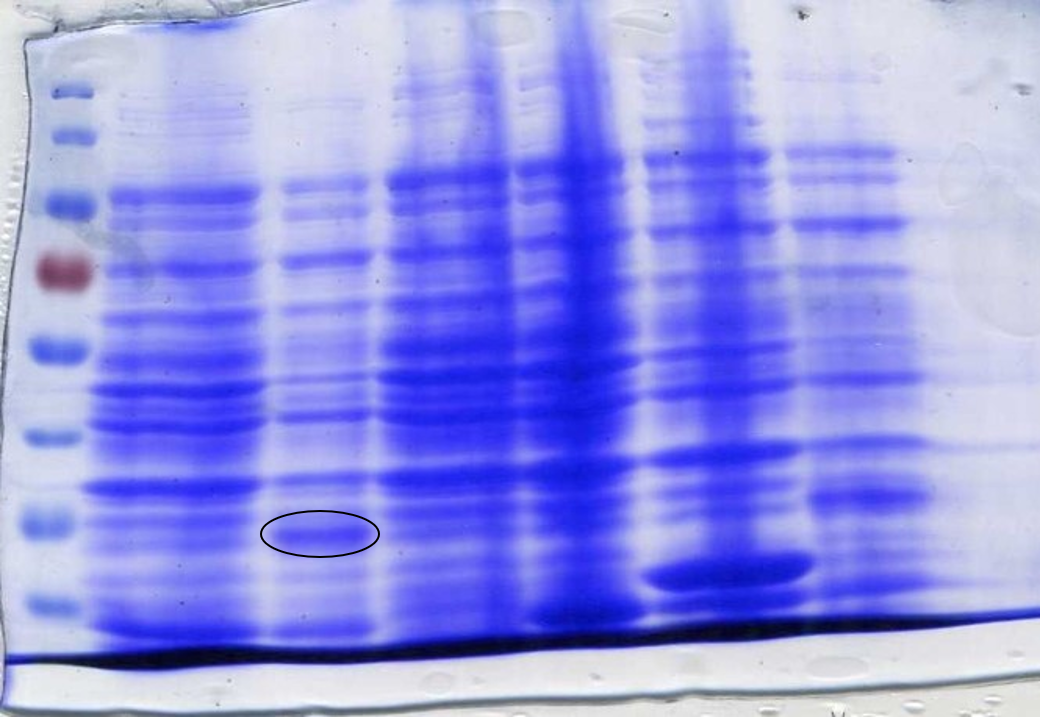
Figure 2: Lane 1: ladder, Lane 2: SOX, Lane 3: SOX+IPTG, Lane 4:SOX+IPTG, Lane 5:BL21 cells, Lane 6: sfGFP+IPTG, Lane 7: sfGFP. Circled band shows sarcosine oxidase at ~35 kDa.

Figure 3: Sarcosine Oxidase expression was induced by adding 40 µl of 100 mM IPTG. Lane 1: 6 µl ladder, Lane 2: 10 µl sfGFP, Lane 3: BL21-DE3, Lane 4: 10µl SOX 1, Lane 5: 10 µl SOX 2, Lane 6: 10 µl SOX 3, Lane 7: 10 µl SOX 4, Lane 8: 10 µl SOX 5, Lane 9: 10 µl SOX 6, Lane 10: 6 µl ladder. Circled bands show sarcosine oxidase at ~42 kDa, the expected weight.
Implementation
SOX was synthesised as a gBlock and assembled using HiFi Assembly. After assembly, SOX was transformed into E. coli DH5α cells and then into BL21-DE3 cells. This was done because DH5α cells are better for transformation, while BL21-DE3 cells are better for protein expression. Colonies indicated successful assembly, which was confirmed by creating plasmid DNA preparations of the colonies and performing confirmation digests to view on an agarose gel using the restriction enzymes Xba1 and Spe1 (Figure 4).

Figure 4: Restriction digest confirmation of first sarcosine oxidase assembly using Xba1 and Spe1 restriction enzymes.
The plasmid DNA preps with the correctly assembled SOX gBlock present were then transformed into E. coli BL21-DE3 cells. This was because BL21-DE3 cells are optimised for protein expression and because SOX was designed with a T7 promoter; DH5α cells do not produce the T7 polymerase required to express SOX whereas BL21-DE3 cells do in the presence of IPTG.
To prepare SOX for testing, cell cultures were grown following this protocol to step 4. The protocol used for CFPS extract preparation [LINK IT] was then followed. SDS-PAGE gel electrophoresis of the samples was done to check for SOX expression. 1 ml of each culture was lysed with lysozyme and incubated at room temperature before being boiled at 100°C for 10 minutes. 20 µl samples were loaded into each lane. At this point, an error was spotted with the size of SOX on the SDS-PAGE gel (Figure 2).
The band was approximately 7 kDa too small. It was then discovered that the sequence synthesised as a gBlock was different to the original sequence found online; parts of the sequence were missing. A new gBlock with the correct sequence was synthesised and the above methods for assembly and preparation for testing were repeated (Figure 3).
To test for the presence of formaldehyde, and to demonstrate this part works, larger cultures were grown following the aforementioned protocols, and the cells harvested, washed and lysed by sonication. 0 µl, 20 µl, 200 µl and 2 ml of Glyphosate at 10 mg/L concentration was added to the cell lysate and incubated at 37°C. Every 2.5 hours the lysate was tested for the presence of formaldehyde with commercial formaldehyde testing strips.
After 8 hours of testing and left overnight, none of the samples had produced formaldehyde according to the testing strips. The testing strips detect a minimum formaldehyde concentration of 10 mg/L, so it was possible that formaldehyde had been produced but that there was too little of it to detect with the strips.
We decided to add Sarcosine instead of Glyphosate to determine whether the part was working. Everything was repeated the same but instead we added 0 µl, 50 µl and 200 µl of Sarcosine at 0.9 g/50 ml.

Figure 5: Lysed cell cultures induced with 40 µl of a 100 mM stock of IPTG tested with formaldehyde strips. From left to right: SOX+0 µl sarcosine, SOX+IPTG+0 µl sarcosine, WT+0 µl sarcosine, WT+IPTG+0 µl sarcosine, SOX+50 µl sarcosine, SOX+IPTG+50 µl sarcosine, WT+50 µl sarcosine, WT+IPTG+50 µl sarcosine, SOX+200 µl sarcosine, SOX+IPTG+200 µl, WT+200 µl sarcosine, WT+IPTG+200 µl.
This shows SOX works as expected, however there is leaky expression as formaldehyde is produced when no IPTG is added.
Characterisation
To determine whether SOX had been successfully expressed after adding IPTG we performed an SDS-Page gel. After inducing, harvesting and washing the cells 1 ml was taken from each culture to be loaded into the gel. The cells were lysed using lysozyme and boiled for 3 minutes at 100°C loading 10 µl into the gel (Figure 3) or lysed using lysozyme and boiled for 10 minutes at 100°C loading 20 µl into the gel (Figure 2). In both SDS-Page gels of the incorrect and correct SOX sequences (Figures 2 and 3 respectively) a band is present in the lanes that have been loaded with SOX induced with IPTG. Figure 5 shows that SOX works as expected, producing formaldehyde, however formaldehyde is produced even when SOX expression has not been induced with IPTG, indicating leaky expression.
Conclusions and Future Work
E. coli cells naturally have the C-P lyase pathway which degrades glyphosate into sarcosine. The fact that no formaldehyde was produced when glyphosate was added, but was when sarcosine was added, indicates that we have not overexpressed the C-P lyase pathway enough to produce enough sarcosine for SOX to convert into formaldehyde to be detected.
References
Ling YP, Heng LY (2010). A Potentiometric Formaldehyde Biosensor Based on Immobilization of Alcohol Oxidase on Acryloxysuccinimide-modified Acrylic Microspheres. Sensors 10:9963-9981. Trickey P, Wagner MA, Jorns MS, Mathews FS (1999). Monomeric sarcosine oxidase: structure of a covalently flavinylated amine oxidizing enzyme. Structure 7:331-345.
Synthetic Promoter Library
BioBricks used: BBa_J61002 (Arkin Lab 2006)
Rationale and Aim
The Sensynova multicellular biosensor platform has been developed to overcome the limitations identified by our team [hyperlink to human practices] that hamper the success in biosensors development. One of these limits regards the lack of modularity and reusability of the various components. Our platform design, based on the expression of three main modules (Detector, Processor and Output) by three E.coli strains in co-culture, allows the switch of possible variances for each module and the production of multiple customised biosensors. This section of the project is based on testing the modularity of the system by replacing the IPTG sensing unit present in the Sensynova platform with various synthetic promoters that are regulated by small molecules.
Background Information
Though the concept of engineering promoters to bind and sense targeted molecules is not a new concept in Synthetic Biology as demonstrated by the work several iGEM teams over the years, there are limitations with taking such guided approach. Though a system is identified for the chosen target molecule, there is no variants in which to compare such system against. They also lack the ability to test many targeted molecules in parallel as each molecule would require their own engineered promoter. In order to combat these limitations, we propose the creation of a library of synthetically engineered promoter that can be screened against targeted molecules in order to isolate a promoter being regulated by such molecule.
Design Stage
The Escherichia coli lactose (lac) operon is one of the most stud-ied paradigm for gene expression control (Becker et al., 2012). The lac system is ubiquitously used as a manner of controlling transcription in a range of different scenarios (Becker et al., 2012). It is also often used as a starting point for engineering and design of synthetic promoter variations as demonstrated by the work of Liu et al. in 2004. It was therefore chosen as the starting base for the design of the promoter library in this study. Promoter libraries can be created by varying many different as-pects of a wildtype promoter such as the upstream element prior to the -35 region, the downstream element, after the -10 region prior to -1, and its core sequence, between the -35 and -10 regions (Schlabach et al., 2010). In this study, we propose to use the PLac promoter sequence as our wildtype for creating promoter designs varying different areas of its sequence. One of such variation will be the substitution of the -35 and -10 currently found in PLac with the -35 (TTGACA) and -10 (TATAAT) regions found to be the most commonly occurring in E. coli natural promoters (Hawley and McClure, 1983, DeBoer, 1985, Harley and Reynolds, 1987). These were chosen to be the constant region between different promoter designs. By analyzing the findings of Harley and Reynolds (1987) and Lisser and Margalit (1993), the decision to vary the number of base pairs in the region present between the -35 and -10 elements to 17 base pairs instead of the 18 present in the wildtype PLac. Variations of the upstream and downstream regions where the lac operon would normally bind to will also be investigated in this study by the production of three different promoter designs resulting in a diverse promoter library.
Implementation
Text goes here.
Conclusions and Future Work
Due to time constraints, we lacked the time to characterise these parts into the Sensynova platform within the lab.
References
Text goes here.
Arsenic Biosensor
BioBricks used: BBa_J33201(Edinburgh ), BBa_K2205022 (New)
Rationale and Aim
The Sensynova multicellular biosensor platform has been developed to overcome the limitations identified by our team that hamper the success in biosensor development. One of these limits regards the lack of modularity and reusability of the various components. Our platform design, based on the expression of three main modules (Detector, Processor and Reporter) by three E. coli strains in co-culture, allows the switch of possible variances for each module and the production of multiple customised biosensors. This section of the project is based on testing the modularity of the system by replacing the IPTG detector part of the Sensynova design with different detecting parts. In particular, an Arsenic sensing part will be used.
Background Information
The part BBa_J33201 was made by the Edinburgh team in 2006.

Figure 1: BBa_J33201 design.
This part consists of the promoter of the E. coli JM109 chromosomal arsenic detoxification operon (ars operon), including the ArsR repressor binding site and the arsR gene encoding the arsR repressor protein, together with its ribosome binding site. Addition of any other genes to the 3' end of this part will result in their expression being dependent on the presence of sodium arsenate or sodium arsenite. Arsenite or arsenite anion binds to the repressor protein ArsR, resulting in inability to repress the promoter. Based on our experiments, a concentration of 1 micromolar sodium arsenate in LB is sufficient for essentially full expression, though this will vary according to conditions.
Design Stage

Figure 2: The new part BBa_K2205022 based on the previous Arsenic detector design BBa_J33201, implemented by the Sensynova part coding for the connector 1, BBa_K2205008. |

Implementation
In order to introduce the Arsenic sensing part in the Sensinova framework, the part BBa_K2205008 containing the RBS B0034, the lasI coding sequence and the double terminator B0015 has been included in the design. The new part BBa_K2205022 presents biobrickable suffix and prefix and has been designed to have specific overhangs to be assembled in the plasmid pSB1C3 by Gibson assembly method. The part has been obtained by gBlock synthesis from IDT and subsequently assembled into the plasmid using NEB HI-Fi kit. The assembly mix was heat-shock transformed in competent DH5α and plated on Chloramphenicol LB plates. The colonies were tested through colony PCR and confirmed by sequencing.

Figure 4: On the gel, colony PCR samples confirming the successful assembly of BBa_K2205022 into pSB1C3.
In the presence of arsenic, the repression will be avoided by binding the repressor ArsR This bound allows the transcription of the downstream gene, lasI. This gene encodes for the quorum sensing molecule C12, which acts as a connector to the processing cell.
Characterisation
Qualitative assay. Due to time constraints only a preliminary qualitative assay was carried out. Co-cultures of Arsenic detector, processor unit and 3 different reporter modules carrying 2 chromoproteins (Chromoproteins link)(BBa_K2205016, BBa_K2205018)and sfGFP(BBa_K2205015) were inoculated and grown overnight in LB+chloramphenicol (12,5ng/ul). The day after the cultures were diluted at OD600: 0,1 and mixed together to obtain co-cultures with ratio 1:1:13 (detector:processor:reporter). The samples were supplemented with different concentration of Arsenic(0ppb, 10ppb, 50ppb, 100ppb) to induce the expression of quorum sensing molecules and eventually achieve the chromoproteins visualisation (Figures 6, 7, 8).


Figure 6: Pellets collected after overnight co-cultures of Arsenic detector (BBa_K2205022) + processor (BBa_K2205012) + Pink Chromoprotein reporter (BBa_K2205018) in ratio 1:1:13, with different concentrations of Arsenic (0ppb, 10ppb, 50ppb, 100ppb). |


Figure 7: Pellets collected after overnight co-cultures of Arsenic detector (BBa_K2205022) + processor (BBa_K2205012) + Blue Chromoprotein reporter (BBa_K2205016) in ratio 1:1:13, with different concentrations of Arsenic (0ppb, 10ppb, 50ppb, 100ppb). |


Figure 8: Pellets collected after overnight co-cultures of Arsenic detector (BBa_K2205022) + processor (BBa_K2205012) + sfGFP reporter (BBa_K2205015) in ratio 1:1:13, with different concentrations of Arsenic (0ppb, 10ppb, 50ppb, 100ppb). The preliminary qualitative assay above shows that there is no significant difference among the samples when inoculated with Arsenic in different concentrations and the controls (no Arsenic). Optimisation of the Arsenic detection into the Sensynova framework is required. |
Conclusions and Future Work
The results demonstrate that further characterisation needs to be conducted in order to optimise the Arsenic detector variant in the Sensynova platform. However, due to time constraints, we adapted the IPTG framework modelling results to the preliminary experiments conducted for the framework customised as the Arsenic biosensor. In order for future characterisation of this part, the model should be modified in order to guide in vivo efforts accordingly.
References
Brenner, K., Karing, D., Weiss, R. & Arnold, F. (2007) Engineered bidirectional communication mediates a consensus in a microbial biofilm consortium Proc Natl Acad Sci U S A 104(44): 17300 - 17304 de Mora K, Joshi N, Balint BL, Ward FB, Elfick A, French CE. A pH-based biosensor for detection of arsenic in drinking water. Anal Bioanal Chem. 2011 May; 400(4):1031-9. Epub 2011 Mar 27.
Psicose Biosensor (Evry Paris-Saclay Collaboration)
BioBricks used: BBa_K2205023 (New), BBa_K2448006 (Evry Paris-Saclay 2017), BBa_K2448011 (Evry Paris-Saclay 2017)
Rationale and Aim
The Sensynova multicellular biosensor platform has been developed to overcome the limitations identified by our team that hamper the success in biosensor development. One of these limits regards the lack of modularity and reusability of the various components. Our platform design, based on the expression of three main modules (Detector, Processor and Output) by three E.coli strains in co-culture, allows the switch of possible variances for each module and the production of multiple customised biosensors. This section of the project is based on testing the modularity of the system by implementing the biosensor created by the 2017 Evry Paris-Saclay iGEM team into the Sensynova platform as part of our collaboration requirement.
Background Information
This biosensor was designed, made and submitted to the iGEM registry by the Evry Paris-Saclay 2017 team. We chose to use this system as a variant to the IPTG detector module present in the Sensynova platform in order to fulfil the requirement of collaborating with another iGEM team. The image below, provided to us by the Evry Paris-Saclay 2017 team, details the psicose biosensor design. It features the PLac derivative promoter PTAC (BBa_K180000), a RBS (BBa_B0034), the PsiR coding sequence, the terminator (BBa_B0015), the synthetic promoter pPsitac, a RBS (BBa_B0034), a mCherry coding sequence and finally the terminator (BBa_B0015) flanked by the iGEM prefix and suffix.

Figure 1: Evry Paris-Saclay Psicose Biosensor Design
The inducible system works as detailed in the diagram below. When pTAC is induced due to the presence of IPTG, PsiR is transcribed and binds to the pPsitac promoter repressing the transcription of the mCherry protein. When psicose is present, the sugar binds to PsiR, freeing up the promoter and subsequently the colour output

Figure 2: SBOL Visual Detailing Evry Paris-Saclay Psicose Biosensor Design
Design Stage
In order to implement the psicose biosensor variant to the Sensynova platform, a design was created by replacing the IPTG sensing system in the original detector module with the construct detailed above, creating part K2205023. We chose to replace the PTAC promoter with the constitutive promoter present within the platform in order to eliminate the need for induction with IPTG. In place of the colour output present in the Evry Paris-Saclay design, we have added our part K2205008, which produces our first connector in order to trigger a response from following modules of the Sensynova platform.

Figure 3: Evry Paris-Saclay Psicose Biosensor as the Detector Unit
Part K2205023 detailed above was designed using Benchling and ordered for synthesis through IDT. Using Benchling, virtual digestions and ligations were simulated resulting in the plasmid map detailed below.

Figure 4: BBa_K2205023 in PSB1C3
Implementation
The Psicose detector construct obtained by gBlock synthesis has been designed to include required overhangs for Gibson assembly into the linearized plasmid pSB1C3. The plasmid backbone was acquired by digestion [Protocol link] of the part K2205015 with XbaI and SpeI, cutting out the original sfGFP construct. The Psicose detector construct was assembled into the plasmid backbone using the NEB Hi-Fi kit [Protocol link] and transformed into DH5α E. coli cells [Protocol link]. Colony PCR [Protocol link] was performed to check ligations. Colonies picked for this protocol were streaked onto a LB-agar plate. Colonies picked from streaked plates and cultures were prepared for miniprepping [Protocol link]. DNA samples were then sent off for sequencing [Website link] to ensure that the constructs were correct.
Characterisation
A preliminary qualitative assay was carried out as an initial test for this construct. Co-cultures of Psicose detector, processor unit and sfGFP reporter(BBa_K2205015) were inoculated and grown overnight in LB+chloramphenicol (12,5ng/ul). The day after the cultures were diluted at OD600: 0,1 and mixed together to obtain co-cultures with ratio 1:1:13 (detector:processor:reporter). The samples were supplemented with 33.22 mM Psicose to induce the expression of quorum sensing molecules and eventually achieve the reporter visualisation (Figures 8).

Figure 8: Pellets collected after overnight co-cultures of Psicose detector (BBa_K2205022) + processor (BBa_K2205012) + sfGFP reporter (BBa_K2205015) in ratio 1:1:13, with and without PSI.
Conclusions and Future Work
The results demonstrate that further characterisation needs to be conducted in order to optimise the psicose detector variant in the Sensynova platform however, due to time constraints resulted from synthesis delays, we lacked the time to be able to do so. The preliminary experiments conducted for the framework customised as the psicose biosensor were conducted by following data resulted from the model of the framework customised as the IPTG sensor. In order for future characterisation of this part, the model should be modified in order to guide in vivo efforts accordingly. We also lacked the time to co-culture this part with the Sensynova platform's multiple modules in order for the creation of variants for the Evry Paris-Saclay. The part BBa_K2205023, the Evry Paris-Saclay's psicose biosensor system as the detecting unit of the platform, has been submitted to the iGEM registry for future work and characterisation by future teams.
References
iGEM Community. (2017). Team Evry Paris-Saclay 2017. [online] Available at: https://2017.igem.org/Team:Evry_Paris-Saclay [Accessed 30 Oct. 2017].
Formaldehyde
BioBricks used:
Rationale and Aim
Background Information
Design Stage
Implementation
Conclusions and Future Work
References
Fim Standby Switch
BioBricks made and used: BBa_K2205005 (New), BBa_K1632013 (2015 Tokyo Tech part), BBa_K1632007(2015 Tokyo Tech part)
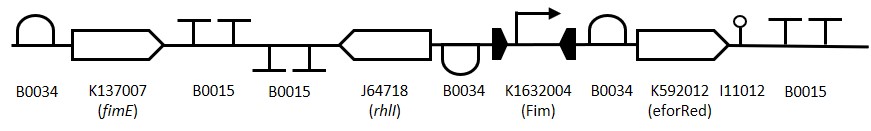
Figure 1: The Fim Switch in the native [OFF] state where the eforRED reporter is expressed allowing direct visualisation of the cells.
Rationale and Aim
Sensynova multicellular biosensor platform has been developed to overcome the limitations that hamper success in biosensor development. One of these limits regards the lack of modularity and reusability of the various components. Our platform design, based on the expression of three main modules (Detector, Processor and Reporter) by three E.coli strains in co-culture, allows the switch of possible variances for each module and the production of multiple customised biosensors.
This part can be used within the platform as a processor unit. Real world applications of biosensors are limited by many factors, one of which is that with most biosensors there is not a readout signal showing if the biosensor is working when not in use, i.e that the cells are still alive and have not lost their biosensor phenotypes. This can make them difficult to use, as well as market, since their viability comes into question as well as leading to false negatives/positives. Biosensors which rely on expression of a reporter signal may also suffer from unobserved activation due to weak or inconstant induction.
For this section of the project, as an improvement on a part by the Tokyo Tech 2015 team (BBa_K1632013), we aim to produce a biobrick compatible part which is able to constitutively express a reporter signal prior to activation (to show that it is functioning) and to amplify a weak or inconsistent induction signal by permanently switching from an [OFF] to [ON] state after induction.
Background Information
Expression of the E. coli type 1 fimbriae gene is tightly regulated and phase dependent, i.e expression is either completely [ON] or [OFF] (Klemm, 1986). This change in expression is controlled by the action of two proteins FimB and FimE which independently act upon a 300bp promoter region upstream of the fimbriae gene. The 300bp promoter region is inverted to either activate or suppress expression (McClain et al., 1991). Typical gene regulation mechanisms rely on up or down regulation of a promoter from a baseline expression, the fimbriae mechanism of ‘ALL’ or ‘NONE’ makes it a useful tool for synthetic biology applications. While the FimB protein inverts the promoter back and forth between [ON] and [OFF] states the FimE protein permanently inverts the promoter from [ON] to [OFF]. This inversion can be used to amplify weak or inconsistent induction signals.
Since the part we are making is designed to amplify a weak signal which can then be detected by a downstream ‘reporter’ cell the quorum sensing system from P. aeruginosa was adapted to allow for signal transfer between cells. The rhlI gene from P. aeruginosa produces the quorum sensing molecule N-butyryl-AHL (C4-AHL) (Parsek et al.,2000) (J64718), this molecule is membrane permeable and able to induce expression of a promoter upstream of sfGFP in another cell (K2205015).
 Figure 2:
Representation of the switching mechanism of the Fim Switch, in the native [OFF] state the eforRED reporter is expressed (shown in red) allowing direct visualisation of the cells. Following the inversion of the promoter region (K1632004), eforRED expression is halted and the rhlI gene is expressed (J64718), this is now the [ON] state.
Figure 2:
Representation of the switching mechanism of the Fim Switch, in the native [OFF] state the eforRED reporter is expressed (shown in red) allowing direct visualisation of the cells. Following the inversion of the promoter region (K1632004), eforRED expression is halted and the rhlI gene is expressed (J64718), this is now the [ON] state.
Design Stage
To construct the Fim reporter switch 3 separate gBlocks were designed with overlapping adapter regions homologous to the iGEM prefix and suffix to allow for Gibson assembly into the pSB1C3 backbone whilst retaining biobrick compatibility. The individual genes and other components are shown in (Table 1). The 1st gBlock sequence starts with a RBS (B0034) upstream of the fimE ORF (K137007) with no promoter region, this is to allow for other promoters to be cloned in upstream of the part. Downstream of the fimE gene is a double terminator (B0015). All RBS and terminator sequences used are B0034 and B0015 respectively. The switching mechanism consists of the Fim promoter sequence (K1632004) flanked by two RBS-ORF-Terminator sequences. While in the native [OFF] state the Fim promoter drives expression of eforRed (K592012) and when flipped to the [ON] state drives expression of rhlI (J64718). The rationale behind using the fimE gene instead offimB is that it permanently inverts the promoter region meaning weak induction signals can be amplified by the Fim switch.
Table 1: Table of parts used for constructing the Fim Switch.

Implementation
To assemble the Fim switch part the isothermal Gibson assembly cloning method was chosen as it would significantly shorten the time taken to assemble 3 separate sequences compared to traditional cloning methods. The 3 gBlock DNA fragments shown in (Table 1) were amplified by high fidelity Q5 PCR and the pSB1C3 backbone was digested with restriction enzymes EcoRI and PstI.
 Figure 3:
High fidelity amplification of the 3 gBlock fragments for assembly of the Fim Switch. The gBlock-1 amplification is shown in lanes 1+2 (819 bp), gBlock-2 amplification is shown in lanes 3+4 (1148 bp) and the gBlock-3 amplification is shown in lanes 5+6 (939bp).
Figure 3:
High fidelity amplification of the 3 gBlock fragments for assembly of the Fim Switch. The gBlock-1 amplification is shown in lanes 1+2 (819 bp), gBlock-2 amplification is shown in lanes 3+4 (1148 bp) and the gBlock-3 amplification is shown in lanes 5+6 (939bp).
The Gibson assembly reaction re-forms the iGEM prefix and suffix regions at the 5’ and 3’ ends of the Fim switch part making the component biobrick compatible while leaving no scarring regions. Following assembly, the plasmid was transformed into chemically competent DH5α E. coli and colonies patched onto LB Chloramphenicol agar plates. A single patch showed the correct red colour indicative of the eforRed chromoprotein (see Figure 4).
 Figure 4:
Patches of the Fim Switch transformants. Patch number 6 shows the correct red colour which indicates expression of the eforRed chromoprotein.
Figure 4:
Patches of the Fim Switch transformants. Patch number 6 shows the correct red colour which indicates expression of the eforRed chromoprotein.
The red patch was cultured in LB chloramphenicol overnight and the plasmid DNA extracted by miniprep. The plasmid was digested with restriction enzymes XbaI and PstI. The image in Figure 5 shows the DNA bands from the digested Fim switch plasmid.

Figure 5:
Restriction digestion of the Fim switch plasmid to confirm successful integration into the iGEM pSB1C3 backbone. The Fim switch plasmid (Lane 1) was digested with XbaI and PstI with expected band sizes of (2840 bp and 2044 bp). The pSB1C3 plasmid (Lane 2) containing sfGFP as a control was also digested with XbaI and PstI with expected band sizes of (811 bp and 2044 bp).
The Fim switch insert is 2882 bp in length which makes performing standard short sequencing reads challenging as multiple reactions are required to completely sequence the entire part. To overcome this we used our in-house Illumina MiSEQ to completely sequence the entire plasmid. Following quality control analysis the sequence was assembled and shown to be a match to the expected Fim switch part.
A problem we found with the Fim switch was that a subset of the colonies were prematurely switching from red to white. This is likely due to a low level of leaky expression of the fimE gene which then inverts the promoter region upstream of the eforRed gene. A single white colony was picked and cultured for use in downstream testing as a control as the switching of the promoter should express the rhlI gene and therefor produce the C4 quorum sensing molecule.
Characterisation
To test the functionality of the Fim switch, ensuring that C4 AHL is produced, the strain was cultured with a reporter strain (K2205015) which produces GFP in response to the quorum sensing molecule C4 AHL. Due to a small sub-population of the Fim switch strain being white, a single white colony was picked and cultured separately. This strain was used as a positive control as it should produce C4 AHL. Both the majority (red) Fim switch strains and minority flipped (white) Fim switch strains were tested for C4 AHL production by co-culture with the reporter strain. Initially the Fim switch strains were spotted onto a lawn of the reporter strain (Figure 6) followed by quantitative analysis of the strains by co-culture in a 96 well microplate (Figure 7).
This culture is then co-cultured with the reporter cell. This reporter cell detects C4 AHL and expresses GFP in response.

Figure 6: Initial test of the red and white fim switch strains which were spotted onto a lawn of the reporter strain (BBa_K2205015).

Figure 7:
Expression of GFP in the reporter (BBa_K2205015)strain in co-culture with the Fim switch strains. The assay was performed using methods described in Fim 96 Plate assay Protocol. The data shows the expression of GFP in the reporter strain over a standard growth curve. The FimW and FimR strains represent the white and red variants of the Fim switch strain respectively, these were co-cultured with the reporter strain in a 1:14 ratio. Each data point is the mean of 3 biological repeats. RFU stands for relative fluorescence units.
Conclusions
The aim of the Fim switch part was to make a processor module which can be visually inspected for functionality. The Fim switch has been shown to expresses the eforRed chromoprotein under normal (uninduced) conditions which allows the user to both determine that the strain is alive and has maintained the Fim switch plasmid. Following induction, the Fim promoter flips direction and begins expressing RhlI which synthesises the C4-AHL quorum sensing molecule. This has been shown to successfully induce expression of sfGFP in the reporter strain (BBa_K2205015).
Despite several attempts we were unable to produce a Fim switch testing construct where fimE expression could be controlled using the E. coli arabinose inducible promoter. Though transformations did yield some colonies when trying to make this part, none were red in colour. This possibly indicates that the arabinose inducible promoter (even when grown on 0.5% w/v glucose) is still too active. The design for this construct has been submitted (BBa_K2205006).
Future Work
Since there is some leaky expression of the fimE gene (even without a promoter) to fine tune the Fim switch the lac operator could be inserted upstream of the fimE RBS to repress unwanted expression. The part could then be used following the addition of IPTG. An alternative method would be to clone a transcriptional terminator upstream of the fimE RBS to prevent leaky expression from elsewhere in the plasmid.
References
P. Klemm, Two regulatory fim genes, fimB and fimE, control the phase variation of type 1 fimbriae in Escherichia coli. EMBO J 5, 1389-1393 (1986).
M. S. McClain, I. C. Blomfield, B. I. Eisenstein, Roles of fimB and fimE in site-specific DNA inversion associated with phase variation of type 1 fimbriae in Escherichia coli. J Bacteriol 173, 5308-5314 (1991).
M. R. Parsek, E. P. Greenberg, Acyl-homoserine lactone quorum sensing in gram-negative bacteria: a signaling mechanism involved in associations with higher organisms. Proc Natl Acad Sci U S A 97, 8789-8793 (2000).
Signal Tuners
BioBricks used: BBa_K2205024 (New), BBa_K2205025 (New), BBa_K2205027 (New), BBa_K2205028 (New), BBa_K274371 (Cambridge 2009), BBa_K274381 (Cambridge 2009)
Rationale and Aim
The Sensynova multicellular biosensor platform has been developed to overcome the limitations identified by our team that hamper the success in biosensor development. One of these limits regards the lack of modularity and reusability of the various components. Our platform design, based on the expression of three main modules (Detector, Processor and Reporter) by three E.coli strains in co-culture, allows the switch of possible variances for each module and the production of multiple customised biosensors. This section of the project is based on testing the modularity of the system by inserting two different sensitivity tuner constructs between the processing units of the Sensynova platform; BBa_K274371 and BBa_K274381 .
Background Information
Both selected sensitivity tuner constructs were made and submitted to the iGEM registry by the Cambridge 2009 team. They were chosen as variants to the empty processing module present in the Sensynova platform due to the fact that, although they have been included in the iGEM distribution kit since their submission in 2009, they have yet to be successfully implemented into a team’s system, as far as we are aware. The 2007 Cambridge iGEM team built 15 different constructs that amplified the PoPS output of the promoter pBad/AraC detailed by image below taken from the Cambridge 2009 team's wiki.

Figure 1: Cambridge 2007 Amplifier System
The 2009 Cambridge iGEM team then re-designed these constructs to be PoPS converters, as image below taken from their wiki details, and generated a set sensitivity tuners corresponding to Cambridge 2007’s amplifiers.

Figure 2: Cambridge 2009 System Design
BBa_K274371 – P2 Phage Sensitivity Tuner
This part is made up of an RBS (BBa_B0034), an org activator coding sequence (BBa_I746350) from P2 phage, the double terminator BBa_B0015 (made up of BBa_B0010 and BBa_B0012) and the inducible promoter PO (BBa_I746361) from P2 phage.

Figure 3: BBa_K274371
BBa_K274381 – PSP3 Phage Sensitivity Tuner
This part is made up of an RBS (BBa_B0034), a pag activator coding sequence (BBa_I746351) from PSP3 phage, the double terminator BBa_B0015 (made up of BBa_B0010 and BBa_B0012) and the inducible promoter PO (BBa_I746361) from P2 phage.

Figure 4: BBa_K274381
Design Stage
In order to implement these two sensitivity tuner variants into the Sensynova platform, designs were made by inserting the above parts between the two constructs forming the empty processor module of our framework.

Figure 5: SBOL Visual Detailing Processor Variants
Using Benchling, virtual digestions of the two sensitivity tuners and ligations to the part K2205010, the connector 1 receiver module, were carried out. These two new constructs were then virtual digested and ligated to the part K2205011, the connector 2 reporter module, resulting in the two plasmid maps detailed below; parts K2205024 and K2205025.


Figure 6: Parts BBa_K2205024 and BBa_K2205025 (Click for larger images)
Implementation
The sensitivity tuners parts BBa_K274371 and BBa_K274381 were requested from the iGEM parts registry. Upon arrival, parts were transformed in DH5α E. coli cells [Protocol link]. Colonies were picked and cultures were prepared for miniprepping [Protocol link]. Minipreps were digested [Protocol link] with XbaI and PstI for BioBrick assembly [Protocol link]. The part K2205010 contained in pSB1C3, was digested [Protocol link] using SpeI and PstI to allow for the insertion of the processing variants directly after the Las controlled promoter (pLas) that would trigger transcription of sensitivity tuners in the presence of connector 1 of the Sensynova platform. Ligations were set up overnight [Protocol link] using NEB’s T4 ligase and transformed in DH5α E. coli cells [Protocol link]. Colony PCR [Protocol link] was performed to check ligations. Colonies picked for this protocol were streaked onto a LB-agar plate. Colonies picked from streaked plates and cultures were prepared for miniprepping [Protocol link]. Minipreps were digested [Protocol link] with SpeI and PstI to allow for the insertion of the part K2205011 directly after the PO promoter. The part K2205010 contained in pSB1C3, was digested [Protocol link] using XbaI and PstI for BioBrick assembly [Protocol link]. Ligations were set up overnight [Protocol link] using NEB’s T4 ligase and transformed in DH5α E. coli cells [Protocol link]. Colony PCR [Protocol link] was performed to check ligations. Colonies picked for this protocol were streaked onto a LB-agar plate. Colonies picked from streaked plates and cultures were prepared for miniprepping [Protocol link]. DNA samples were then sent off for sequencing [Website link] to ensure that the constructs were correct.
Conclusions and Future Work
Due to time constraints, we lacked the time to characterise these parts into the Sensynova platform within the lab. The parts BBa_K2205024 and BBa_K2205025, the parts BBa_K274371 and BBa_K274381 respectively as processing units of the platform, were been submitted to the iGEM registry for future work and characterisation by future teams. The intermediate parts BBa_K2205027 and BBa_K2205028, the parts BBa_K274371 and BBa_K274381 respectively resulted from the ligation to the first part of processing unit of the platform prior to the ligation to part of processing unit of the platform, were also submitted to the registry.
References
iGEM Community. (2009). Team Cambridge 2009. [online] Available at: https://2009.igem.org/Team:Cambridge [Accessed 30 Oct. 2017].
deGFP
BioBricks used: BBa_K2205001 (New), BBa_K2205002 (New), BBa_K515105 (Imperial College London 2011)
Rationale and Aim
deGFP is a variant of Green Fluorescent Protein (GFP). It was initially designed by Shin and Noireaux (2010) for expression in cell-free protein synthesis (CFPS) systems and is more efficiently translated than other variants (e.g. eGFP). Through talks with other biosensor developers (for example, Chris French), and after reviewing legislation regarding the use of synthetic biology outside of the lab environment, the importance of CFPS systems as a chassis was highlighted. Despite its importance, CFPS systems can still suffer from some issues such as lower total protein synthesis than whole cells. By standardising and characterising a GFP variant which has been modified to have enhanced expression in these systems, it is hoped that CFPS will become a more attractive option for researchers. The aims for this section of the project were: (i) to standardise deGFP as a BioBrick and submit it to the iGEM repository, (ii) to demonstrate expression of deGFP in commercially available cell-free systems, and (iii) to characterise expression of deGFP in E. coli cells.
Background Information
deGFP is a modified variant of eGFP developed by Shin and Noireaux which is more efficiently translated in CFPS systems. It was designed by truncating the N-terminal sequence and introducing silent mutations which removed internal ribosome binding like sequences. The C-terminal sequence is also truncated as this has been shown to not be necessary for maximal fluorescence (Li et al. 1997). By removing ribosome binding like sequences, Shin and Noireaux have reduced the amount of incorrect ribosome binding events and hence increased translation efficiency. The length of the protein also contributes to enhanced translation efficiency by reducing the time and resources required for this process to reach completion.
Design Stage
The deGFP sequence was taken from the Addgene database (Plasmid #40019). The sequence was found to have no illegal restriction sites (i.e. no EcoRI, XbaI, SpeI, or PstI sites). A strong, standard Anderson promoter (J23100) and RBS (B0034) was added before the deGFP sequence with biobrick scar sites between each part. A double terminator (B0015) was added after the deGFP sequence. The entire construct was flanked by 30 bp overhangs with the pSB1C3 plasmid, such that the construct could be Gibson assembled into a plasmid digested with XbaI and SpeI. Extra bases were added between the overhangs and the construct so that once the part was assembled into the plasmid, the XbaI and SpeI sites could be regenerated and the biobrick prefix and suffix restored. This construct (J23100-deGFP) with the overhangs was submitted to IDT for synthesis as a gBlock.
Implementation
The J23100-deGFP construct (Figure 1) described above was Gibson assembled into a pSB1C3 plasmid using the NEB Hi-Fi assembly kit. To do this, pSB1C3 was digested with XbaI and SpeI to create a linearised plasmid backbone [LINK TO DIGEST PROTOCOL]. The deGFP gBlock DNA was prepared according to the IDT protocol [LINK HERE TO PROTOCOL] and assembled into the linear plasmid backbone according to the NEB Hi-Fi Protocol [LINK]. The assembly mixture was then transformed into commercial DH5α cells and incubated on chloramphenicol plates overnight [PROTOCOL LINK]. Colonies which were green under UV light were picked and grown in 5 mL LB broth overnight [PROTOCOL] before undergoing plasmid extraction [PROTOCOL]. DNA samples were then sent for sequencing to ensure that the construct was correct [DOWNLOAD LINK].

Figure 1: Top: SBOL Visual schematic of BBa_K2205002 (J23100-deGFP). Bottom: plasmid map for BBa_K2205002 in pSB1C3 plasmid backbone - generated by Benchling.
Characterisation
The expression of deGFP was first tested in E. coli cells using an experimental procedure similar to that used in the Interlab study. Cells transformed with pSB1C3-J23100-deGFP were grown in 10 mL LB broth overnight and OD600 nm was measured. Culture was added to 3 separate falcon tubes and made up to 12 mL with LB with chloramphenicol such that the starting OD600 of the culture was approximately 0.02. This set-up was repeated with cells containing an identical plasmid and construct, except sfGFP was in place of deGFP. As a control, untransformed cells were also prepared identically except the LB did not contain chloramphenicol. Tubes with only LB and LB+chloramphenicol were also prepared as blanks. The cultures were shake-incubated at 37oC. 300 μL samples from each tube were taken at time points of 15 mins, 2 hours, 4 hours, and 6 hours and stored at 4oC until the end of the experiment. 100 μL of each sample were then added to a 96-well plate. Fluorescence (excitation 485 nm, emission 510 nm) and absorbance (OD600 nm) were measured using a BMG-Labtech fluostar optima plate reader. Fluorescence intensity and grow rates for all three cell types were calculated over time (Figure 2). It was found that while cells expressing sfGFP had a much higher fluorescence intensity than cells expressing deGFP, the growth rate for cells with deGFP was closer to that of untransformed cells. This suggests that in vivo, either deGFP has lower expression than sfGFP, or each molecule of deGFP emits less fluorescence.

Figure 2: a) fluorescence intensity of E. coli cells overtime. Each bar represents an average of three repeats, and error bars represent +/- standard error. Fluorescence intensity was negative corrected to LB media. b) growth rate of E. coli cells over time. Each bar represents an average of three repeats, and error bars represent +/- standard error. OD¬600 was negative corrected to LB media. |

Figure 3: Visual fluorescence of E. coli cells under UV light. Image shows WT cells (left), cells expressing deGFP (middle), and cells expressing sfGFP (right). |
![]() The Exeter iGEM team aided us in characterising the deGFP using Fluorescence Activated Cell Sorting (FACS) to get single-cell data. The J23100-deGFP plasmid DNA (BBa_K2205002) was transformed into Top10 E. coli cells by the Exeter iGEM team. They then used a FACS machine to analyse the fluorescence of 10,000 cells in 2 cultures of wild types cells, and 5 cultures of Top10 cells expressing deGFP. We then analysed the data to determine that approximately ~50% of cells in the culture were fluorescent (Figure 4).
The Exeter iGEM team aided us in characterising the deGFP using Fluorescence Activated Cell Sorting (FACS) to get single-cell data. The J23100-deGFP plasmid DNA (BBa_K2205002) was transformed into Top10 E. coli cells by the Exeter iGEM team. They then used a FACS machine to analyse the fluorescence of 10,000 cells in 2 cultures of wild types cells, and 5 cultures of Top10 cells expressing deGFP. We then analysed the data to determine that approximately ~50% of cells in the culture were fluorescent (Figure 4).

Figure 4: Single cell data for E. coli cells expressing deGFP (collected by Exeter iGEM). Columns 1-6: cells expressing deGFP. Columns 7 and 8: wild type Top10 cells. Red parts of the bar are non-fluorescent cells, green parts are fluorescent cells.
Expression of deGFP in a cell-free protein synthesis (CFPS) system was then tested. Commercial S30 cell free kits for circular DNA from Promega were used so that results could be easily compared between labs. Reactions were prepared as described in the manufacturer’s protocol. Briefly, a master mix for 10 reactions was prepared (200 μL S30 premix, 150 μL S30 extract, 25 μL amino acid mix minus leucine, 25 μL amino acid mix minus cysteine) and 40 μL was added to nine tubes. To three tubes 1.2 μg J23100-deGFP was added, and J23100-sfGFP plasmid DNA was added to a further three. All reactions were then made up to 50 μL with nuclease-free water and transferred to a 96-well plate. Reactions were incubated in a BMG Labtech Fluostar Optima plate-reader at 37oC with fluorescence readings (excitation 485 nm, emission 510 nm) every 15 mins. It was found that, as expected, expression of the J23100-deGFP construct showed fluorescence above background level (Figure 5). It was also found that expression of the J23100-sfGFP construct in a CFPS system results in higher levels of fluorescence than deGFP. Therefore, although deGFP may show improved expression in CFPS systems than other GFP variants, sfGFP still shows higher fluorescence levels.

Figure 5: CFPS Expression of J23100-deGFP and J23100-sfGFP Constructs. Time course for increase in fluorescence intensity of CFPS systems expressing GFP constructs over time. Each data point is an average of triplicate results, and error bars show +/- standard error. CFPS system with no DNA (Red) was used as the negative control.
Conclusions and Future Work
We have successfully managed to BioBrick standardise deGFP for the first time, and have fully characterised this reporter, both in cells and in cell-free systems. As expected, this GFP variant showed fluorescence in both types of chassis. We also compared this GFP variant to superfolder GFP (sfGFP), which as far as we are aware has not been done before. We found that sfGFP had a higher fluoresence intensity in whole cells and CFPS systems compared to deGFP.
deGFP was engineered from the eGFP variant originally by removing RBS-like binding sites from the sequence, and truncating the sequence in an attempt to enhance translational efficiency. It may be possible in the future to engineer a better alternative to deGFP by using sfGFP as a starting point, rather than eGFP.
References
Text goes here.
Chromoproteins
BioBricks used: BBa_K2205016(New),BBa_K2205017(New),BBa_K2205018(New), BBa_K1033915(Uppsala 2013), BBa_K1033925 (Uppsala 2013), BBa_K1033929 (Uppsala 2013)
Rationale and Aim
The Sensynova multicellular biosensor platform has been developed to overcome the limitations identified by our team that hamper success in biosensor development. One of these limits regards the lack of modularity and reusability of the various components. Our platform design, based on the expression of three main modules (Detector, Processor and Reporter) by three E.coli strains in co-culture, allows the switch of possible variances for each module and the production of multiple customised biosensors. This section of the project is based on testing the modularity of the system by replacing the sfGFP output part of the Sensynova platform design with three different output chromoprotein variants; BBa_K1033929 (aeBlue), BBa_K1033925 (spisPink) and BBa_K1033915 (amajLime).
Background Information
All three selected chromoproteins were made and submitted to the iGEM registry by the Uppsala 2013 team. They were chosen as variants to the sfGFP present in the Sensynova platform as they exhibit of strong colour readily observed in both LB cultures and in agar plates when expressed. All three proteins have significant sequence homologies with proteins in the GFP family.
BBa_K1033915 – amajLime
The amajLime protein is a yellow-green chromoprotein extracted from the coral Anemonia majano. It was first extracted and characterized by Matz et al. under the name amFP486 (UniProtKB/Swiss-Prot: Q9U6Y6.1 GI: 56749103 GenBank: AF168421.1) and codon optimized for E coli by Genscript. The protein has an absorption maximum at 458 nm giving it a yellow-green colour visible to the naked eye.

BBa_K1033925 – spisPink
The spisPink protein is a pink chromoprotein extracted from the coral Stylophora pistillata. It was first extracted and characterized by Alieva et al. under the name spisCP (GenBank: ABB17971.1) and codon optimized for

BBa_K1033929 – aeBlue
The aeBlue protein is a blue chromoprotein extracted from the basal disk of a beadlet anemone Actinia equine. It was first extracted and characterized by Shkrob et al. 2005 under the name aeCP597 and codon optimised for E. coli by Bioneer Corp. The protein has an absorption maximum at 597nm and a deep blue colour visible to the naked eye. The protein aeBlue has significant sequence homologies with proteins in the GFP family. The coding sequence for this protein was originally submitted to the registry as BBa_K1033916 by the 2012 Uppsala iGEM team.

Design Stage
In order to implement these three chromoprotein variants into the Sensynova platform, designs were made by replacing the sfGFP in the original reporter module with the parts detailed above that were ordered from the iGEM parts registry.

Figure 1: SBOL Visual Detailing Reporter Variants
Using Benchling, virtual digestions of the three chromoproteins and ligations to the part K2205013, the connector 2 receiver module detailed above, were carried out resulting in the three plasmid maps detailed below; parts K2205016, K2205017 and K220518.


Figure 2, 3, and 4: Parts BBa_K2205016, BBa_K2205017 and BBa_K2205018 in PSB1C3 (Click for larger images)
Implementation
The chromoproteins aeBlue (BBa_K1033929), amajLime (BBa_K1033915) and spisPink (BBa_K1033925) parts were requested from the iGEM parts registry. Upon arrival, parts were transformed in DH5α E. coli cells [Protocol link]. Colonies were picked and overnight cultures were prepared for miniprepping [Protocol link]. Minipreps were digested [Protocol link] with XbaI and PstI for BioBrick assembly [Protocol link]. The part K2205013 contained in pSB1C3, was digested [Protocol link] using SpeI and PstI to allow for the insertion of the chromoproteins directly after the RhI controlled promoter (pRhI) that would trigger transcription of colour proteins in the presence of connector 2 of the Sensynova platform. Stared colonies picked from streaked plates and cultures were prepared for miniprepping [Protocol link]. DNA samples were then sent off for sequencing [Website link] to ensure that the constructs were correct.
Characterisation
Initial testing of these three chromoprotein reporter variants was conducted by inoculating 1ml of LB containing the antibiotic Chloramphenicol with a colony from each colour proven by colony PCR and sequencing data to be correct and grown at 37° for 2 hours as well as a control of wildtype DH5α.
Cultures were then plated onto a LB agar + Chloramphenicol plate which were then innoculated in four locations with 10μl of connector 2 (C12 - Rhl) and grown overnight resulting in the picture below.

Figure 5: Initial Testing of Chromoprotein Reporter Variants
There is a visible vibrant colour change present for both the spisPink and the aeBlue chromoprotein variants however, as the colour of the amajLime is very similar to the wildtype colour, both in cultures, pelleted and plated, the colour is difficulty distinguished. For this reason, it was decided to carry forward the two brightest chromoproteins for further testing while optimising amajLime separately. In order to test these two chromoproteins reporter variants into the Sensynova framework, cultures of IPTG detector, processor unit and three reporter modules, two chromopreteins and the sfGFP control, were inoculated and grown overnight in LB+chloramphenicol (12,5ng/μl). The cultures were then diluted at OD600: 0,1 and mixed together to obtain co-cultures with ratio 1:1:1 and 1:1:13. Some samples were supplemented with 1mM IPTG to induce the expression of quorum sensing molecules and eventually achieve the chromoproteins visualisation (Figures 6, 7, 8).

Figure 6: Pellets collected after overnight co-cultures of IPTG detector (BBa_K2205009) + processor (BBa_K2205012) + Pink Chromoprotein reporter (BBa_K2205018) in ratios 1:1:1 and 1:1:13, with and without 1mM IPTG. |

Figure 7: Pellets collected after overnight co-cultures of IPTG detector (BBa_K2205009) + processor (BBa_K2205012) + Blue Chromoprotein reporter (BBa_K2205016) in ratios 1:1:1 and 1:1:13, with and without 1mM IPTG. |

Figure 8: Pellets collected after overnight co-cultures of IPTG detector (BBa_K2205009) + processor (BBa_K2205012) + sfGFP reporter (BBa_K2205015) in ratios 1:1:1 and 1:1:13, with and without 1mM IPTG. |
The three experiment sets clearly demonstrate that the framework is optimised when a higher concentration of cells expressing the reporter device is present (Figures 6, 7, 8, samples labelled 1:1:13). Although a background signal is visible in the systems expressing the pink (BBa_K2205018) and the sfGPF (BBa_K2205015) reporters, the blue reporter (BBa_K2205016) due to its lowest background level, constitutes the most suitable reporter module for the Sensynova platform when customised as IPTG biosensor.
Conclusions and Future Work
The qualitative results detailed above highlight the crucial advantage of our multicellular, modular framework, as it enables each component to be optimised avoiding any extra cloning steps. As each biosensor may be different and require specific designs and optimisation, easily choosing and changing modules and predicting in silico the bacterial community behaviour is essential for the development of new biosensors.
References
Alieva, N., Konzen, K., Field, S., Meleshkevitch, E., Hunt, M., Beltran-Ramirez, V., Miller, D., Wiedenmann, J., Salih, A. and Matz, M. (2008). Diversity and Evolution of Coral Fluorescent Proteins. PLoS ONE, 3(7), p.e2680. iGEM Community. (2013). Team Uppsala 2013. [online] Available at: https://2013.igem.org/Team:Uppsala [Accessed 30 Oct. 2017]. Matz, M., Fradkov, A., Labas, Y., Savitsky, A., Zaraisky, A., Markelov, M. and Lukyanov, S. (1999). Nature Biotechnology, 17(10), pp.969-973. Shkrob, M., Yanushevich, Y., Chudakov, D., Gurskaya, N., Labas, Y., Poponov, S., Mudrik, N., Lukyanov, S. and Lukyanov, K. (2005). Far-red fluorescent proteins evolved from a blue chromoprotein fromActinia equina. Biochemical Journal, 392(3), pp.649-654.
Sensynova Framework Testing (IPTG Sensor): The Results
BioBricks used: BBa_K2205009(New), BBa_K2205012(New), BBa_K2205015(New), BBa_K2205016(New) and BBa_K2205018(New).
Rationale and Aim
Motivation: Biosensors, synthetic systems designed to detect and respond to a target analyte, are a common application of synthetic biology. However, the production and screening of multiple biosensor system variants is hindered by the inefficiency and specificity of the gene assembly techniques used. The production of circuit variants is important in biosensor production, as sensitivity to target molecules must be tuned. Aim: To develop a multicellular biosensor development platform which utilises cell-mixing, as opposed to genetic re-engineering, to construct biosensor variants.
Background Information
Human Practices Quotes:
Biosensor Development. When developing biosensors, it would be useful to test multiple variants of a circuit. This is especially important in the fine-tuning of biosensor behaviour as this requires the screening of many variants to find appropriate activation thresholds for a system. Apart from the initial detection unit, many constructs used in synthetic biology based biosensors are reusable between different biosensor systems, such as fluorescent protein coding sequences or devices which amplify signals. However, these parts rarely get reused. For example, the Cambridge iGEM team (2009) developed a library of sensitivity tuners which were able to convert polymerase per second inputs to a desired polymerase per second output, allowing a biosensor developer control over the sensitivity of their systems to various target analyte concentrations. This project was impressive enough to win the competition. However, despite the parts' clear usefulness, there is no documentation that the parts have ever been successfully reused within the iGEM competition. We suggest that this is due to the difficulties in assembling biosensors systems – the screening of a library of sensitivity tuners would require the ability to easily generate multiple sensor circuits. Although only one part would be changing in each circuit variant, current genetic engineering techniques mean that parts are tightly coupled together, preventing the simple swapping of parts.
Therefore, we propose a modular, multicellular system for biosensor development, using a cell-to-cell communication system to eradicate the requirement for further genetic engineering of reusable biosensor devices (Figure 1).


Figure 1: Multicellular Sensynova system.
Cell-to-Cell communication
Bacteria have native quorum sensing systems which enable cell-to-cell communication through the production and detection of hormone-like auto-inducers. These molecules allow the synchronisation of behaviour in large populations of bacterial cells (Waters & Bassler, 2005). One such system involves the autoinducer AHL (Acylated Homoserine Lactone). AHLs compose of a lactone ring with an acyl side chain containing between 4 and 18 carbons (Churchill & Chen, 2011). Various AHL synthases exist, which produce AHL with different modifications and side change lengths. AHL receptors are sensitive to AHLs of specific length. For example, it has been found that the Rhl system, producing and detecting AHL of acyl carbon length 4 and the Las system, producing and detecting AHL of acyl carbon length 12, exhibit little crosstalk – the receptor component of the system is sensitive only to carbon chains of the correct length (Brenner et al., 2007). The orthogonal nature of the AHL family of autoinducers has enabled their use in a variety of synthetic systems. They are often used as biological “wires”, linking either inter- or intracellular processes. These “wires” have been previously used in a number of synthetic biology systems, e.g. Gupta et al. (2013) and Tasmir et al. (2011).
In this project, it is proposed that modularity, and therefore the ability to use parts “off-the-shelf” without further genetic engineering, could be improved by splitting components of biosensors into different cells which communicate to coordinate responses. The orthogonal quorum sensing systems Rhl and Las will be used as biological “wires”, linking different biosensor components together. This separation of components will enable the decoupling of non-specific components from specific detection systems. Using this approach, production of biosensor variants will not require subsequent engineering steps: cells containing desired components will simply be mixed together (Figure 2).

Figure 2: Modular and multicellular Sensynova framework design.
The splitting of biosensor components into separate cells may have additional advantages besides ease of variant production. Goni-Moreno et al. (2011) have previously suggested that the use of synthetic quorum sensing circuits enables each cell to be considered an independent logic gate, which may rectify the “fuzzy logic” seen in some biosensors, where stochastic cellular processes may produce false positive results. Quorum sensing has also been previously used to synchronise gene expressions, leading to reduced variability within a population (Danino et al., 2010).
Preliminary Experiment
In order to support our theory that genetic assembly is the rate limiting step in biosensor development, we attempted to assemble a simple GFP producing system using three engineering techniques: BioBrick, Gibson and Golden Gate. Further information about this experiment can be found on our interlab page . Gibson was the only successful technique we trailed, however, Gibson assembly is not an ideal method for circuit variant production due the the specificity of the overlapping regions: For example, to assemble ten genetic parts into all possible orders would require the use of 90 different overlapping sequences (Ellis et al., 2011). Therefore, the ability to generate circuit variants without the need for further genetic engineering would be useful.
Design Stage
To modularise biosensor components, it was necessary to first confirm which devices types are commonly found in biosensors. An in depth systematic review was conducted to determine these components. Team seeker, a tool for keyword searches of iGEM team titles and abstracts for the years 2008 to 2016, was used to identify biosensor based projects (Aalto-Helsinki iGEM team, 2014). The search terms used to identify potentially relevant projects were “sense” and “biosensor”. 121 projects were identified by these search terms. In projects including multiple sensors, the most well characterised sensors were used for this review. Sensor designs, rather than constructed biosensors, were used for analysis, as time constraints in iGEM often prevents project completion.
Ten projects were unable to be reviewed because their wiki was broken. Of the remaining 111 projects, 18 projects were deemed not eligible for further analysis. This was either due to a lack of information regarding biosensor mechanism provided by the team or their project was irrelevant. 3 projects were excluded as the sensing component of their project was unchanged from a previous project, to prevent the overrepresentation of biosensors in our database. Therefore, a total of 93 biosensors were used for analysis in our systematic review (Figure 3 and table 1). The systematic review revealed that all biosensors could be split into four components:
1)Detector: The part responsible for detection of the target molecules. For example, riboswitches and transcription factors.
2)Processing: Adds downstream processing to a signal, which enables response turning. For example, logic gates, signal amplification and sensitivity tuning.
3)Reporter or output: Produces a response to the target. For example, fluorescent proteins and beta-galactosidase. Additionally, some biosensors may produce outputs which interact with the target molecule once it has been sensed, such as the production of degradation enzymes in bioremediation projects. We have termed these outputs as “effectors”.
4)Adaptors: If the molecule is hard to detect, adaptor components can be placed before the detector unit, to convert the target molecules to something able to be sensed by the detector component. For example, for target that degrades into an easily detectable molecule, a biochemical conversion adaptor could be placed before the detector component which enzymatically degrades the target molecule into the molecule detected by the detector module.

Figure 3: Frequency of projects based on biosensors development in iGEM.
Table 1: Percentages of biosensors components used in iGEM.

We propose that splitting these modular biosensor components into different cells, as shown below, and co-culturing the cells together, will greatly reduce the complexity of biosensor circuit development.
Implementation
To prove that our concept of splitting biosensors across multiple cells would work, we designed an IPTG sensor. The design of this system can be found in Figure 4. In this system, LacI is constitutively expressed in the detector cell and represses the production of LasI. When IPTG is added, it binds LacI, preventing repression. Therefore, in the presence of IPTG, LasI will produce C12, our first connector molecule. To determine that our system would work, it was first tested in silico. Details on the model of this system can be found on our Modelling page.

Figure 4: Sensynova framework design used for sensing IPTG.
Parts were synthesised by IDT and integration into the pSB1C3 plasmid confirmed by colony PCR and subsequent sequencing. Red boxes show parts later used for biobrick production (Figure 5).

Figure 5: Colony PCR confirming the correct integration of the biosensor fragments into the vector.
Characterisation
The Framework characterisation has been performed using a BMG-Labtech fluostar optima plate reader in order to monitor the absorbance (OD600 nm) and GFP fluorescence (excitation 485 nm, emission 510 nm).
The 3 cultures (IPTG detector, processor and sfGFP reporter) were grown separately in LB+ chloramphenicol on a shaker at 37C. After the overnight incubation the cultures were diluted to OD600 0.1 in order to achieve the syncronised growth to reach the late exponential phase. At OD 600 between 0.5 and 0.7 the cultures were mixed in ratio1:1:1 and IPTG 1mM was added. To test the functionality of the processor and the output, tests with the specific quorum sensing molecules were performed as followed:
Reporter test. The culture carrying the reporter device BBa_K2205015 was also tested individually after induction with the connector C12-RHL 2 ug/ul as shown in the graph (figure6).


Figure 6: The reporter part BBa_K2205015 test shows a significant fluorescence increase after induction with the connecting molecule 2 C12-RHL.
Processor test. The connector 1 (C4-HSL) was added to the co-culture consisting of processor BBa_K2205012 + reporter BBa_K2205015 in ratio 1:1. The plot shows the successful communication via quorum sensing in the Sensynova device. It is clear that the presence of 1mM C4-HSL is detected by the processor cells which produce the connector 2 (C12-RHL) for the reporter cells to detect. This induction in the reporter cells leads to the expression of sfGFP (Figure 7).


Figure 7: The processor BBa_K2205012 and reporter BBa_K2205015 co-culture test shows increasing fluorescence/time after specific induction with the connecting molecule C12-RHL.
Framework test. The co-culture of the 3 cell types was inoculated at ratio 1:1:1 (detectors:processors:reporters), growth and fluorescence were monitored after induction with IPTG 1mM. The plot shows no significant increasing fluorescence in the induced samples (Figure 8).


Figure 8: Framework (BBa_K2205009 , BBa_K2205012 , BBa_K2205015 ) test with a co-culture in ratio 1:1:1 in response of IPTG induction.
Results from the multicellular modelling predicted that the traditionally used 1:1:1 ratio is not the optimal combination for the Sensynova device to work. It is in fact suggested to adopt a higher concentration of the reporter culture compare with the detector and processor. Thus, the framework test was repeated incorporating our in silico simulation data and combining the 3 cell types in ratio 1:1:13 (detectors:processors:reporters). The experiment results, shown in the picture below, confirm the modelling data. There is a consistent discrepancy between IPTG induced and non-induced samples in the 1:1:13 co-cultures, in comparison with the 1:1:1 co-cultures which don't show any difference in presence or absence of IPTG (figure9).


Figure 9: Framework (BBa_K2205009 , BBa_K2205012 , BBa_K2205015 ) test with a co-culture in ratio 1:1:13 in response of IPTG induction.
The experimental data validate the model prediction showing that the system worked most optimally when the reporter cells were in excess of both the detector and processor cells. One of the reasons that this configuration was the best may be because of signal amplification at each of the quorum sensing communication stages. The quorum sensing mechanism used here is the acyl homoserine lactone (AHL) system in gram negative bacteria. This system works by one cell producing a quorum sensing molecule which can diffuse out through its membrane. Once the extracellular space reaches a certain threshold concentration of AHL molecule, the AHL will begin to diffuse into other cells in the community. If the cell the AHL molecule enters has the appropriate transcription factor present (e.g. LasR for the C12 AHL), then transcription of a gene under the control of the pLas promoter can occur. Therefore, if background expression of the AHL is high enough to reach above the threshold level, then expression of the next quorum sensing molecule in another cell (in this case C4 AHL) will occur. By reducing the amount of detector and processor cells present in the system, the background expression levels of C12 and C4 will be lower, and hence expression of sfGFP by the reporter cell will be lower.
Qualitative test with chromoproteins expression. In order to check the performance of the Sensynova device in terms of modularity, cultures of IPTG detector, processor unit and 3 different reporter modules carrying 2 chromoproteins (Chromoproteins link)(BBa_K2205016, BBa_K2205018)and sfGFP(BBa_K2205015) were inoculated and grown overnight in LB+chloramphenicol(12,5ng/ul). The day after the cultures were diluted at OD600: 0,1 and mixed together to obtain co-cultures with ratio 1:1:1 and 1:1:13. Some samples were supplemented with 1mM IPTG to induce the expression of quorum sensing molecules and eventually achieve the chromoproteins visualisation (Figures 10, 11, 12).
|
Figure 10: Pellets collected after overnight co-cultures of IPTG detector((BBa_K2205009) + processor(BBa_K2205012) + Pink Chromoprotein reporter(BBa_K2205018)in ratios 1:1:1 and 1:1:13, with and without 1mM IPTG. |
Figure 11: Pellets collected after overnight co-cultures of IPTG detector((BBa_K2205009) + processor(BBa_K2205012) + Blue Chromoprotein reporter( BBa_K2205016) in ratios 1:1:1 and 1:1:13, with and without 1mM IPTG. |
Figure 12: Pellets collected after overnight co-cultures of IPTG detector(BBa_K2205009) + processor(BBa_K2205012) + sfGFP reporter(BBa_K2205015)in ratios 1:1:1 and 1:1:13, with and without 1mM IPTG. |
The 3 experiment sets clearly show that the framework is optimised when a higher concentration of cells expressing the reporter device is present (Figures 10, 11, 12, samples labelled 1:1:13). This can be considered as a further validation of our fine-tuning approach using the simbiotics model and the previous plate reader experiments. Although a background signal is visible in the systems expressing the pink (BBa_K2205018)and the sfGPF(BBa_K2205015) reporters, the blue reporter (BBa_K2205016) due to its lowest background level, constitutes the most suitable reporter module for the Sensynova platform customised as IPTG biosensor. This highlights a crucial advantage of our multicellular, modular framework, which enables each component to be optimised avoiding any extra cloning steps. As each biosensor may be different and require specific designs and optimisation, easily choosing and changing modules and predicting in silico the bacterial community behavior is essential for the development of new biosensors.
Conclusions and Future Work
In conclusion, through a comprehensive systematic review a design pattern of four components was identified for synthetic biology biosensors. The components are detection and output devices, with optional processing and adaptor units. Based on this design pattern, a multicellular biosensor development platform was designed in which biosensor components were split between cells and linked by intercellular connectors. ADD CONCLUSION OF LAB WORK Modularisation of biosensor components is ensured by the reusability of parts due to these compatible connectors. The production and detection of signalling molecules has been standardised across cells: Detector cells will produce C12 AHL, processing cells will detect C12 AHL and produce C4 AHL, and output cells will detect C4 AHL. Therefore, as long as constructs include the correct connectors, they are compatible will all other devices, without any further engineering of the system. This creates a “plug-and-play” approach to developing biosensors and allows the rapid construction of many biosensor circuit, which can be fine-tuned using only cell-mixing. The splitting of biosensor components between different cells enables the top-down design of biosensing systems. In the top-down approach, systems are designed at a whole system level without consideration of the smaller subsystems required to generate a behaviour, as opposed to a bottom-up approach, where design begins with the smallest parts required to make a system and behaviour is built-up using the knowledge of these smaller parts. Using our platform with sub-systems of a known function already pieced together within cell, it is possible to simply add a cell to generate desired behaviour instead of having to consider the underlying biological parts. Top-down design will enable a more interdisciplinary approach to biosensor development, as knowledge of underlying biological behaviour is no longer required, and will generate biosensors better suited to their intended functions, as the design process will begin with consideration of end-user specifications, as opposed to discrete biological parts.
The next step
Another advantage to the bypassing of gene assembly enabled by our platform is the increased ability to automate system construction. Microfludic systems are those which control the movement of small volumes of liquids (10–9 to 10–18 litres) using a variety of methods, which may be used to perform biological experiments. These devices have a number of advantages over traditional, manual, lab methods. They only use a small amount of liquid, which means less reagents are consumed and the time taken to perform experiments is reduced. These small amounts of liquids are easier to manipulate than larger volumes, meaning there is greater control over reactions resulting in a high degree of sensitivity (Whitesides, 2006). However, many devices do not have the ability to control temperature, which is important for many methods of gene assembly. Cell mixing, as opposed to gene fragment assembly, is more suited to automation on these platforms, as there is no requirement for precise temperature control. Also, the increased control over small volumes of reagents allows the screening of precise cell ratios. Additionally, programs are in development for the automation of protocols on microfluidic, which will allow the rapid combination of a number of variant biosensor components. To utilise this advantage, we conducted a number of experiments using liquid handling robots (LINK TO ROBOTICS PAGE) and developed software for the simulation of microfludics experiments
References
Aalto-Helsinki iGEM team (2014) Team Seeker [online] Available at: http://igem-qsf.github.io/iGEM-Team-Seeker/dist/ [Accessed 11/07/17] Brenner, K., Karing, D., Weiss, R. & Arnold, F. (2007) Engineered bidirectional communication mediates a consensus in a microbial biofilm consortium Proc Natl Acad Sci U S A 104(44): 17300 - 17304 Cambridge iGEM team (2009) Sensitivity Tuners [online] Available at: https://2009.igem.org/Team:Cambridge/Project/Amplification [Accessed 28/08/2017] Churchill, M. & Chen, L. (2011) Structural Basis of Acyl-homoserine Lactone-Dependent Signaling Chemical Reviews 111 (1): 68 - 85 Danino, T., Mondragon-Palomino, O., Tsimring, L. & Hasty, J. (2010) A synchronized quorum of genetic clocks Nature 463: 326 - 330 Ellis, T., Adie, T. & Baldwin, G. (2011) DNA assembly for synthetic biology: from parts to pathways and beyond Integrative Biology 3: 109 – 118 Goni-Moreno, A., Redondo, M., Arroyo, F. & Castellanos, J. (2011) Biocircuit design through engineering bacterial logic gates Natural Computing 10: 119 – 127 Gupta, S., Bram, E. & Weiss, R. (2013) Genetically programmable pathogen sense and destroy ACS Synthetic Biology 2 (12): 715 - 723 Tasmir, A., Tabor, J. & Voigt, C. (2011) Robust multicellular computing using genetically encoded NOR gates and chemical ‘wires’ Nature 469 (7329): 212 - 215 Waters, C. & Bassler, B. (2005) Quorum Sensing: Cell-to-cell communication in Bacteria Annual Review of Cell and Development Biology 21: 319 - 346 Yee Gyung Kwak, George A. Jacoby and David C. Hoopera. (2013) Induction of Plasmid-Carried qnrS1 in Escherichia coli by Naturally Occurring Quinolones and Quorum-Sensing Signal Molecules
Cell Free Protein Synthesis System Optimisation: The Results
BioBricks used: BBa_K515105 (Imperial College London 2011)

Cell Free Protein Synthesis Premix Supplements: Diagrammatic overview of CFPS supplement roles in transcription and translation.
Rationale and Aim
Cell free protein synthesis (CFPS) systems have large potential as alternative chassis for applications such biosensors or diagnostic tests. This is because generally, biosensors are needed to function outside of the laboratory environment. Whole cells, which are traditionally used as chassis, can be problematic in these scenarios due to issues with containment and release of genetically modified organisms. While CFPS systems are promising alternatives to whole cells, there are currently some drawbacks, primarily their cost and variability between batches of cell extract. To address these issues, this part of the project had the following aims: (i) develop a functional CFPS system, (ii) demonstrate the usefulness of a Design of Experiments (DoE) approach towards identifying which supplements are the most crucial for maximal CFPS activity, and (iii) demonstrate how DoE can be used to optimise each batch of cell extract for maximal CFPS activity.
Background Information
Cell Free Protein Synthesis Systems
Cell free protein synthesis (CFPS) systems are capable of performing transcription and translation of exogenous DNA in vitro. CFPS systems have been in use for many decades (Nirenberg & Matthaei, 1961), however the field of synthetic biology has resulted in a CFPS renaissance (Lu, 2017; Lee & Kim, 2013). Commonly, CFPS systems are based on cell extracts, which provide the transcription/translation machinery, as well as enzymes required to generate ATP required for protein synthesis. While CFPS systems have a lot of potential, they also suffer from some drawbacks. Two of the major issues are the large variation in CFPS activity between cell extracts (Katsura, et al., 2017), and the high costs compared to whole cells (although cost have been reduced significantly in the past decade) (Carlson, et al., 2012). These issues can hinder the uptake of CFPS systems as an alternative chassis to whole cells, and as research tools.
Show/hide more information about the CFPS premix
Cells extracts being used in CFPS systems tend to be supplemented with a cocktail of compounds and molecules to aid the process of transcription and translation. Although exact supplement solutions can vary from protocol to protocol, most have the same basic composition; salts, nucleotides, tRNAs, co-factors, energy sources, and amino acids (Yang, et al., 2012). The supplement solution used in this study is based on the Cytomin system (figure 1.2.1) (Jewett, et al., 2008). For the cytomin supplement solution, the major energy source is sodium pyruvate, which is converted to acetate through a series of reactions catalysed by enzymes in the crude cell extract (Figure 1.2.2). The first reaction, pyruvate to acetyl-CoA, requires nicotinamide diphosphate (NAD) and Co-enzyme A (CoA) as co-factors. Both of these are components of the premix and hence added to the system to enhance flux through the reaction. The acetyl CoA is phosphorylated by inorganic phosphate, and then de-phosphorylated to produce ATP from ADP. The ATP is used as energy to drive translation of mRNA. Energy can also be derived from glutamate in the supplement solution (Jewett, et al., 2008), which is added in the form of magnesium glutamate and potassium glutamate. Glutamate is a metabolite in the tricarboxylic acid cycle, which generates NADH. In whole cells, NADH is used in oxidative phosphorylation to produce ATP. Oxidative phosphorylation relies on membrane bound proteins and proton gradients across a membrane. It has been shown previously that extracts prepared using French Press or sonication contain membrane vesicles which have ATPase activity (Futai, 1974), and that oxidative phosphorylation can be activated in CFPS systems (Jewett, et al., 2008). Sodium oxalate, another component of the supplement solution, is also used to help increase energy generation by the system. PEP synthetase, an enzyme present in E. coli, converts pyruvate into phosphoenol pyruvate (PEP) in a reaction which consumes ATP, thereby wasting ATP and directing it away from protein synthesis. Oxalate inhibits PEP synthetase by acting as a pyruvate mimic, and hence limit the energy wasted by this reaction. The ribonucleotides ATP, GTP, UTP, and CTP are also components of the supplement solution. They are used in the synthesis of mRNA for transcription of desired genes encoding on exogenous DNA added to the system, and ATP can also be used directly as energy for translation. The polyamines spermidine and putrescine are two other supplements which are added to aid with transcription. It is thought that they can bind proteins and DNA to help recruit polymerase for transcription. Polyamines may also increase translation fidelity, aid ribosome assembly, and activate tRNAs (Jelenc & Kurland, 1979; Jewett & Swartz, 2004b; Algranati & Goldemberg, 1977). To enable translation to occur, amino acids (added separately from the supplement solution) and an E. coli tRNA mixture are added to the CFPS system. Folinic acid is also added as it can be used as a source of folinate for the synthesis of f-Met; the amino acid required for initiation of translation in E. coli. Magnesium and potassium ions are also added as supplements. Both ions are ubiquitous in cells with many functions in protein synthesis, namely aiding translation by associating with ribosome subunits and stabilising RNA (Nierhaus, 2014; Pyle, 2002). While magnesium ions are essential for protein synthesis, at high concentrations they can cause inhibition of ribosome translocation and hence inhibit protein synthesis (Borg & Ehrenberg, 2015).
Previous research has shown that the concentration of some components of the supplement solution are crucial for efficient protein synthesis, and that for each batch of extract produced the optimal concentration may need to be found (Yang, et al., 2012). Studies which have explored this have only focused on, at most, a few components at a time (Garamella, et al., 2016; Kelwick, et al., 2016), which means that important interactions between the components may have been missed.
Multifactorial Design of Experiments
Traditionally, biologists tend to use One Factor At a Time (OFAT) approaches to determine the effect and importance of factors on a system. This method can sometimes be a poor choice. By only determining the effect that a single factor has on a system at a time, important interactions can be missed. For example, removing only factor A may have no effect, and removing only factor B may also have no effect, but removing both may cause an adverse effect. Therefore, it is important to take a multifactorial approach when investigating the importance of conditions or components of a system, or when trying to optimise a system. An issue with this approach is that a large number of experiments may be required to fully investigate all factors. By using statistical methods, a Design of Experiments (DoE) can be determined which has the minimum number of experiments required to explore questions such as the importance of factors in a system. This approach also allows for robustness testing or determining batch-batch variation (Anderson & Whitcomb, 2010). As mentioned previously, CFPS systems can be plagued with issues rising from variation, so this approach offers a method to investigate the causes. There are several different types of DoE designs. One of these is the screening design (SD), which is used to create experimental designs to determine the factors with the highest effect on a system. Another design is the surface response design (SRD), which makes experimental designs to collect data for generating models which can predict optimal settings for many factors (SAS Institute Inc., 2016). Software tools, such as JMP (SAS Institute Inc., 2016), have been developed to create these experimental designs.
Implementation
Cell free extract preparation procedures were based on methods reported in literature previously (Kwon & Jewett, 2015). Cell free extracts were prepared from Escherichia coli BL21 and Bacillus subtilis 168. Cells were streak plated out from glycerol stocks on LB agar (15 mg/mL agar, 10 mg/mL tryptone, 5 mg/mL yeast extract, 0.17 M sodium chloride) and incubated overnight at 37oC. A single colony was used to inoculate 10 mL LB broth (10 mg mL-1 tryptone, 5 mg mL-1 yeast extract, 0.17 M sodium chloride) before shake-incubation at 37oC for approximately 16 hours overnight. 2 mL of overnight liquid culture was used to inoculate 200 mL LB broth in a 2 L flask and shake-incubated at 37oC until late exponential phase was reached (OD600 nm of approximately 2.5 for E. coli BL21 cells). The culture was split in half and cells were harvested by centrifugation at 4,500 RPM and 4oC for 20 minutes in pre-weighed falcon tubes. The wet cell pellet weight was determined before storage at -20oC. Cells were defrosted on ice for approximately 1.5 hours and resuspended in approximately 10 mL of ice-cold CFPS wash buffer (60 mM potassium glutamate, 14 mM magnesium glutamate, 10 mM TRIS (pH 8.2 with acetic acid); autoclave sterilised; supplemented with 2 mM DTT immediately before use) per gram of wet cell pellet. Resuspended cells were centrifuged at 4,500 RPM and 4oC for 20 mins. The supernatant was discarded and cell pellets were resuspended and centrifuged in CFPS wash buffer twice more. The washed pellets were then resuspended in 1 mL CFPS wash buffer per gram of wet cell pellet and aliquoted to 1 mL in 2 mL tubes. Cells were lysed by sonication (20% amplitude, cycles of 40 seconds on – 59.9 seconds off, 432.5 Joules) and the lysates were clarified by centrifugation at 12,000 RPM for 10 mins, flash frozen in liquid nitrogen, and stored at -80oC. A CFPS supplement solution was prepared based on previously reported protocols (Yang, et al., 2012). Amino acid stock solutions were prepared according to Table 1. Briefly, amino acids were weighed in 2 mL tubes, dissolved in 5 M potassium hydroxide, and stored at -20oC. A 10x amino acid solution was prepared by mixing the stock solutions together in amounts according to Table 1, and the pH was adjusted to 7.9 with acetic acid. The solution was aliquoted to 1.5 mL and stored at -80oC.
Table 1: Concentrations for amino acid stock solutions (first column), 10x amino acid mix (second column), and for each CFPS system (third column).

The following solutions were prepared in autoclave sterilised MiliQ water and stored at -80oC: 100x magnesium glutamate solution (1.2 M magnesium glutamate), 10x salt solution (1.3 M potassium glutamate, 40 mM sodium oxalate, 10 mM ammonium acetate), 25x NTPS & co-factor mix (37.5 mM spermidine, 30 mM ATP, 21.25 mM GTP, UTP, and CTP, 25 mM putrescine, 8.25 mM nicotinamide diphosphate, 4.25 mg mL-1 E. coli tRNA (Roche), 0.85 mg mL-1 folinic acid, N xX co-enzyme A), 25x sodium pyruvate solution (825 mM sodium pyruvate, pH to 7.3 with potassium hydroxide), unless stated otherwise. A 5x CFPS supplement solution premix (5% v/v nuclease free water, 5% v/v magnesium glutamate solution, 50% v/v salt solution, 20% v/v NTPS & co-factor mix, 20% v/v sodium pyruvate solution, unless stated otherwise) was prepared and stored at -80oC. CFPS activity of systems prepared as above were tested by expression of 1.7 μg pSB1C3-J23100-sfGFP (Figure 1). Firstly, enough CFPS master mix was prepared for 7 reactions by mixing 112 μL cell extract, 70 μL CFPS supplement premix, and 21 μL amino acid solution in a 1.5 mL tube and stored on ice. A further six 1.5 mL tubes were put on ice; 21 μL of nuclease free water was added to three tubes, and 1.7 μg pSB1C3-J23100-sfGFP plasmid DNA from the same stock solution was added to the remaining three. Tubes containing DNA were made up to 21 μL with nuclease-free water. CFPS master mix (29 μL) was then added to all tubes, which were vortexed and transferred to a 96-well plate. The plate was incubated in a BMG Labtech Fluostar Optima at 370C for 4.25 hours with fluorescence readings (excitation: 485 nm, emission: 510 nm) every 15 mins. Figure 2 shows that over time, fluorescence intensity increased in systems with DNA encoding for sfGFP compared to systems with no DNA. Hence, the system had CFPS activity.

Figure 1: Plasmid map for pSB1C3-sfGFP. Construct is standard biobrick part BBa_ K515105. |

Figure 2: Negative corrected fluorescence for E. coli BL21 extract-based CFPS systems. Each data point is an average of 3 replicate reactions, and error bars represent +/- standard error. |
Design Stage 1
Previous research has shown that the concentration of certain salts in the CFPS supplement premix are crucial for maximal protein synthesis activity [REF]. A Design of Experiments approach was used to determine which of the four salts (magnesium glutamate, potassium glutamate, sodium oxalate, and ammonium acetate) are the most important using the JMP software. A classical screening design was created with all four salts as continuous factors and CFPS activity as the response to be maximised. A concentration of ‘0’ was used as the lower limit for each factor, and the concentration used normally in CFPS supplement premixes was used as the upper limit. The main effects screening design was then used to generate the experimental design.
Table 2: Table of reactions performed according to the DoE salt supplement screening design. CFPS reactions contained concentrations of each salt supplement according to the table above. The pattern column shows whether a salt was present (✔) or absent (X) from the system.

Experimental Procedure 1
Cell extracts were prepared from E. coli BL21 cells using sonication. A CFPS supplement premix solution was prepared as above, except the salts were omitted. Separate solutions for each salt were prepared and added to each CFPS reaction according to the main effects screening design. Reactions were performed as above and CFPS activity was measured as fluorescence at each time point minus fluorescence at 15 mins (Figure 3). Endpoint data was then used, along with the JMP software, to build a model predicting the important factors (Figure 4).

Figure 3: CFPS activity of CFPS reactions with salt concentrations according to the main effects screening design (table 2) was determined as fluorescence intensity at each time point minus fluorescence intensity at the 15 minute time point. Reaction IDs are described in table 2. |

Figure 4: Screening model constructed using JMP showing which factors were closest to significance. Predictions for interactions are unreliable due to forced orthogonality (*). Of the primary factors, magnesium glutamate is the closest to significant, followed by potassium glutamate, sodium oxalate, and ammonium acetate in that order. |
Design Stage 2

Figure 5: Comparison of four surface response designs generated by the JMP software using the compare designs feature. From top to bottom: design type, number of reactions required by the design, colour map on correlations, Power analysis of terms, efficiencies, and average prediction variance. For the colour map on correlations, red is highly correlated and blue is highly un-correlated.
The three salts which the screening design determined as being the most important (magnesium glutamate, potassium glutamate, and sodium oxalate) were analysed further. A surface response design was used to help determine optimal concentrations for each salt in the CFPS supplement premix solution. The JMP software was used to create a classical surface response design for magnesium glutamate, potassium glutamate, and sodium oxalate. Each factor was given a lower limit of 0.5 times their ‘normal’ concentration, and an upper limit of 1.5 times their ‘normal’ concentration. Four types of surface response designs were constructed and compared (Figure 5 - see our modelling page for more information). Ultimately the central composite design – orthogonal was chosen. The list of experiments determined by this design are shown in Table 3.
Table 3: Table of reactions performed according to the DoE salt supplement surface response design. CFPS reactions contained concentrations of magnesium glutamate, potassium glutamate, and sodium oxalate, according to the table above. The pattern column shows how much of each supplement was present in a reaction; very low concentration (a), low concentration (−), usual concentration (0), high concentration (+), and very high concentration (A).

Experimental Procedure 2
Cell extracts were prepared and CFPS reactions performed as before, except the magnesium glutamate, potassium glutamate, and sodium oxalate concentrations were according to the surface response experimental design. Ammonium acetate was kept at the default amount. CFPS activity was measured as fluorescence at each time point minus fluorescence at 15 mins (Figure 6). Endpoint data was then used, along with the JMP software, to build a model predicting optimal concentrations for the three salts analysed (predictions visualised in figure 7). These predictions were then tested by preparing a supplement solution premix with amounts of magnesium glutamate, potassium glutamate, and sodium oxalate at concentrations of 6 mM, 195 mM, and 2 mM respectively. This supplement solution premix was used to supplement two batches of cell extract which were prepared identically. The first batch was the same extract used to collect data on which the predictions were made, whereas the second batch was newly prepared. It was found that for the first extract, CFPS activity was enhanced when the premix containing ‘optimised’ concentrations of salts was used compared to the un-altered supplement solution premix (Figure 8a). Additionally, CFPS activity was observed as being within the confidence intervals predicted by the DoE model. When CFPS reactions were performed using the second extract and the new premix, CFPS activity was lower compared to reactions using the second extract and the original premix (Figure 8b). This supports the view that each extract requires separate optimisation of the supplement solution premix to reach optimal CFPS activity, and that a DoE approach is suitable for achieving this.

Figure 6: CFPS activity of CFPS reactions with salt concentrations according to the surface response design (Table 3) was determined as fluorescence intensity at each time point minus fluorescence intensity at the 15 minute time point. Reactions 12 through 16 failed due to an error in set-up. These reactions were replicates of reactions 8-11 and their removal had little negative effect on the SRD according to the design diagnostics tool in JMP. |

Figure 7: Cube plot generated by JMP using data collected for the SRD. The x-axis shows magnesium glutamate concentration, the y-axis shows potassium glutamate concentration, and the z-axis shows sodium oxalate concentration. The ovals shows predicted CFPS concentration. The maximal CFPS activity was found at 195 mM potassium glutamate, 6 mM magnesium glutamate, and 2 mM sodium oxalate. The minimal point was found at 65 mM potassium glutamate, 18 mM magnesium glutamate, and 2 mM sodium oxalate. This was verified as the maximum and minimum points using the surface profiler function in JMP. |

Figure 8: CFPS activity for two CFPS systems utilising two different cell extract batches prepared identically. A) Results for a system utilising the same extract batch used to test the SRD. B) Results for a system utilising a new batch of cell extract. The blue lines show systems using the normal CFPS supplement premix, and the purple lines show the systems with supplement premix with ‘optimised’ magnesium glutamate, potassium glutamate, and sodium oxalate as identified above. The system utilising extract from the same batch used in the SRD testing had a higher CFPS activity with the ‘optimised’ premix (purple) than with the original premix (blue), whereas the system utilising extract from a separate batch had higher activity with the original premix.
Design Stage 3
All 15 supplements in the supplement solution premix were analysed similarly to how the four salts were initially analysed (i.e. a main effects screening design). A classical screening design was created with all supplements as continuous factors (the nucleotides UTP, GTP, and CTP were combined to form a single factor), and CFPS activity as the response to be maximised. A concentration of ‘0’ was used as the lower limit for each factor, and the concentration used normally in CFPS supplement premixes was used as the upper limit. The main effects screening design was then used to generate the experimental design (Table 4).
Table 4: Table of reactions performed according to the DoE full supplement solution screening design. CFPS reactions contained concentrations of each supplement according to the table above.

Experimental Procedure 3
CFPS reactions were prepared and performed as usual, except the supplement solution had components at concentrations according to the main effects screening design. The experiment was repeated using two separate batches of cell extract; one which was initially moderately active (extract one) and one which initially had low activity (extract two). The results for each are shown below. It can be seen that for extract 1, the CFPS reaction with the highest CFPS activity was that with the original premix composition (R21), suggesting that the supplement solution was already near optimal. This is not surprising as the extract was already showing moderately high activity. Conversely, for extract 2, the reaction using the original premix was not the one with the highest CFPS activity. Similar to the first main effects screening design analysis performed, endpoint data was used with JMP to build a model predicting the important factors for each extract (bar charts below). This analysis shows that the most important factors vary greatly between each extract.

Figure 9: Extract batch 1: CFPS activity (fluorescence at each time point minus fluorescence at 15 mins) of reactions with supplements in amounts according to the DoE supplement screening design. Legend shows the reaction number for each system (Table 4). |

Figure 10: Extract batch 2: CFPS activity (fluorescence at each time point minus fluorescence at 15 mins) of reactions with supplements in amounts according to the DoE supplement screening design. Legend shows the reaction number for each system (Table 4). |

Figure 11: Bar chart of contrast values for each term in the CFPS supplement solution screening design generated by the JMP software. Contrast values are used as an estimate of a factor’s effect on the response. a) From CFPS system data utilising the moderately active extract (extract 1). b) From the CFPS system data utilising the low activity extract (extract 2).
Conclusions and Future Work
This study has begun multifactorial analysis on the components of the supplemental solution for cell free protein synthesis systems. It has provided evidence that some supplements have a greater effect on a systems protein synthesis activity than others, and that the important factors may differ between cell extract batches. The ability to use a Design of Experiments approach towards the optimisation of CFPS systems has also been demonstrated. While this study has provided evidence towards these claims, further work should be performed to validate the findings. A DoE screening design for the supplements of CFPS systems should be used on the same cell extract batch repeatedly. This will help confirm that the screening models derived from the experimental design data are accurate. The screening design should also be performed on many different batches of at least moderately active cell extracts to confirm that important supplements do differ between batches. Following the above, a surface response design could be used for all commonly important supplements of the CFPS system to determine its effectiveness at optimising CFPS activity. The information could also be used to determine commonly unimportant supplements so they can be eliminated from the supplement solution, hence decreasing the cost per reaction.
References
Text goes here.