Difference between revisions of "Team:Newcastle/Results"
| Line 1,025: | Line 1,025: | ||
<div> | <div> | ||
<img src="https://static.igem.org/mediawiki/parts/8/85/T--Newcastle--BB_CFPS_deGFP_sfGFP.png" width="600px"/> | <img src="https://static.igem.org/mediawiki/parts/8/85/T--Newcastle--BB_CFPS_deGFP_sfGFP.png" width="600px"/> | ||
| − | <p class="legend"><strong>Figure 5:</strong> CFPS Expression of J23100-deGFP and J23100-sfGFP Constructs. Time course for increase in fluorescence intensity of CFPS systems expressing GFP constructs over time. Each data point is an average of triplicate results, and error bars show +/- standard error. CFPS system with no DNA (Red) was used as the negative control.</p> | + | <p class="legend"><center><strong>Figure 5:</strong> CFPS Expression of J23100-deGFP and J23100-sfGFP Constructs. Time course for increase in fluorescence intensity of CFPS systems expressing GFP constructs over time. Each data point is an average of triplicate results, and error bars show +/- standard error. CFPS system with no DNA (Red) was used as the negative control.</center></p> |
</div> | </div> | ||
| Line 1,079: | Line 1,079: | ||
<p> | <p> | ||
| − | + | <center><h3><b>Figure 1:</b> <!--- Insert image name between tags. ----> | |
| − | + | SBOL Visual Detailing Reporter Variants </center></h3> <!--- Described what the diagram is showing. If biobricks are depicted give BBa_ numbers --> | |
</p></br> | </p></br> | ||
| Line 1,096: | Line 1,096: | ||
</a> | </a> | ||
<p> | <p> | ||
| − | + | <center><h3><b>Figure 2, 3, and 4:</b> <!--- Insert image name between tags. ----> | |
| − | + | Parts<a href="http://parts.igem.org/Part:BBa_K2205016"> BBa_K2205016</a>, <a href="http://parts.igem.org/Part:BBa_K2205017"> BBa_K2205017</a> and <a href="http://parts.igem.org/Part:BBa_K2205018"> BBa_K2205018</a> in PSB1C3 (Click for larger images) </center></h3> <!--- Described what the diagram is showing. If biobricks are depicted give BBa_ numbers --> | |
</p></br> | </p></br> | ||
<h2 style="font-family: Rubik; text-align: left; margin-top: 1%"> Implementation </h2> | <h2 style="font-family: Rubik; text-align: left; margin-top: 1%"> Implementation </h2> | ||
| Line 1,115: | Line 1,115: | ||
<p> | <p> | ||
| − | + | <center><h3><b>Figure 5:</b> <!--- Insert image name between tags. ----> | |
| − | + | Initial Testing of Chromoprotein Reporter Variants </center></h3> <!--- Described what the diagram is showing. If biobricks are depicted give BBa_ numbers --> | |
</p> | </p> | ||
<p> | <p> | ||
| Line 1,135: | Line 1,135: | ||
<img src="https://static.igem.org/mediawiki/2017/8/84/Frameworkfluo.jpg" width="360px"/> </br> | <img src="https://static.igem.org/mediawiki/2017/8/84/Frameworkfluo.jpg" width="360px"/> </br> | ||
<img src="https://static.igem.org/mediawiki/2017/3/3e/Pink_pellets2.jpg" width="360px"/> | <img src="https://static.igem.org/mediawiki/2017/3/3e/Pink_pellets2.jpg" width="360px"/> | ||
| − | <p class="legend"><strong>Figure 6:</strong> Pellets collected after overnight co-cultures of IPTG detector (<a href="http://parts.igem.org/Part:BBa_K2205009">BBa_K2205009</a>) + processor (<a href="http://parts.igem.org/Part:BBa_K2205012">BBa_K2205012</a>) + Pink Chromoprotein reporter (<a href="http://parts.igem.org/Part:BBa_K2205018">BBa_K2205018</a>) in ratios 1:1:1 and 1:1:13, with and without 1mM IPTG.</p> | + | <p class="legend"><center><strong>Figure 6:</strong> Pellets collected after overnight co-cultures of IPTG detector (<a href="http://parts.igem.org/Part:BBa_K2205009">BBa_K2205009</a>) + processor (<a href="http://parts.igem.org/Part:BBa_K2205012">BBa_K2205012</a>) + Pink Chromoprotein reporter (<a href="http://parts.igem.org/Part:BBa_K2205018">BBa_K2205018</a>) in ratios 1:1:1 and 1:1:13, with and without 1mM IPTG.</center></p> |
</div> | </div> | ||
| Line 1,144: | Line 1,144: | ||
<img src="https://static.igem.org/mediawiki/2017/4/49/Framework_blue.jpg" width="360px"/> </br> | <img src="https://static.igem.org/mediawiki/2017/4/49/Framework_blue.jpg" width="360px"/> </br> | ||
<img src="https://static.igem.org/mediawiki/2017/8/80/Blue_pellets2.jpg" width="360px"/> | <img src="https://static.igem.org/mediawiki/2017/8/80/Blue_pellets2.jpg" width="360px"/> | ||
| − | <p class="legend"><strong>Figure 7:</strong> Pellets collected after overnight co-cultures of IPTG detector (<a href="http://parts.igem.org/Part:BBa_K2205009">BBa_K2205009</a>) + processor (<a href="http://parts.igem.org/Part:BBa_K2205012">BBa_K2205012</a>) + Blue Chromoprotein reporter (<a href="http://parts.igem.org/Part:BBa_K2205016">BBa_K2205016</a>) in ratios 1:1:1 and 1:1:13, with and without 1mM IPTG.</p> | + | <p class="legend"><center><strong>Figure 7:</strong> Pellets collected after overnight co-cultures of IPTG detector (<a href="http://parts.igem.org/Part:BBa_K2205009">BBa_K2205009</a>) + processor (<a href="http://parts.igem.org/Part:BBa_K2205012">BBa_K2205012</a>) + Blue Chromoprotein reporter (<a href="http://parts.igem.org/Part:BBa_K2205016">BBa_K2205016</a>) in ratios 1:1:1 and 1:1:13, with and without 1mM IPTG.</center></p> |
</div> | </div> | ||
| Line 1,153: | Line 1,153: | ||
<img src="https://static.igem.org/mediawiki/2017/f/f2/T--Newcastle--BB_framework_framework_green.jpg" width="360px"/> </br> | <img src="https://static.igem.org/mediawiki/2017/f/f2/T--Newcastle--BB_framework_framework_green.jpg" width="360px"/> </br> | ||
<img src="https://static.igem.org/mediawiki/2017/e/e7/Gfp_pellets2.jpg" width="360px"/> | <img src="https://static.igem.org/mediawiki/2017/e/e7/Gfp_pellets2.jpg" width="360px"/> | ||
| − | <p class="legend"><strong>Figure 8:</strong> Pellets collected after overnight co-cultures of IPTG detector (<a href="http://parts.igem.org/Part:BBa_K2205009">BBa_K2205009</a>) + processor (<a href="http://parts.igem.org/Part:BBa_K2205012">BBa_K2205012</a>) + sfGFP reporter (<a href="http://parts.igem.org/Part:BBa_K2205015">BBa_K2205015</a>) in ratios 1:1:1 and 1:1:13, with and without 1mM IPTG.</p> | + | <p class="legend"><center><strong>Figure 8:</strong> Pellets collected after overnight co-cultures of IPTG detector (<a href="http://parts.igem.org/Part:BBa_K2205009">BBa_K2205009</a>) + processor (<a href="http://parts.igem.org/Part:BBa_K2205012">BBa_K2205012</a>) + sfGFP reporter (<a href="http://parts.igem.org/Part:BBa_K2205015">BBa_K2205015</a>) in ratios 1:1:1 and 1:1:13, with and without 1mM IPTG.</center></p> |
</div> | </div> | ||
| Line 1,206: | Line 1,206: | ||
<img src="https://static.igem.org/mediawiki/2017/0/03/T--Newcastle--BB_framework_framework.png" class="img-fluid rounded mx-auto d-block" style="max-width: 60%" alt=""> | <img src="https://static.igem.org/mediawiki/2017/0/03/T--Newcastle--BB_framework_framework.png" class="img-fluid rounded mx-auto d-block" style="max-width: 60%" alt=""> | ||
<p> | <p> | ||
| − | <b>Figure 1: </b> Multicellular Sensynova system. | + | <center><b>Figure 1: </b> Multicellular Sensynova system.</center> |
</br></br></p> | </br></br></p> | ||
| Line 1,218: | Line 1,218: | ||
<img src="https://static.igem.org/mediawiki/2017/6/63/Framework_generic.jpg" class="img-fluid rounded mx-auto d-block" style="max-width: 60%" alt=""> | <img src="https://static.igem.org/mediawiki/2017/6/63/Framework_generic.jpg" class="img-fluid rounded mx-auto d-block" style="max-width: 60%" alt=""> | ||
<p> | <p> | ||
| − | <b>Figure 2:</b> Modular and multicellular Sensynova framework design. | + | <center><b>Figure 2:</b> Modular and multicellular Sensynova framework design.</center> |
</br></br></p> | </br></br></p> | ||
<p> The splitting of biosensor components into separate cells may have additional advantages besides ease of variant production. Goni-Moreno <i>et al</i>. (2011) have previously suggested that the use of synthetic quorum sensing circuits enables each cell to be considered an independent logic gate, which may rectify the “fuzzy logic” seen in some biosensors, where stochastic cellular processes may produce false positive results. Quorum sensing has also been previously used to synchronise gene expressions, leading to reduced variability within a population (Danino <i>et al</i>., 2010).</p> | <p> The splitting of biosensor components into separate cells may have additional advantages besides ease of variant production. Goni-Moreno <i>et al</i>. (2011) have previously suggested that the use of synthetic quorum sensing circuits enables each cell to be considered an independent logic gate, which may rectify the “fuzzy logic” seen in some biosensors, where stochastic cellular processes may produce false positive results. Quorum sensing has also been previously used to synchronise gene expressions, leading to reduced variability within a population (Danino <i>et al</i>., 2010).</p> | ||
| Line 1,239: | Line 1,239: | ||
<img src="https://static.igem.org/mediawiki/2017/5/5e/Graphy%281%29.jpeg" class="img-fluid rounded mx-auto d-block" style="max-width: 60%" alt=""> | <img src="https://static.igem.org/mediawiki/2017/5/5e/Graphy%281%29.jpeg" class="img-fluid rounded mx-auto d-block" style="max-width: 60%" alt=""> | ||
<p> | <p> | ||
| − | <b>Figure 3:</b> Frequency of projects based on biosensors development in iGEM. </p> | + | <center><b>Figure 3:</b> Frequency of projects based on biosensors development in iGEM. </center></p> |
</br> | </br> | ||
<p> | <p> | ||
| Line 1,253: | Line 1,253: | ||
<img src="https://static.igem.org/mediawiki/2017/5/5c/Iptg_framework.jpg" class="img-fluid rounded mx-auto d-block" style="max-width: 60%" alt=""> | <img src="https://static.igem.org/mediawiki/2017/5/5c/Iptg_framework.jpg" class="img-fluid rounded mx-auto d-block" style="max-width: 60%" alt=""> | ||
<p> | <p> | ||
| − | <b>Figure 4: Sensynova framework design used for sensing IPTG. </ | + | <center><b>Figure 4:</b> Sensynova framework design used for sensing IPTG. </center></p> |
</br></br> | </br></br> | ||
| Line 1,260: | Line 1,260: | ||
<img src="https://static.igem.org/mediawiki/2017/1/10/Framework_gel_parts.png" class="img-fluid rounded mx-auto d-block" style="max-width: 60%" alt=""> | <img src="https://static.igem.org/mediawiki/2017/1/10/Framework_gel_parts.png" class="img-fluid rounded mx-auto d-block" style="max-width: 60%" alt=""> | ||
<p> | <p> | ||
| − | <b>Figure 5:</b> Colony PCR confirming the correct integration of the biosensor fragments into the vector. </p> | + | <center><b>Figure 5:</b> Colony PCR confirming the correct integration of the biosensor fragments into the vector. </center></p> |
| Line 1,278: | Line 1,278: | ||
<p> | <p> | ||
| − | + | <center><b>Figure 6: </b> The reporter part <a href="http://parts.igem.org/Part:BBa_K2205015">BBa_K2205015</a> test shows a significant fluorescence increase after induction with the connecting molecule 2 C12-RHL. | |
| − | </p> </br> | + | </center></p> </br> |
<p> | <p> | ||
| Line 1,288: | Line 1,288: | ||
<img src="https://static.igem.org/mediawiki/2017/f/f0/Hsl_proc_rep.jpg" class="img-fluid rounded mx-auto d-block" style="max-width: 60%" alt=""> | <img src="https://static.igem.org/mediawiki/2017/f/f0/Hsl_proc_rep.jpg" class="img-fluid rounded mx-auto d-block" style="max-width: 60%" alt=""> | ||
</br> | </br> | ||
| − | <p> <b>Figure 7:</b> The processor <a href="http://parts.igem.org/Part:BBa_K2205012">BBa_K2205012</a> and reporter <a href="http://parts.igem.org/Part:BBa_K2205015">BBa_K2205015</a> co-culture test shows increasing fluorescence/time after specific induction with the connecting molecule C12-RHL. | + | <center><p> <b>Figure 7:</b> The processor <a href="http://parts.igem.org/Part:BBa_K2205012">BBa_K2205012</a> and reporter <a href="http://parts.igem.org/Part:BBa_K2205015">BBa_K2205015</a> co-culture test shows increasing fluorescence/time after specific induction with the connecting molecule C12-RHL. |
| − | </p> </br> | + | </center></p> </br> |
<p> | <p> | ||
| Line 1,301: | Line 1,301: | ||
<img src="https://static.igem.org/mediawiki/2017/1/10/Framework_test_111.jpg" class="img-fluid rounded mx-auto d-block" style="max-width: 60%" alt=""> | <img src="https://static.igem.org/mediawiki/2017/1/10/Framework_test_111.jpg" class="img-fluid rounded mx-auto d-block" style="max-width: 60%" alt=""> | ||
</p> | </p> | ||
| − | <p> <b>Figure 8:</b> Framework (<a href="http://parts.igem.org/Part:BBa_K2205009">BBa_K2205009</a> , <a href="http://parts.igem.org/Part:BBa_K2205012">BBa_K2205012</a> , <a href="http://parts.igem.org/Part:BBa_K2205015">BBa_K2205015</a> ) test with a co-culture in ratio 1:1:1 in response of IPTG induction. | + | <center><p> <b>Figure 8:</b> Framework (<a href="http://parts.igem.org/Part:BBa_K2205009">BBa_K2205009</a> , <a href="http://parts.igem.org/Part:BBa_K2205012">BBa_K2205012</a> , <a href="http://parts.igem.org/Part:BBa_K2205015">BBa_K2205015</a> ) test with a co-culture in ratio 1:1:1 in response of IPTG induction. |
| − | </p> </br> | + | </center></p> </br> |
<p> | <p> | ||
Results from the <a href="https://2017.igem.org/Team:Newcastle/Model#sim">multicellular modelling</a> predicted that the traditionally used 1:1:1 ratio is not the optimal combination for the Sensynova device to work. It is in fact suggested to adopt a higher concentration of the reporter culture compare with the detector and processor. Thus, the framework test was repeated incorporating our in silico simulation data and combining the 3 cell types in ratio 1:1:13 (detectors:processors:reporters). The experiment results, shown in the picture below, confirm the modelling data. There is a consistent discrepancy between IPTG induced and non-induced samples in the 1:1:13 co-cultures, in comparison with the 1:1:1 co-cultures which don't show any difference in presence or absence of IPTG (figure9).</p> | Results from the <a href="https://2017.igem.org/Team:Newcastle/Model#sim">multicellular modelling</a> predicted that the traditionally used 1:1:1 ratio is not the optimal combination for the Sensynova device to work. It is in fact suggested to adopt a higher concentration of the reporter culture compare with the detector and processor. Thus, the framework test was repeated incorporating our in silico simulation data and combining the 3 cell types in ratio 1:1:13 (detectors:processors:reporters). The experiment results, shown in the picture below, confirm the modelling data. There is a consistent discrepancy between IPTG induced and non-induced samples in the 1:1:13 co-cultures, in comparison with the 1:1:1 co-cultures which don't show any difference in presence or absence of IPTG (figure9).</p> | ||
| Line 1,313: | Line 1,313: | ||
<p> | <p> | ||
| − | <p class="legend"><strong><b>Figure 9:</b></strong> Framework (<a href="http://parts.igem.org/Part:BBa_K2205009">BBa_K2205009</a> , <a href="http://parts.igem.org/Part:BBa_K2205012">BBa_K2205012</a> , <a href="http://parts.igem.org/Part:BBa_K2205015">BBa_K2205015</a> ) test with a co-culture in ratio 1:1:13 in response of IPTG induction. | + | <p class="legend"><center><strong><b>Figure 9:</b></strong> Framework (<a href="http://parts.igem.org/Part:BBa_K2205009">BBa_K2205009</a> , <a href="http://parts.igem.org/Part:BBa_K2205012">BBa_K2205012</a> , <a href="http://parts.igem.org/Part:BBa_K2205015">BBa_K2205015</a> ) test with a co-culture in ratio 1:1:13 in response of IPTG induction. |
| − | </p> | + | </center></p> |
<p> | <p> | ||
The experimental data validate the model prediction showing that the system worked most optimally when the reporter cells were in excess of both the detector and processor cells. One of the reasons that this configuration was the best may be because of signal amplification at each of the quorum sensing communication stages. The quorum sensing mechanism used here is the acyl homoserine lactone (AHL) system in gram negative bacteria. This system works by one cell producing a quorum sensing molecule which can diffuse out through its membrane. Once the extracellular space reaches a certain threshold concentration of AHL molecule, the AHL will begin to diffuse into other cells in the community. If the cell the AHL molecule enters has the appropriate transcription factor present (e.g. LasR for the C12 AHL), then transcription of a gene under the control of the pLas promoter can occur. Therefore, if background expression of the AHL is high enough to reach above the threshold level, then expression of the next quorum sensing molecule in another cell (in this case C4 AHL) will occur. By reducing the amount of detector and processor cells present in the system, the background expression levels of C12 and C4 will be lower, and hence expression of sfGFP by the reporter cell will be lower. | The experimental data validate the model prediction showing that the system worked most optimally when the reporter cells were in excess of both the detector and processor cells. One of the reasons that this configuration was the best may be because of signal amplification at each of the quorum sensing communication stages. The quorum sensing mechanism used here is the acyl homoserine lactone (AHL) system in gram negative bacteria. This system works by one cell producing a quorum sensing molecule which can diffuse out through its membrane. Once the extracellular space reaches a certain threshold concentration of AHL molecule, the AHL will begin to diffuse into other cells in the community. If the cell the AHL molecule enters has the appropriate transcription factor present (e.g. LasR for the C12 AHL), then transcription of a gene under the control of the pLas promoter can occur. Therefore, if background expression of the AHL is high enough to reach above the threshold level, then expression of the next quorum sensing molecule in another cell (in this case C4 AHL) will occur. By reducing the amount of detector and processor cells present in the system, the background expression levels of C12 and C4 will be lower, and hence expression of sfGFP by the reporter cell will be lower. | ||
| Line 1,330: | Line 1,330: | ||
<img src="https://static.igem.org/mediawiki/2017/8/84/Frameworkfluo.jpg" width="100%"/> </br> | <img src="https://static.igem.org/mediawiki/2017/8/84/Frameworkfluo.jpg" width="100%"/> </br> | ||
<img src="https://static.igem.org/mediawiki/2017/3/3e/Pink_pellets2.jpg" width="100%"/> | <img src="https://static.igem.org/mediawiki/2017/3/3e/Pink_pellets2.jpg" width="100%"/> | ||
| − | <p class="legend"><strong>Figure 10:</strong> Pellets collected after overnight co-cultures of IPTG detector((<a href="http://parts.igem.org/Part:BBa_K2205009">BBa_K2205009</a>) + processor(<a href="http://parts.igem.org/Part:BBa_K2205012">BBa_K2205012</a>) + Pink Chromoprotein reporter(<a href="http://parts.igem.org/Part:BBa_K2205018">BBa_K2205018</a>)in ratios 1:1:1 and 1:1:13, with and without 1mM IPTG.</p> | + | <p class="legend"><center><strong>Figure 10:</strong> Pellets collected after overnight co-cultures of IPTG detector((<a href="http://parts.igem.org/Part:BBa_K2205009">BBa_K2205009</a>) + processor(<a href="http://parts.igem.org/Part:BBa_K2205012">BBa_K2205012</a>) + Pink Chromoprotein reporter(<a href="http://parts.igem.org/Part:BBa_K2205018">BBa_K2205018</a>)in ratios 1:1:1 and 1:1:13, with and without 1mM IPTG.</center></p> |
| Line 1,339: | Line 1,339: | ||
<img src="https://static.igem.org/mediawiki/2017/4/49/Framework_blue.jpg" width="100%"/> </br> | <img src="https://static.igem.org/mediawiki/2017/4/49/Framework_blue.jpg" width="100%"/> </br> | ||
<img src="https://static.igem.org/mediawiki/2017/8/80/Blue_pellets2.jpg" width="100%"/> | <img src="https://static.igem.org/mediawiki/2017/8/80/Blue_pellets2.jpg" width="100%"/> | ||
| − | <p class="legend"><strong>Figure 11:</strong> Pellets collected after overnight co-cultures of IPTG detector((<a href="http://parts.igem.org/Part:BBa_K2205009">BBa_K2205009</a>) + processor(<a href="http://parts.igem.org/Part:BBa_K2205012">BBa_K2205012</a>) + Blue Chromoprotein reporter( <a href="http://parts.igem.org/Part:BBa_K2205016">BBa_K2205016</a>) in ratios 1:1:1 and 1:1:13, with and without 1mM IPTG.</p> | + | <p class="legend"><center><strong>Figure 11:</strong> Pellets collected after overnight co-cultures of IPTG detector((<a href="http://parts.igem.org/Part:BBa_K2205009">BBa_K2205009</a>) + processor(<a href="http://parts.igem.org/Part:BBa_K2205012">BBa_K2205012</a>) + Blue Chromoprotein reporter( <a href="http://parts.igem.org/Part:BBa_K2205016">BBa_K2205016</a>) in ratios 1:1:1 and 1:1:13, with and without 1mM IPTG.</center></p> |
| Line 1,348: | Line 1,348: | ||
<img src="https://static.igem.org/mediawiki/2017/f/f2/T--Newcastle--BB_framework_framework_green.jpg" width="100%"/> </br> | <img src="https://static.igem.org/mediawiki/2017/f/f2/T--Newcastle--BB_framework_framework_green.jpg" width="100%"/> </br> | ||
<img src="https://static.igem.org/mediawiki/2017/e/e7/Gfp_pellets2.jpg" width="100%"/> | <img src="https://static.igem.org/mediawiki/2017/e/e7/Gfp_pellets2.jpg" width="100%"/> | ||
| − | <p class="legend"><strong>Figure 12:</strong> Pellets collected after overnight co-cultures of IPTG detector(<a href="http://parts.igem.org/Part:BBa_K2205009">BBa_K2205009</a>) + processor(<a href="http://parts.igem.org/Part:BBa_K2205012">BBa_K2205012</a>) + sfGFP reporter(<a href="http://parts.igem.org/Part:BBa_K2205015">BBa_K2205015</a>)in ratios 1:1:1 and 1:1:13, with and without 1mM IPTG.<br /><br /> | + | <p class="legend"><center><strong>Figure 12:</strong> Pellets collected after overnight co-cultures of IPTG detector(<a href="http://parts.igem.org/Part:BBa_K2205009">BBa_K2205009</a>) + processor(<a href="http://parts.igem.org/Part:BBa_K2205012">BBa_K2205012</a>) + sfGFP reporter(<a href="http://parts.igem.org/Part:BBa_K2205015">BBa_K2205015</a>)in ratios 1:1:1 and 1:1:13, with and without 1mM IPTG.</center><br /><br /> |
</div> | </div> | ||
| Line 1,426: | Line 1,426: | ||
<div> | <div> | ||
<img src="https://static.igem.org/mediawiki/2017/9/97/T--Newcastle--BB_CFPS_overview.png" width="800px"/> | <img src="https://static.igem.org/mediawiki/2017/9/97/T--Newcastle--BB_CFPS_overview.png" width="800px"/> | ||
| − | <p class="legend"><strong>Figure 1</strong> Diagrammatic overview of CFPS supplement roles in transcription and translation.</p> | + | <p class="legend"><center><strong>Figure 1</strong> Diagrammatic overview of CFPS supplement roles in transcription and translation.</center></p> |
</div> | </div> | ||
| Line 1,471: | Line 1,471: | ||
<div> | <div> | ||
<img src="https://static.igem.org/mediawiki/2017/1/1d/T--Newcastle--BB_pSB1C3-sfGFP_plasmid_map.png" width="400px"/> | <img src="https://static.igem.org/mediawiki/2017/1/1d/T--Newcastle--BB_pSB1C3-sfGFP_plasmid_map.png" width="400px"/> | ||
| − | <p class="legend"><strong>Figure 2:</strong> Plasmid map for pSB1C3-sfGFP. Construct is standard biobrick part BBa_ K515105.</p> | + | <p class="legend"><center><strong>Figure 2:</strong> Plasmid map for pSB1C3-sfGFP. Construct is standard biobrick part BBa_ K515105.</center></p> |
</div> | </div> | ||
| Line 1,479: | Line 1,479: | ||
<div> | <div> | ||
<img src="https://static.igem.org/mediawiki/2017/e/e3/T--Newcastle--BB_CFPS_initial_test.png" width="600px"/> | <img src="https://static.igem.org/mediawiki/2017/e/e3/T--Newcastle--BB_CFPS_initial_test.png" width="600px"/> | ||
| − | <p class="legend"><strong>Figure 3:</strong> Negative corrected fluorescence for <i>E. coli</i> BL21 extract-based CFPS systems. Each data point is an average of 3 replicate reactions, and error bars represent +/- standard error.</p> | + | <p class="legend"><center><strong>Figure 3:</strong> Negative corrected fluorescence for <i>E. coli</i> BL21 extract-based CFPS systems. Each data point is an average of 3 replicate reactions, and error bars represent +/- standard error.</center></p> |
</div> | </div> | ||
| Line 1,515: | Line 1,515: | ||
<div> | <div> | ||
<img src="https://static.igem.org/mediawiki/2017/f/fb/T--Newcastle--BB_CFPS_figure3.png" width="400px" style="background-color: white;"/> | <img src="https://static.igem.org/mediawiki/2017/f/fb/T--Newcastle--BB_CFPS_figure3.png" width="400px" style="background-color: white;"/> | ||
| − | <p class="legend"><strong>Figure 4:</strong> CFPS activity of CFPS reactions with salt concentrations according to the main effects screening design (table 2) was determined as fluorescence intensity at each time point minus fluorescence intensity at the 15 minute time point. Reaction IDs are described in table 2.</p> | + | <p class="legend"><center><strong>Figure 4:</strong> CFPS activity of CFPS reactions with salt concentrations according to the main effects screening design (table 2) was determined as fluorescence intensity at each time point minus fluorescence intensity at the 15 minute time point. Reaction IDs are described in table 2.</center></p> |
</div> | </div> | ||
| Line 1,523: | Line 1,523: | ||
<div> | <div> | ||
<img src="https://static.igem.org/mediawiki/2017/b/b0/T--Newcastle--BB_CFPS_figure4.png" width="600px"/> | <img src="https://static.igem.org/mediawiki/2017/b/b0/T--Newcastle--BB_CFPS_figure4.png" width="600px"/> | ||
| − | <p class="legend"><strong>Figure 5:</strong> Screening model constructed using JMP showing which factors were closest to significance. Predictions for interactions are unreliable due to forced orthogonality (*). Of the primary factors, magnesium glutamate is the closest to significant, followed by potassium glutamate, sodium oxalate, and ammonium acetate in that order.</p> | + | <p class="legend"><center><strong>Figure 5:</strong> Screening model constructed using JMP showing which factors were closest to significance. Predictions for interactions are unreliable due to forced orthogonality (*). Of the primary factors, magnesium glutamate is the closest to significant, followed by potassium glutamate, sodium oxalate, and ammonium acetate in that order.</center></p> |
</div> | </div> | ||
| Line 1,536: | Line 1,536: | ||
<div> | <div> | ||
<img src="https://static.igem.org/mediawiki/2017/5/5f/T--Newcastle--BB_CFPS_figure5.png" width="600px"/> | <img src="https://static.igem.org/mediawiki/2017/5/5f/T--Newcastle--BB_CFPS_figure5.png" width="600px"/> | ||
| − | <p class="legend"><strong>Figure 6:</strong> Comparison of four surface response designs generated by the JMP software using the compare designs feature. From top to bottom: design type, number of reactions required by the design, colour map on correlations, Power analysis of terms, efficiencies, and average prediction variance. For the colour map on correlations, red is highly correlated and blue is highly un-correlated. </p> | + | <p class="legend"><center><strong>Figure 6:</strong> Comparison of four surface response designs generated by the JMP software using the compare designs feature. From top to bottom: design type, number of reactions required by the design, colour map on correlations, Power analysis of terms, efficiencies, and average prediction variance. For the colour map on correlations, red is highly correlated and blue is highly un-correlated. </center></p> |
</div> | </div> | ||
<br /> | <br /> | ||
| Line 1,564: | Line 1,564: | ||
<div> | <div> | ||
<img src="https://static.igem.org/mediawiki/2017/2/24/T--Newcastle--BB_CFPS_figure6.png" width="400px"/> | <img src="https://static.igem.org/mediawiki/2017/2/24/T--Newcastle--BB_CFPS_figure6.png" width="400px"/> | ||
| − | <p class="legend"><strong>Figure 7:</strong> CFPS activity of CFPS reactions with salt concentrations according to the surface response design (Table 3) was determined as fluorescence intensity at each time point minus fluorescence intensity at the 15 minute time point. Reactions 12 through 16 failed due to an error in set-up. These reactions were replicates of reactions 8-11 and their removal had little negative effect on the SRD according to the design diagnostics tool in JMP.</p> | + | <p class="legend"><center><strong>Figure 7:</strong> CFPS activity of CFPS reactions with salt concentrations according to the surface response design (Table 3) was determined as fluorescence intensity at each time point minus fluorescence intensity at the 15 minute time point. Reactions 12 through 16 failed due to an error in set-up. These reactions were replicates of reactions 8-11 and their removal had little negative effect on the SRD according to the design diagnostics tool in JMP.</center></p> |
</div> | </div> | ||
| Line 1,572: | Line 1,572: | ||
<div> | <div> | ||
<img src="https://static.igem.org/mediawiki/2017/4/41/T--Newcastle--BB_CFPS_figure7.png" width="600px"/> | <img src="https://static.igem.org/mediawiki/2017/4/41/T--Newcastle--BB_CFPS_figure7.png" width="600px"/> | ||
| − | <p class="legend"><strong>Figure 8:</strong> Cube plot generated by JMP using data collected for the SRD. The x-axis shows magnesium glutamate concentration, the y-axis shows potassium glutamate concentration, and the z-axis shows sodium oxalate concentration. The ovals shows predicted CFPS concentration. The maximal CFPS activity was found at 195 mM potassium glutamate, 6 mM magnesium glutamate, and 2 mM sodium oxalate. The minimal point was found at 65 mM potassium glutamate, 18 mM magnesium glutamate, and 2 mM sodium oxalate. This was verified as the maximum and minimum points using the surface profiler function in JMP.</p> | + | <p class="legend"><center><strong>Figure 8:</strong> Cube plot generated by JMP using data collected for the SRD. The x-axis shows magnesium glutamate concentration, the y-axis shows potassium glutamate concentration, and the z-axis shows sodium oxalate concentration. The ovals shows predicted CFPS concentration. The maximal CFPS activity was found at 195 mM potassium glutamate, 6 mM magnesium glutamate, and 2 mM sodium oxalate. The minimal point was found at 65 mM potassium glutamate, 18 mM magnesium glutamate, and 2 mM sodium oxalate. This was verified as the maximum and minimum points using the surface profiler function in JMP.</center></p> |
</div> | </div> | ||
| Line 1,581: | Line 1,581: | ||
<div> | <div> | ||
<img src="https://static.igem.org/mediawiki/2017/9/99/T--Newcastle--BB_CFPS_figure8.png" width="600px" style="background-color:white;"/> | <img src="https://static.igem.org/mediawiki/2017/9/99/T--Newcastle--BB_CFPS_figure8.png" width="600px" style="background-color:white;"/> | ||
| − | <p class="legend"><strong>Figure 9:</strong> CFPS activity for two CFPS systems utilising two different cell extract batches prepared identically. A) Results for a system utilising the same extract batch used to test the SRD. B) Results for a system utilising a new batch of cell extract. The blue lines show systems using the normal CFPS supplement premix, and the purple lines show the systems with supplement premix with ‘optimised’ magnesium glutamate, potassium glutamate, and sodium oxalate as identified above. The system utilising extract from the same batch used in the SRD testing had a higher CFPS activity with the ‘optimised’ premix (purple) than with the original premix (blue), whereas the system utilising extract from a separate batch had higher activity with the original premix.</p> | + | <p class="legend"><center><strong>Figure 9:</strong> CFPS activity for two CFPS systems utilising two different cell extract batches prepared identically. A) Results for a system utilising the same extract batch used to test the SRD. B) Results for a system utilising a new batch of cell extract. The blue lines show systems using the normal CFPS supplement premix, and the purple lines show the systems with supplement premix with ‘optimised’ magnesium glutamate, potassium glutamate, and sodium oxalate as identified above. The system utilising extract from the same batch used in the SRD testing had a higher CFPS activity with the ‘optimised’ premix (purple) than with the original premix (blue), whereas the system utilising extract from a separate batch had higher activity with the original premix.</center></p> |
</div> | </div> | ||
| Line 1,615: | Line 1,615: | ||
<div> | <div> | ||
<img src="https://static.igem.org/mediawiki/2017/8/83/T--Newcastle--BB_CFPS_figure9.png" width="400px"/> | <img src="https://static.igem.org/mediawiki/2017/8/83/T--Newcastle--BB_CFPS_figure9.png" width="400px"/> | ||
| − | <p class="legend"><strong>Figure 10:</strong> Extract batch 1: CFPS activity (fluorescence at each time point minus fluorescence at 15 mins) of reactions with supplements in amounts according to the DoE supplement screening design. Legend shows the reaction number for each system (Table 4).</p> | + | <p class="legend"><center><strong>Figure 10:</strong> Extract batch 1: CFPS activity (fluorescence at each time point minus fluorescence at 15 mins) of reactions with supplements in amounts according to the DoE supplement screening design. Legend shows the reaction number for each system (Table 4).</center></p> |
</div> | </div> | ||
| Line 1,623: | Line 1,623: | ||
<div> | <div> | ||
<img src="https://static.igem.org/mediawiki/2017/9/90/T--Newcastle--BB_CFPS_figure10.png" width="600px"/> | <img src="https://static.igem.org/mediawiki/2017/9/90/T--Newcastle--BB_CFPS_figure10.png" width="600px"/> | ||
| − | <p class="legend"><strong>Figure 11:</strong> Extract batch 2: CFPS activity (fluorescence at each time point minus fluorescence at 15 mins) of reactions with supplements in amounts according to the DoE supplement screening design. Legend shows the reaction number for each system (Table 4).</p> | + | <p class="legend"><center><strong>Figure 11:</strong> Extract batch 2: CFPS activity (fluorescence at each time point minus fluorescence at 15 mins) of reactions with supplements in amounts according to the DoE supplement screening design. Legend shows the reaction number for each system (Table 4).</center></p> |
</div> | </div> | ||
| Line 1,633: | Line 1,633: | ||
<div> | <div> | ||
<img src="https://static.igem.org/mediawiki/2017/5/58/T--Newcastle--BB_CFPS_figure11.png" width="600px" style="background-color:white;"/> | <img src="https://static.igem.org/mediawiki/2017/5/58/T--Newcastle--BB_CFPS_figure11.png" width="600px" style="background-color:white;"/> | ||
| − | <p class="legend"><strong>Figure 12:</strong> Bar chart of contrast values for each term in the CFPS supplement solution screening design generated by the JMP software. Contrast values are used as an estimate of a factor’s effect on the response. a) From CFPS system data utilising the moderately active extract (extract 1). b) From the CFPS system data utilising the low activity extract (extract 2).</p> | + | <p class="legend"><center><strong>Figure 12:</strong> Bar chart of contrast values for each term in the CFPS supplement solution screening design generated by the JMP software. Contrast values are used as an estimate of a factor’s effect on the response. a) From CFPS system data utilising the moderately active extract (extract 1). b) From the CFPS system data utilising the low activity extract (extract 2).</center></p> |
</div> | </div> | ||
Revision as of 19:36, 31 October 2017
spacefill
spacefill
Our Experimental Results
Below is a diagram of our Sensynova Framework. Clicking on each part of the framework (e.g. detector modules) links to the relevant results.
Alternatively, at the bottom of this page are tabs which will show you results for every part of the project
Framework |
Framework Chassis |
|||
|
Biochemical Adaptor 
|
||||
|
Target 
|
|
Detector Modules 
|
Multicellular Framework Testing 
|
|
|
|
||||
|
C12 HSL: Connector 1 
|
||||
|
|
||||
|
Processor Modules 
|
||||
|
|
Framework in Cell Free Protein Synthesis Systems 
|
|||
|
C4 HSL: Connector 2 
|
||||
|
|
||||
|
Reporter Modules 
|
||||
|
Looking for Interlab Study related results? Click below! 
|
||||
Sarcosine Oxidase
BioBricks used: BBa_K2205003 (New), BBa_K2205004 (New)
Rationale and Aim
Sarcosine Oxidase (SOX) is an enzyme that oxidatively demethylates sarcosine to form glycine, hydrogen peroxide and formaldehyde (Figure 1) (Trickey et al. 1999). SOX was selected to be an example of a possible solution to one of the 5 problems in biosensor production that we identified - unconventional substrates. We defined an unconventional substrate as a substrate that we have little prior knowledge of but that can be adapted into something with an existing biosensor. SOX was specifically chosen to demonstrate that glyphosate, an unconventional substrate which there is not a lot information on, can be converted into formaldehyde which there are existing biosensors for (Ling and Heng 2010). As part of our project, SOX was designed to be an ‘adapter’ that could link glyphosate into our framework via a formaldehyde detector module. This concept could then be applied to other molecules that have easily detectable substrates in their degradation pathways. The aim of this part of the project was to demonstrate that SOX can be expressed by E. coli cells and that when glyphosate is added SOX can convert it to formaldehyde to be detected via a biosensor.

Background Information
Glyphosate is a herbicide that works by blocking the activity of the enzyme enolpyruvylshikimate-3-phosphate synthase (EPSPS), which converts carbohydrates derived from glycolysis and the pentose phosphate pathway to plant metabolites and aromatic amino acids. We attempted to design a system capable of glyphosate detection. With little information regarding mechanisms of glyphosate interactions with the cell, we could not design a simple system, representative of the majority of synthetic biology biosensor designs, in which a responsive transcription factor was able to affect the production of a reporter gene. The mining of transcriptome data has previously been used to find responsive DNA elements to a molecule of interest (Groningen 2012). Therefore, we analysed differences in transcriptome data between glyphosate sensitive and insensitive plants. A number of genes were found which were differently expressed. However, it was determined that it is more likely that this differential expression was not due to glyphosate directly, but rather the aromatic amino acid starvation caused by EPSPS inhibition by glyphosate, making these systems unsuitable for direct glyphosate detection. Various other systems we designed were also far from ideal, with high levels of complexity and reliance on native plant machinery. Through conversations with biosensor developers, we found that this problem was common in biosensor development - large amounts of often unavailable data is required for system design. For the Sensynova framework, we needed a more generic solution to this issue. Therefore, we expanded our search to look for biochemical reactions which we could monitor instead. This resulted in our concept of “adapter” devices which can alter difficult to sense molecules using biochemical reactions.
Design Stage
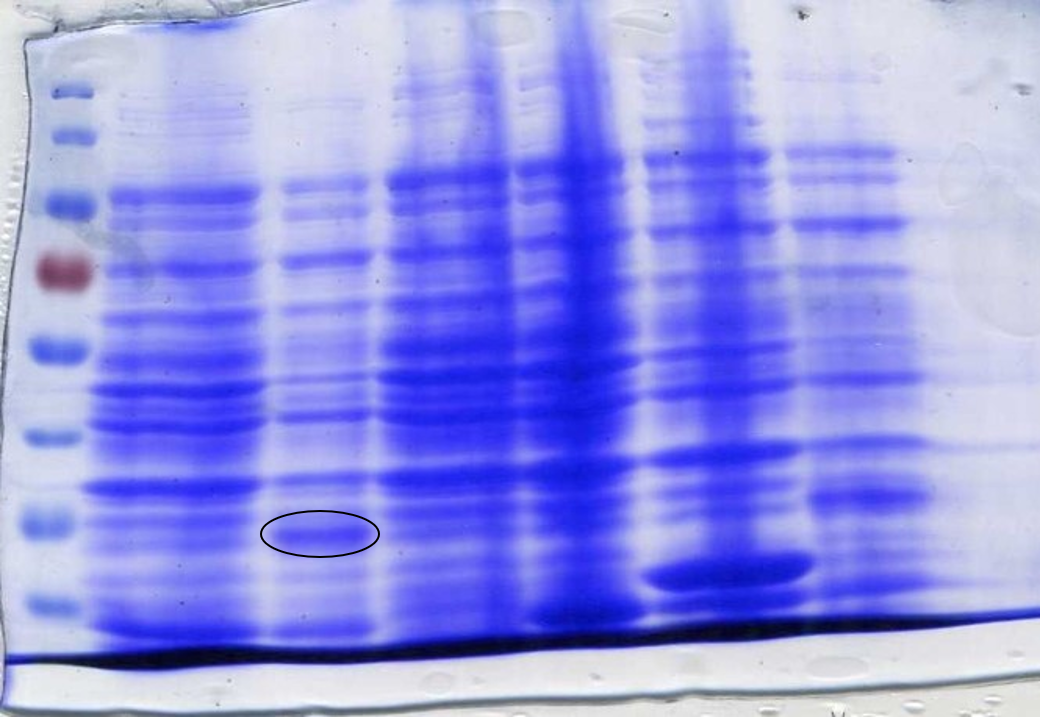
To ensure the codon usage of our SOX protein was not differing significantly from the average codon usage of E. coli, rare codons were removed from the sequence using the IDT codon optimisation toolto produce high protein expression. E. coli BL21-DE3 cells have higher levels of protein expression than DH5α cells and so were a more practical choice. This led to the expression of SOX being placed under the control of a T7 promoter due to BL21-DE3 cells producing T7 polymerase after the addition of IPTG. During the initial design stage of the protein, parts of the sequence were lost between optimisation and sending it to be synthesised into a gBlock. This was not discovered until expression of SOX was induced by IPTG in BL21-DE3 cells and a sample analysed by SDS-Page gel electrophoresis (Figure 2). It was noticed that the band we were expecting was of a lower molecular weight than what it should have been; ~35kDa instead of ~42kDa. It was realised that the sequence in the PSB1C3 plasmid was different to the sequence origin. Therefore a new gBlock was synthesised using the proper sequence and an SDS-Page gel used to confirm that the protein expressed was of the correct molecular weight (Figure 3).

Implementation
SOX was synthesised as a gBlock and assembled using HiFi Assembly. After assembly, SOX was transformed into E. coli DH5α cells and then into BL21-DE3 cells. This was done because DH5α cells are better for transformation, while BL21-DE3 cells are better for protein expression. Colonies indicated successful assembly, which was confirmed by creating plasmid DNA preparations of the colonies and performing confirmation digests to view on an agarose gel using the restriction enzymes Xba1 and Spe1 (Figure 4).

The plasmid DNA preps with the correctly assembled SOX gBlock present were then transformed into E. coli BL21-DE3 cells. This was because BL21-DE3 cells are optimised for protein expression and because SOX was designed with a T7 promoter; DH5α cells do not produce the T7 polymerase required to express SOX whereas BL21-DE3 cells do in the presence of IPTG.
To prepare SOX for testing, cell cultures were grown following this protocol to step 4. The protocol used for CFPS extract preparation [LINK IT] was then followed. SDS-PAGE gel electrophoresis of the samples was done to check for SOX expression. 1 ml of each culture was lysed with lysozyme and incubated at room temperature before being boiled at 100°C for 10 minutes. 20 µl samples were loaded into each lane. At this point, an error was spotted with the size of SOX on the SDS-PAGE gel (Figure 2).
The band was approximately 7 kDa too small. It was then discovered that the sequence synthesised as a gBlock was different to the original sequence found online; parts of the sequence were missing. A new gBlock with the correct sequence was synthesised and the above methods for assembly and preparation for testing were repeated (Figure 3).
To test for the presence of formaldehyde, and to demonstrate this part works, larger cultures were grown following the aforementioned protocols, and the cells harvested, washed and lysed by sonication. 0 µl, 20 µl, 200 µl and 2 ml of Glyphosate at 10 mg/L concentration was added to the cell lysate and incubated at 37°C. Every 2.5 hours the lysate was tested for the presence of formaldehyde with commercial formaldehyde testing strips.
After 8 hours of testing and left overnight, none of the samples had produced formaldehyde according to the testing strips. The testing strips detect a minimum formaldehyde concentration of 10 mg/L, so it was possible that formaldehyde had been produced but that there was too little of it to detect with the strips.
We decided to add Sarcosine instead of Glyphosate to determine whether the part was working. Everything was repeated the same but instead we added 0 µl, 50 µl and 200 µl of Sarcosine at 0.9 g/50 ml.

This shows SOX works as expected, however there is leaky expression as formaldehyde is produced when no IPTG is added.
Characterisation
To determine whether SOX had been successfully expressed after adding IPTG we performed an SDS-Page gel. After inducing, harvesting and washing the cells 1 ml was taken from each culture to be loaded into the gel. The cells were lysed using lysozyme and boiled for 3 minutes at 100°C loading 10 µl into the gel (Figure 3) or lysed using lysozyme and boiled for 10 minutes at 100°C loading 20 µl into the gel (Figure 2). In both SDS-Page gels of the incorrect and correct SOX sequences (Figures 2 and 3 respectively) a band is present in the lanes that have been loaded with SOX induced with IPTG. Figure 5 shows that SOX works as expected, producing formaldehyde, however formaldehyde is produced even when SOX expression has not been induced with IPTG, indicating leaky expression.
Conclusions and Future Work
E. coli cells naturally have the C-P lyase pathway which degrades glyphosate into sarcosine. The fact that no formaldehyde was produced when glyphosate was added, but was when sarcosine was added, indicates that we have not overexpressed the C-P lyase pathway enough to produce enough sarcosine for SOX to convert into formaldehyde to be detected.
References
Ling YP, Heng LY (2010). A Potentiometric Formaldehyde Biosensor Based on Immobilization of Alcohol Oxidase on Acryloxysuccinimide-modified Acrylic Microspheres. Sensors 10:9963-9981. Trickey P, Wagner MA, Jorns MS, Mathews FS (1999). Monomeric sarcosine oxidase: structure of a covalently flavinylated amine oxidizing enzyme. Structure 7:331-345.
Synthetic Promoter Library
BioBricks used: BBa_J61002 (Arkin Lab 2006)
Rationale and Aim
The Sensynova multicellular biosensor platform has been developed to overcome the limitations identified by our team [hyperlink to human practices] that hamper the success in biosensors development. One of these limits regards the lack of modularity and reusability of the various components. Our platform design, based on the expression of three main modules (Detector, Processor and Output) by three E.coli strains in co-culture, allows the switch of possible variances for each module and the production of multiple customised biosensors. This section of the project is based on testing the modularity of the system by replacing the IPTG sensing unit present in the Sensynova platform with various synthetic promoters that are regulated by small molecules.
Background Information
Promoter libraries can be created by varying many different as-pects of a wildtype promoter such as the upstream element prior to the -35 region, the downstream element, after the -10 region prior to -1, and its core sequence, between the -35 and -10 regions (Schlabach et al., 2010). In this study, we propose to use the PLac promoter sequence as our wildtype for creating promoter designs varying different areas of its sequence. One of such variation will be the substitution of the -35 and -10 currently found in PLac with the -35 (TTGACA) and -10 (TATAAT) regions found to be the most commonly occurring in E. coli natural promoters (Hawley and McClure, 1983, DeBoer, 1985, Harley and Reynolds, 1987). These were chosen to be the constant region between different promoter designs.

Figure 1: Graph Indicating the Most Frequent -35 and -10 Regions Found in E. coli Promoters. This image was taken from Harley and Reynolds (1987).
By analyzing the findings of Harley and Reynolds (1987) and Lisser and Margalit (1993), the decision to vary the number of base pairs in the region present between the -35 and -10 elements to 17 base pairs instead of the 18 present in the wildtype PLac. Variations of the upstream and downstream regions where the lac operon would normally bind to will also be investigated in this study by the production of three different promoter designs resulting in a diverse promoter library.

Figure 2: Graph Indicating the Most Frequent Spacer Between -35 and -10 Regions Found in E. coli Promoters. This image was taken from Harley and Reynolds (1987).
Design Stage
As seen in the image above (Image 3B), the regions known to be important for a reliable promoter expression (-35 and -10 regions) were changed to variant of the wildtype but kept constant between the three distinctive designs. These regions were discovered to be the most frequent occurring -35 and -10 regions in native E. coli promoters by Harley and Roberts in 1987. The sequences between such converged regions were kept constant as per the wildtype for designs 2 (P2) and 3 (P3). For design 1 (P1) however, they were randomized in order to test its effect. The decision to reduce the number of base pairs from 18, found in PLac, to 17 was made due to the results of the study by Harley and Roberts in 1987, listing this number to be the most frequent occurring number of base pairs gap found in regions in native E. coli promoters.
Design 1 (P1) was made by randomizing all elements of the promoter while only keeping the -35 and -10 regions constant. The upstream element (US element) of P2 were randomized while keeping the downstream element (DS element) conserved as per wildtype. The DS element of P3 however, was randomized while keeping the upstream element conserved. This systematic approach of randomization was chosen as it allows for the most variation between promote designs allowing for a rich synthetic promoter library.

Figure 3: Image Detailing Promoter Designs.
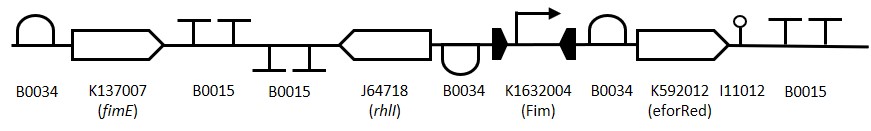
In order to implement these synthetic promoter detector variants into the Sensynova platform, designs were made by replacing the IPTG detection module of our framework with the promoter library.

Figure 4: SBOL Visual Detailing Detector Promoter Variants
Implementation
Text goes here.
Conclusions and Future Work
Due to time constraints, we lacked the time to characterise these parts into the Sensynova platform within the lab.
References
Becker, N., Peters, J., Lionberger, T. and Maher, L. (2012). Mechanism of promoter repression by Lac repressor–DNA loops. Nucleic Acids Research, 41(1), pp.156-166.
Arsenic Biosensor
BioBricks used: BBa_J33201(Edinburgh ), BBa_K2205022 (New)
Rationale and Aim
The Sensynova multicellular biosensor platform has been developed to overcome the limitations identified by our team that hamper the success in biosensor development. One of these limits regards the lack of modularity and reusability of the various components. Our platform design, based on the expression of three main modules (Detector, Processor and Reporter) by three E. coli strains in co-culture, allows the switch of possible variances for each module and the production of multiple customised biosensors. This section of the project is based on testing the modularity of the system by replacing the IPTG detector part of the Sensynova design with different detecting parts. In particular, an Arsenic sensing part will be used.
Background Information
The part BBa_J33201 was made by the Edinburgh team in 2006.

This part consists of the promoter of the E. coli JM109 chromosomal arsenic detoxification operon (ars operon), including the ArsR repressor binding site and the arsR gene encoding the arsR repressor protein, together with its ribosome binding site. Addition of any other genes to the 3' end of this part will result in their expression being dependent on the presence of sodium arsenate or sodium arsenite. Arsenite or arsenite anion binds to the repressor protein ArsR, resulting in inability to repress the promoter. Based on our experiments, a concentration of 1 micromolar sodium arsenate in LB is sufficient for essentially full expression, though this will vary according to conditions.
Design Stage

|

Implementation
In order to introduce the Arsenic sensing part in the Sensinova framework, the part BBa_K2205008 containing the RBS B0034, the lasI coding sequence and the double terminator B0015 has been included in the design. The new part BBa_K2205022 presents biobrickable suffix and prefix and has been designed to have specific overhangs to be assembled in the plasmid pSB1C3 by Gibson assembly method. The part has been obtained by gBlock synthesis from IDT and subsequently assembled into the plasmid using NEB HI-Fi kit. The assembly mix was heat-shock transformed in competent DH5α and plated on Chloramphenicol LB plates. The colonies were tested through colony PCR and confirmed by sequencing.

In the presence of arsenic, the repression will be avoided by binding the repressor ArsR This bound allows the transcription of the downstream gene, lasI. This gene encodes for the quorum sensing molecule C12, which acts as a connector to the processing cell.
Characterisation
Qualitative assay. Due to time constraints only a preliminary qualitative assay was carried out. Co-cultures of Arsenic detector, processor unit and 3 different reporter modules carrying 2 chromoproteins (Chromoproteins link)(BBa_K2205016, BBa_K2205018)and sfGFP(BBa_K2205015) were inoculated and grown overnight in LB+chloramphenicol (12,5ng/ul). The day after the cultures were diluted at OD600: 0,1 and mixed together to obtain co-cultures with ratio 1:1:13 (detector:processor:reporter). The samples were supplemented with different concentration of Arsenic(0ppb, 10ppb, 50ppb, 100ppb) to induce the expression of quorum sensing molecules and eventually achieve the chromoproteins visualisation (Figures 6, 7, 8).


|


|


|
The preliminary qualitative assay above shows that there is no significant difference among the samples when inoculated with Arsenic in different concentrations and the controls (no Arsenic). Optimisation of the Arsenic detection into the Sensynova framework is required.
Conclusions and Future Work
The results demonstrate that further characterisation needs to be conducted in order to optimise the Arsenic detector variant in the Sensynova platform. However, due to time constraints, we adapted the IPTG framework modelling results to the preliminary experiments conducted for the framework customised as the Arsenic biosensor. In order for future characterisation of this part, the model should be modified in order to guide in vivo efforts accordingly.
References
Brenner, K., Karing, D., Weiss, R. & Arnold, F. (2007) Engineered bidirectional communication mediates a consensus in a microbial biofilm consortium Proc Natl Acad Sci U S A 104(44): 17300 - 17304 de Mora K, Joshi N, Balint BL, Ward FB, Elfick A, French CE. A pH-based biosensor for detection of arsenic in drinking water. Anal Bioanal Chem. 2011 May; 400(4):1031-9. Epub 2011 Mar 27.
Psicose Biosensor (Evry Paris-Saclay Collaboration)
BioBricks used: BBa_K2205023 (New), BBa_K2448006 (Evry Paris-Saclay 2017), BBa_K2448011 (Evry Paris-Saclay 2017)
Rationale and Aim
The Sensynova multicellular biosensor platform has been developed to overcome the limitations identified by our team that hamper the success in biosensor development. One of these limits regards the lack of modularity and reusability of the various components. Our platform design, based on the expression of three main modules (Detector, Processor and Output) by three E.coli strains in co-culture, allows the switch of possible variances for each module and the production of multiple customised biosensors. This section of the project is based on testing the modularity of the system by implementing the biosensor created by the 2017 Evry Paris-Saclay iGEM team into the Sensynova platform as part of our collaboration requirement.
Background Information
This biosensor was designed, made and submitted to the iGEM registry by the Evry Paris-Saclay 2017 team. We chose to use this system as a variant to the IPTG detector module present in the Sensynova platform in order to fulfil the requirement of collaborating with another iGEM team. The image below, provided to us by the Evry Paris-Saclay 2017 team, details the psicose biosensor design. It features the PLac derivative promoter PTAC (BBa_K180000), a RBS (BBa_B0034), the PsiR coding sequence, the terminator (BBa_B0015), the synthetic promoter pPsitac, a RBS (BBa_B0034), a mCherry coding sequence and finally the terminator (BBa_B0015) flanked by the iGEM prefix and suffix.

The inducible system works as detailed in the diagram below. When pTAC is induced due to the presence of IPTG, PsiR is transcribed and binds to the pPsitac promoter repressing the transcription of the mCherry protein. When psicose is present, the sugar binds to PsiR, freeing up the promoter and subsequently the colour output

Design Stage
In order to implement the psicose biosensor variant to the Sensynova platform, a design was created by replacing the IPTG sensing system in the original detector module with the construct detailed above, creating part K2205023. We chose to replace the PTAC promoter with the constitutive promoter present within the platform in order to eliminate the need for induction with IPTG. In place of the colour output present in the Evry Paris-Saclay design, we have added our part K2205008, which produces our first connector in order to trigger a response from following modules of the Sensynova platform.

Part K2205023 detailed above was designed using Benchling and ordered for synthesis through IDT. Using Benchling, virtual digestions and ligations were simulated resulting in the plasmid map detailed below.

Implementation
The Psicose detector construct obtained by gBlock synthesis has been designed to include required overhangs for Gibson assembly into the linearized plasmid pSB1C3. The plasmid backbone was acquired by digestion [Protocol link] of the part K2205015 with XbaI and SpeI, cutting out the original sfGFP construct. The Psicose detector construct was assembled into the plasmid backbone using the NEB Hi-Fi kit [Protocol link] and transformed into DH5α E. coli cells [Protocol link]. Colony PCR [Protocol link] was performed to check ligations. Colonies picked for this protocol were streaked onto a LB-agar plate. Colonies picked from streaked plates and cultures were prepared for miniprepping [Protocol link]. DNA samples were then sent off for sequencing [Website link] to ensure that the constructs were correct.
Characterisation
A preliminary qualitative assay was carried out as an initial test for this construct. Co-cultures of Psicose detector, processor unit and sfGFP reporter(BBa_K2205015) were inoculated and grown overnight in LB+chloramphenicol (12,5ng/ul). The day after the cultures were diluted at OD600: 0,1 and mixed together to obtain co-cultures with ratio 1:1:13 (detector:processor:reporter). The samples were supplemented with 33.22 mM Psicose to induce the expression of quorum sensing molecules and eventually achieve the reporter visualisation (Figures 8).

Conclusions and Future Work
The results demonstrate that further characterisation needs to be conducted in order to optimise the psicose detector variant in the Sensynova platform however, due to time constraints resulted from synthesis delays, we lacked the time to be able to do so. The preliminary experiments conducted for the framework customised as the psicose biosensor were conducted by following data resulted from the model of the framework customised as the IPTG sensor. In order for future characterisation of this part, the model should be modified in order to guide in vivo efforts accordingly. We also lacked the time to co-culture this part with the Sensynova platform's multiple modules in order for the creation of variants for the Evry Paris-Saclay. The part BBa_K2205023, the Evry Paris-Saclay's psicose biosensor system as the detecting unit of the platform, has been submitted to the iGEM registry for future work and characterisation by future teams.
References
iGEM Community. (2017). Team Evry Paris-Saclay 2017. [online] Available at: https://2017.igem.org/Team:Evry_Paris-Saclay [Accessed 30 Oct. 2017].
Formaldehyde
BioBricks used:
Rationale and Aim
Background Information
Design Stage
Implementation
Conclusions and Future Work
References