Difference between revisions of "Team:Tianjin/Model"
| Line 546: | Line 546: | ||
<h4>Modeling of the expression of Gene(Cd)</h4> | <h4>Modeling of the expression of Gene(Cd)</h4> | ||
| − | + | <hr> | |
<p>The process is similar to the process of the expression of gene(Cu).</p> | <p>The process is similar to the process of the expression of gene(Cu).</p> | ||
| Line 564: | Line 564: | ||
<h4>Simulation results</h4> | <h4>Simulation results</h4> | ||
| − | + | <hr> | |
<p>The simulation results of the model are shown in the figure above, and the concentration of Cu protein in the initial stage of simulation is still increased due to the presence of mRNA. After the reduction of DNA (Cu) and degradation of mRNA (Cu), Cu protein will gradually disappear. Cr protein is very slow in the beginning due to lack of initial DNA (Cr), and then the Cr protein gradually increases due to the accumulation of DNA (Cr), and then the number gradually becomes stable.</p> | <p>The simulation results of the model are shown in the figure above, and the concentration of Cu protein in the initial stage of simulation is still increased due to the presence of mRNA. After the reduction of DNA (Cu) and degradation of mRNA (Cu), Cu protein will gradually disappear. Cr protein is very slow in the beginning due to lack of initial DNA (Cr), and then the Cr protein gradually increases due to the accumulation of DNA (Cr), and then the number gradually becomes stable.</p> | ||
<div class="zxx_zoom_demo" align="center"> | <div class="zxx_zoom_demo" align="center"> | ||
| Line 604: | Line 604: | ||
</div> | </div> | ||
<div class="collapse-card__body"> | <div class="collapse-card__body"> | ||
| − | <h4>Overview</h4> | + | <h4>Overview</h4><hr> |
<p> In our experiment we use engineered yeast cells to absorb and enrich heavy metals such as cooper and cadmium. At first, heavy metal ions diffuse into the cell surface from the liquid phase body, and then heavy metal ions are combined with those heavy metal-treated proteins inside the yeast cells.</p> | <p> In our experiment we use engineered yeast cells to absorb and enrich heavy metals such as cooper and cadmium. At first, heavy metal ions diffuse into the cell surface from the liquid phase body, and then heavy metal ions are combined with those heavy metal-treated proteins inside the yeast cells.</p> | ||
| Line 620: | Line 620: | ||
| − | <h4>Summary</h4> | + | <h4>Summary</h4><hr> |
<p>Treating heavy metal pollution by means of biosorption is a complicated process. First, it is very meaningful to study the growth of yeast in heavy metal ions solution. Considering that the toxic effects of heavy metal ions on yeast can’t be ignored, we use the matrix inhibition growth model to simulate the growth kinetics of yeast in heavy metal ions solution. Next, we decide to study the process of biological adsorption from the thermodynamic and kinetic point of view. In terms of thermodynamics, we use the basic thermodynamic function to explain the adsorption process, and the conclusions can guide further optimization of the biosorption in addition, different static adsorption models are used to simulate the adsorption process, and the conclusions are able to explain the mechanism of the part of the biosorption process. Then we discuss the change of heavy metal ions with time in the process of biosorption from the point of view of dynamics, and compare with the actual measured data.</p> | <p>Treating heavy metal pollution by means of biosorption is a complicated process. First, it is very meaningful to study the growth of yeast in heavy metal ions solution. Considering that the toxic effects of heavy metal ions on yeast can’t be ignored, we use the matrix inhibition growth model to simulate the growth kinetics of yeast in heavy metal ions solution. Next, we decide to study the process of biological adsorption from the thermodynamic and kinetic point of view. In terms of thermodynamics, we use the basic thermodynamic function to explain the adsorption process, and the conclusions can guide further optimization of the biosorption in addition, different static adsorption models are used to simulate the adsorption process, and the conclusions are able to explain the mechanism of the part of the biosorption process. Then we discuss the change of heavy metal ions with time in the process of biosorption from the point of view of dynamics, and compare with the actual measured data.</p> | ||
| − | <h4>Yeast growth model</h4> | + | <h4>Yeast growth model</h4><hr> |
<p>Heavy metal ions inhibit the growth of yeast. In order to describe the kinetics of cell growth accurately,these factors should be taken into account. Unlike the traditional Monod equation, Andrew equation takes the presence of matrix anticompetitive inhibition into consideration.</p> | <p>Heavy metal ions inhibit the growth of yeast. In order to describe the kinetics of cell growth accurately,these factors should be taken into account. Unlike the traditional Monod equation, Andrew equation takes the presence of matrix anticompetitive inhibition into consideration.</p> | ||
<p> | <p> | ||
| Line 659: | Line 659: | ||
<p> </p> | <p> </p> | ||
<p>Taking the presence of matrix inhibition into consideration, when the concentration of heavy metal ions is low, the cell growth rate increases with the increase of heavy metal ions concentration and could reach the maximum value. When the heavy metal concentration continues to increase, the cell growth rate decreases. But when there is no matrix inhibition (Monod equation), the cell growth rate increases with the concentration of the matrix until it approaches the maximum value \({\mu _{\max }}\)</p> | <p>Taking the presence of matrix inhibition into consideration, when the concentration of heavy metal ions is low, the cell growth rate increases with the increase of heavy metal ions concentration and could reach the maximum value. When the heavy metal concentration continues to increase, the cell growth rate decreases. But when there is no matrix inhibition (Monod equation), the cell growth rate increases with the concentration of the matrix until it approaches the maximum value \({\mu _{\max }}\)</p> | ||
| − | <h4>Thermodynamics of Adsorption of Heavy Metals</h4> | + | <h4>Thermodynamics of Adsorption of Heavy Metals</h4><hr> |
<p>In order to study the ability of yeast to treat the pollution of heavy metal, we quantify the process of biosorption from a thermodynamic point of view. Therefore the conception of separation constant Kc is introduced to measure the equilibrium concentration ratio of intracellular and liquid heavy metal ions. </p> | <p>In order to study the ability of yeast to treat the pollution of heavy metal, we quantify the process of biosorption from a thermodynamic point of view. Therefore the conception of separation constant Kc is introduced to measure the equilibrium concentration ratio of intracellular and liquid heavy metal ions. </p> | ||
<p>\[{K_c} = \frac{{{C_i}}}{{{C_l}}}\]</p> | <p>\[{K_c} = \frac{{{C_i}}}{{{C_l}}}\]</p> | ||
| Line 691: | Line 691: | ||
<p>If \(\Delta H\) > 0,the absorption process can be judged as an endothermic process,vice versa. Besides, the size of the enthalpy variable value can also be used to distinguish between physical adsorption and chemical adsorption. (\Delta S\)>0 indicates that the molecular disorder increases during this adsorption process, and vice versa. (\Delta G\) <0 means that the adsorption process can be carried out spontaneously.</p> | <p>If \(\Delta H\) > 0,the absorption process can be judged as an endothermic process,vice versa. Besides, the size of the enthalpy variable value can also be used to distinguish between physical adsorption and chemical adsorption. (\Delta S\)>0 indicates that the molecular disorder increases during this adsorption process, and vice versa. (\Delta G\) <0 means that the adsorption process can be carried out spontaneously.</p> | ||
<h4>Model of Adsorption process</h4> | <h4>Model of Adsorption process</h4> | ||
| + | <hr> | ||
<p>Static adsorption<br> | <p>Static adsorption<br> | ||
Define the equilibrium adsorption capacity of yeast for heavy metal ions q</p> | Define the equilibrium adsorption capacity of yeast for heavy metal ions q</p> | ||
| Line 752: | Line 753: | ||
<p>Scatchard curve is</p> | <p>Scatchard curve is</p> | ||
<p>\[\frac{{[MX]}}{{{M_e}}} = K({X_0} - [MX])\]</p> | <p>\[\frac{{[MX]}}{{{M_e}}} = K({X_0} - [MX])\]</p> | ||
| − | <h4> Biomass adsorption kinetics</h4> | + | <h4> Biomass adsorption kinetics</h4><hr> |
<p>The biosorption process can be divided into two stages. The first stage occurs on the cell wall surface, and is mainly about the physical adsorption and ion exchange process which is going very fast. The second stage, also known as active adsorption,is mainly about chemical adsorption, and metal ions at this stage can be transported through the active into the cell. This stage consumes the energy generated by cell metabolism, which is carried out very slowly.<br> | <p>The biosorption process can be divided into two stages. The first stage occurs on the cell wall surface, and is mainly about the physical adsorption and ion exchange process which is going very fast. The second stage, also known as active adsorption,is mainly about chemical adsorption, and metal ions at this stage can be transported through the active into the cell. This stage consumes the energy generated by cell metabolism, which is carried out very slowly.<br> | ||
Puranik and Paknikar describe the adsorption kinetics quantitatively in mathematical models. This mathematical model is based on the following two assumptions: | Puranik and Paknikar describe the adsorption kinetics quantitatively in mathematical models. This mathematical model is based on the following two assumptions: | ||
| Line 815: | Line 816: | ||
With this goal, the first thing we needed to do is using computational method simulate the biological process and figure out whether our design is feasible. | With this goal, the first thing we needed to do is using computational method simulate the biological process and figure out whether our design is feasible. | ||
</p> | </p> | ||
| − | <h4>The kinetic model in the single cell </h4> | + | <h4>The kinetic model in the single cell </h4><hr> |
<p>The first of these biological processes is the expression of transcription factor ACE1 which contains two steps: transcription and translation.<br> | <p>The first of these biological processes is the expression of transcription factor ACE1 which contains two steps: transcription and translation.<br> | ||
The transcription step can be described as following ODEs (ordinary differential equations):<br> | The transcription step can be described as following ODEs (ordinary differential equations):<br> | ||
| Line 862: | Line 863: | ||
\(D\)is thickness of absorption vessel;<br> | \(D\)is thickness of absorption vessel;<br> | ||
\(E\)is moral factor of fluorescence microplate.<br> | \(E\)is moral factor of fluorescence microplate.<br> | ||
| − | <h4>The Result and analysis of modeling</h4> | + | <h4>The Result and analysis of modeling</h4><hr> |
<p>These constants above can be found in the reference. | <p>These constants above can be found in the reference. | ||
| Line 914: | Line 915: | ||
<p> | <p> | ||
Compared with the real condition we measured,it is very similar to the real condition except in the final stage the real condition concentration is going to decrease.</p> | Compared with the real condition we measured,it is very similar to the real condition except in the final stage the real condition concentration is going to decrease.</p> | ||
| − | <h4>SUMMARY</h4> | + | <h4>SUMMARY</h4> <hr> |
<p>We construct the model of RFP expression in the single cell stage with molecular analysis. The result is similar with the real condition. This model can help us to confirm that the CUP1 promoter is effective to be induced by copper ions. It also can help us to confine the best concentration of copper ions to induce and the maximum expression quantity in a certain copper ions concentration. | <p>We construct the model of RFP expression in the single cell stage with molecular analysis. The result is similar with the real condition. This model can help us to confirm that the CUP1 promoter is effective to be induced by copper ions. It also can help us to confine the best concentration of copper ions to induce and the maximum expression quantity in a certain copper ions concentration. | ||
</p> | </p> | ||
| Line 936: | Line 937: | ||
<div class="collapse-card__body"> | <div class="collapse-card__body"> | ||
<p>This part is not common in modeling, because this part is not a model of our biological system to simulate and predict its behavior. What we do in this part is an assessment of its value and scope of use of our biological systems. In addition, we get a preliminary database of copper and cadmium pollution in the world through the data collection, which is also within the scope of modeling. In this part, we work with teammates who are responsible for human practice to carry out the main work of data collection and map processing. Because different countries and regions have different monitoring and treatment methods for copper and cadmium pollution, and many countries and regions even lack of monitoring and treatment methods of copper and cadmium pollution, we spent a lot of time to collect data. Even so, we did not collect enough data to conduct detailed data analysis of copper and cadmium pollution worldwide. Nevertheless, our existing work can still lead to some preliminary and regional results for the pollution of copper and cadmium.</p> | <p>This part is not common in modeling, because this part is not a model of our biological system to simulate and predict its behavior. What we do in this part is an assessment of its value and scope of use of our biological systems. In addition, we get a preliminary database of copper and cadmium pollution in the world through the data collection, which is also within the scope of modeling. In this part, we work with teammates who are responsible for human practice to carry out the main work of data collection and map processing. Because different countries and regions have different monitoring and treatment methods for copper and cadmium pollution, and many countries and regions even lack of monitoring and treatment methods of copper and cadmium pollution, we spent a lot of time to collect data. Even so, we did not collect enough data to conduct detailed data analysis of copper and cadmium pollution worldwide. Nevertheless, our existing work can still lead to some preliminary and regional results for the pollution of copper and cadmium.</p> | ||
| − | <h4>Data collection</h4> | + | <h4>Data collection</h4><hr> |
<p>As the United States for the detection and processing of pollution is better, we firstly start from the United States to collect data. We find the National Aquatic Resource Surveys in the EPA (United States Environmental Protection Agency) website. There are four national assessments in NARS: National Coastal Condition Assessment (NCCA), National Lakes Assessment (NLA), National Rivers and Streams Assessment (NRSA), National Wetland Condition Assessment (NWCA). Only the NWCA has the data of copper and cadmium, so we use it as one of the data sources of our maps. The methods and standards used in NWCA are shown in EPA websites.</p> | <p>As the United States for the detection and processing of pollution is better, we firstly start from the United States to collect data. We find the National Aquatic Resource Surveys in the EPA (United States Environmental Protection Agency) website. There are four national assessments in NARS: National Coastal Condition Assessment (NCCA), National Lakes Assessment (NLA), National Rivers and Streams Assessment (NRSA), National Wetland Condition Assessment (NWCA). Only the NWCA has the data of copper and cadmium, so we use it as one of the data sources of our maps. The methods and standards used in NWCA are shown in EPA websites.</p> | ||
<p>The methods we used to collect European data is similar to that of the United States. We use the FOREGS-EuroGeoSurveys Geochemical Baseline Database as one of data sources of our maps. The methods and standards used are shown in FOREGS-EuroGeoSurveys Geochemical Baseline Database websites.<p> | <p>The methods we used to collect European data is similar to that of the United States. We use the FOREGS-EuroGeoSurveys Geochemical Baseline Database as one of data sources of our maps. The methods and standards used are shown in FOREGS-EuroGeoSurveys Geochemical Baseline Database websites.<p> | ||
| Line 953: | Line 954: | ||
| − | <h4>Map Drawing</h4> | + | <h4>Map Drawing</h4><hr> |
<p>We stored data we collected as .mat file in MATLAB, and then we use the worldmap and our map drawing command to draw our Global Cu and Cd Pollution Map.</p> | <p>We stored data we collected as .mat file in MATLAB, and then we use the worldmap and our map drawing command to draw our Global Cu and Cd Pollution Map.</p> | ||
| Line 1,027: | Line 1,028: | ||
<p style="text-align:center">The pollution of copper worldwide</p> | <p style="text-align:center">The pollution of copper worldwide</p> | ||
| − | <h4>Analysis of Global Cu and Cd Pollution Map</h4> | + | <h4>Analysis of Global Cu and Cd Pollution Map</h4><hr> |
<p>From the pollution map we can see the following:<br> | <p>From the pollution map we can see the following:<br> | ||
Revision as of 12:24, 1 November 2017
/* OVERRIDE IGEM SETTINGS */
Model
Overview
The models we built included five parts. First, We established a bistable model to analyze the feasibility of functional switch of cells. Then, We used software to model and simulate the functional switch process after cell mating. And we built a RFP expression model to simulate the expression RFP in yeast cells with CUP1 promoter. What’s more, we constructed a model of adsorption to simulate the combination of heavy metal ions and heavy metal-treated proteins inside the yeast cells. Finally, we worked with teammates of human practice to draw the Global Cu and Cd Pollution Map and established a preliminary World Copper and Cadmium Pollution Database.
Construction of Bistable Model
Bistability is a common phenomenon in single-cell microbes, where two types of cell phenotype coexist. Bistability is very important for many single-cell microbes adapting to environmental changes. Single-cell microbes can choose the appropriate form according to changes of the environment, and bistability is the basis for achieving this change.
The reason for the existence of bistability in single-cell microbes is complex, and it is generally thought to be related to the positive feedback of the gene network. We simulate the bistability in single-celled microbes by establishing a simplified gene regulation model.
\(y\) represents the concentration of the bistable substance, \(x\) is the activator of \(y\), which promotes the expression of the \(y\) gene to increase the concentration of \(y\), and \(R\) is the intracellular inhibitor of \(y\), whose concentration is in accordance with Hill Function. Establish the following equation(1):
\[ \begin{cases} \frac{R}{R_{T}}=\frac{1}{1+{(x/x_{0})}^{n}}; \\ \tau_{x} \frac{dx}{dt}=\beta y-x; \\ \tau_{y}\frac{dy}{dt}=\alpha \frac{1}{1+R/R_{0}}-y; \end{cases} \]
Here \(R\) represents the concentration of the active inhibitory factor, \(R_{T}\) representing the total concentration, \(n\) is the Hill coefficient, \(x_0\) is the concentration at which the activation rate reaches the half, and the generation of \(y\) is described by the Michaelis-Menten equation, \(\tau_x\) 、\(\tau_y\) is the average survive time.
Under normal circumstances, the cells will be in a steady state, then the derivative of time on the equation (1) is zero, we can get equation (2):
\[ y=\frac{1+{(\beta y)}^{n}}{1+RT/R_{0}+{(\beta y)}^{n}} \]
Note that all of these formulations of derivation of Hill function from mass action kinetics assume that the protein has n sites to which ligands can bind. In practice, however, the Hill Coefficient n rarely provides an accurate approximation of the number of ligand binding sites on a protein.[2] We assume that the Hill Coefficient is 2 according to experience.
We can get the following cubic equation form equation(2), we can get equation(3)
\[ \begin{cases} y^3-ay^2+(\rho /{\beta}^2)y-(\alpha /{\beta}^2)=0 \\ \rho=1+R_{T}/R_{0} \\ \end{cases} \]
For the cubic equation, there can be 1, 2, 3 positive real solutions, to achieve the bistability in this model, the function should have two solutions, we assume that the equation form is equation(4):
\[ (y-a)^{2}(y-ka)=y^3-(2+k)ay^2+(1+2k)a^2y-ka^3=0 \]
Comparing equations 3 and 4, we can get the following parametric equation(5):
\[ \begin{cases} \rho=(1+2k)(1+2/k) \\ \alpha \beta=(2+k)^{1.5}k^{-0.5} \\ \end{cases} \]
Draw the parameters equation, we can be obtained under the range of parameters in bistability:

Fig.2.1.parameter equation of \(\alpha \rho\) and \(\rho \)

The two curves are the bistable curves we want, and between the two curves the cells can achieve bistability.

Fig.2.2.parameter equation of \(\frac{\alpha \beta}{\beta}\) and \(\frac{1}{\rho} \)

The above result is obtained by the equation (1) assuming that the cell is in a steady state, and the stability analysis is given below for equation (1)
Let \(x^{*}\) and \(y^{*}\) represent stability:
\[ x=x^{'}+x^{*};y=y^{'}+y^{*} \]
Combine equation (1), we can get equation(5):
\[ \begin{cases} \tau_{x}\frac{dx^{'}}{dt}=\beta y^{'}-x^{'} \\ \tau_{y}\frac{dy^{'}}{dt}=a x^{'}-y^{'} \\ \end{cases} \]
In this equation:
\[ a=\frac{\partial}{\partial x}(\alpha\frac{1}{1+R/R_{0}})|_{x=x^{*}}=\frac{\partial}{\partial x}(\alpha\frac{1}{{1+(x/x_{0})}^n})|_{x=x^{*}} \]
According to the steady state theory of ordinary differential equations, the equilibrium point is stable if the eigenvalues of the coefficient matrix of equation (5) contain negative real parts, we can find the eigenvalues of equation (5)
\[ \lambda_{1,2}=-1\pm\sqrt{\alpha \beta} \]
When \(\alpha \beta \)<1, the equations reach the steady state. Combine the equation with equation(2):
\[ g(x):=a\frac{\beta(1+x^n)}{\rho+x^n}-x=0 \]
When \(\alpha \beta \)<1, \(g(x)^{'}<0\), thus we can judge the stability of the resulting roots of equation(2).
Refernece
[1] Jinzhi Lei. (September 2010). "System Biology: modeling, analysis, simulation". ISBN:754780487X,9787547804872
[2] Weiss, J. N. (1 September 1997). "The Hill equation revisited: uses and misuses.". The FASEB Journal. 11(11): 835–841. ISSN 0892-6638
Modeling of the functional switch
Modeling the functional switch function of yeast cells after mating. After the yeast cells mating, the expression of the functional gene(RCu) is activated, thereby inhibiting the expression of the gene(Cu), and the expression of the downstream gene(Cd) of the inhibited gene(Cu) is activated. As the process involves many genes and the regulatory process is complex, we use Cell Illustrator Online 5.0 to simulate the process.
We build up the model shown in Figure 3.1, the establishing process shows here.

Fig.3.1 Simulation model of functional switch

Modeling of the expression of Gene(Cu)
The rate of transcription and translation depends on the concentration of DNA and mRNA, but the transcription and translation process does not directly consume DNA and mRNA, so in these two processes we use the auxiliary connections. In addition, we establish the self-degradation process of mRNA and Cu protein.

Fig.3.2 Simulation model of gene(Cu) experssion

Modeling of the expression of Gene(RCu)

Fig.3.3 Simulation model of gene(RCu) experssion

We add the substance youdao to our model to simulate the expression of the gene RCu. It has two advantages: youdao's self-degradation process makes the inhibitor gradually self-degraded over time, so you can observe whether the effect of RCu protein on Cu DNA is irreversible; youdao can simulate the influence of the addition of foreign substance to yeast, so as to increase the scope of using of our model.
The rate of transcription and translation depends on the concentration of RCu DNA and RCu mRNA, but the transcription and translation process does not directly consume DNA and mRNA, so in these two processes we use the auxiliary connections. In addition, we establish the self-degradation process of RCu mRNA and RCu protein.
Modeling of the binding of protein(RCu) and DNA(Cu)

Fig.3.4 Simulation model of binding of DNA(Cu) and protein(RCu)

The rate of binding depends on the concentration of DNA(Cu) and protein(RCu), and this process also consumes DNA(Cu) and protein(RCu). After binding, the product will not express the Cu gene and express the Cr gene. THus achieve functional switch.
Modeling of the expression of Gene(Cd)
The process is similar to the process of the expression of gene(Cu).

Fig.3.5 Simulation model of Cd expression

Simulation results
The simulation results of the model are shown in the figure above, and the concentration of Cu protein in the initial stage of simulation is still increased due to the presence of mRNA. After the reduction of DNA (Cu) and degradation of mRNA (Cu), Cu protein will gradually disappear. Cr protein is very slow in the beginning due to lack of initial DNA (Cr), and then the Cr protein gradually increases due to the accumulation of DNA (Cr), and then the number gradually becomes stable.

Fig.3.6 Result of simulation

Technical support from Cell Illustrator Online 5.0.
Construction of Adsorption Model
Overview
In our experiment we use engineered yeast cells to absorb and enrich heavy metals such as cooper and cadmium. At first, heavy metal ions diffuse into the cell surface from the liquid phase body, and then heavy metal ions are combined with those heavy metal-treated proteins inside the yeast cells.

Fig.4.1 mass transportation betwwen yeast and enviroment
Summary
Treating heavy metal pollution by means of biosorption is a complicated process. First, it is very meaningful to study the growth of yeast in heavy metal ions solution. Considering that the toxic effects of heavy metal ions on yeast can’t be ignored, we use the matrix inhibition growth model to simulate the growth kinetics of yeast in heavy metal ions solution. Next, we decide to study the process of biological adsorption from the thermodynamic and kinetic point of view. In terms of thermodynamics, we use the basic thermodynamic function to explain the adsorption process, and the conclusions can guide further optimization of the biosorption in addition, different static adsorption models are used to simulate the adsorption process, and the conclusions are able to explain the mechanism of the part of the biosorption process. Then we discuss the change of heavy metal ions with time in the process of biosorption from the point of view of dynamics, and compare with the actual measured data.
Yeast growth model
Heavy metal ions inhibit the growth of yeast. In order to describe the kinetics of cell growth accurately,these factors should be taken into account. Unlike the traditional Monod equation, Andrew equation takes the presence of matrix anticompetitive inhibition into consideration.
\[\mu = {\mu _{\max }}\frac{S}{{{K_s} + S + \frac{{{S^2}}}{{{{\rm{K}}_{l,s}}}}}}\]
\(\mu \)—— Specific growth rate,\({{\rm{s}}^{ - 1}}\);
\({\mu _{\max }}\)—— Maximum specific growth rate,\({{\rm{s}}^{ - 1}}\);
S ——The concentration of limiting substrate,\(g/L\);
\({K_s}\)——Saturation constants, its value is equal to the concentration of limiting substrate when the specific growth rate is exactly half the maximum specific growth rate,\(g/L\).

Fig.4.2 mass transportation betwwen yeast and enviroment
Taking the presence of matrix inhibition into consideration, when the concentration of heavy metal ions is low, the cell growth rate increases with the increase of heavy metal ions concentration and could reach the maximum value. When the heavy metal concentration continues to increase, the cell growth rate decreases. But when there is no matrix inhibition (Monod equation), the cell growth rate increases with the concentration of the matrix until it approaches the maximum value \({\mu _{\max }}\)
Thermodynamics of Adsorption of Heavy Metals
In order to study the ability of yeast to treat the pollution of heavy metal, we quantify the process of biosorption from a thermodynamic point of view. Therefore the conception of separation constant Kc is introduced to measure the equilibrium concentration ratio of intracellular and liquid heavy metal ions.
\[{K_c} = \frac{{{C_i}}}{{{C_l}}}\]
\({K_c}\): equilibrium concentration;
\({{C_i}}\):the concentration of intracellular heavy metal ions,mol/L ;
\({{C_l}}\):the concentration of liquid heavy metal ions,mol/L ;
According to the definition of Gibbs free energy:
\[\Delta G = \Delta H - T\Delta S\]
\(\Delta H\):Enthalpy change of biosorption process,kJ/mol;
\(\Delta S\):Entropy change of biosorption process,kJ/(mol·s);
\(\Delta G\):Gibbs free energy change in biosorption process,kJ/mol.
According to the Fantherhoff isothermal equation:
\[\ln {K_c} = - (\frac{{\Delta H}}{R})(\frac{1}{T}) + \frac{{\Delta S}}{R}\]
By setting different concerntation gradient for absorption experiments,the data of 1/T and lnKc can be obtained, and the value of H and S can be obtained by linear regression.

Fig.4.3 Linear regression of data 1/T and lnKc
If \(\Delta H\) > 0,the absorption process can be judged as an endothermic process,vice versa. Besides, the size of the enthalpy variable value can also be used to distinguish between physical adsorption and chemical adsorption. (\Delta S\)>0 indicates that the molecular disorder increases during this adsorption process, and vice versa. (\Delta G\) <0 means that the adsorption process can be carried out spontaneously.
Model of Adsorption process
Static adsorption
Define the equilibrium adsorption capacity of yeast for heavy metal ions q
\[q = \frac{{({c_0} - c){V_L}}}{{wk}}\]
\({{c_0}}\) :Initial concentration of copper ions in solution, mg/L;
c : Equilibrium concentration of copper ions in solution, mg/L ;
\({{V_L}}\) : Solution volume, L;
w : Yeast quality at equilibrium, g ;
k : The volume of 1g yeast at equilibrium, L/g.
In order to study the adsorption process of yeast on heavy metal ions, we used Freundich and Langmuir isothermal adsorption equation to fit the adsorption process of yeast on copper ions.
Freundich adsorption equation:
\[{q_e} = k{C_e}^{1/n}\]
Take the logarithm: on both side of equation:
\[\ln {q_e} = \frac{1}{{n\ln {C_e}}} + \ln k \]
Langmuir absorption equation:
\[{q_e} = \frac{{a{q_m}}}{{1 + a{C_e}}}\]
Transform this equation:
\[\frac{{{C_e}}}{{{q_e}}} = \frac{{{C_e}}}{{{q_m}}} + \frac{1}{{a{q_m}}}\]
\({{q_e}}\): Equilibrium adsorption capacity, g / L;
\({{C_e}}\): Equilibrium concentration, mg / L;
k、n、a : Constant;
\({{q_m}}\): Maximum saturated adsorption capacity, g / L.
Use Freundich and Langmuir isothermal adsorption process to match the adsorption process of yeast on copper ions

Fig.4.4 The adsorption isotherm of Freundlich

Fig.4.5 The adsorption isotherm of Langmuir
Since the biosorption process is not a physical adsorption process. Freundlich pays attention to the effects of chemical reactions on the adsorption process, so Freundlich is more suitable for describing the process of bio-adsorbing copper. However, under the condition of low concentration of metal ions, the diffusion rate of ions in the surface of the cell membrane is the speed control step. The Langmuir model is also suitable for describing the process of bio-adsorbing copper because the Langmuir model takes the effect of surface diffusion on adsorption into consideration.
The Scatchard curve can be used to describe the biosorption equilibrium process. This model was originally used to describe the interaction between proteins and small molecules and ions. The equilibrium constant for the interaction of organic matter with the cell surface adsorption point can be expressed by K, and its expression is as follows:
\[K = \frac{{[MX]}}{{[M][X]}}\]
\[M + X{\leftrightarrow}MX\]
M: Heavy metal ions;
X: Number of cell adsorption sites;
MX: Adsorption of heavy metal adsorption particles.
Scatchard curve is
\[\frac{{[MX]}}{{{M_e}}} = K({X_0} - [MX])\]
Biomass adsorption kinetics
The biosorption process can be divided into two stages. The first stage occurs on the cell wall surface, and is mainly about the physical adsorption and ion exchange process which is going very fast. The second stage, also known as active adsorption,is mainly about chemical adsorption, and metal ions at this stage can be transported through the active into the cell. This stage consumes the energy generated by cell metabolism, which is carried out very slowly.
Puranik and Paknikar describe the adsorption kinetics quantitatively in mathematical models. This mathematical model is based on the following two assumptions:
1.During the adsorption process, the concentration of organic matter changed significantly;
2.Ignore the adsorption process occurred in the desorption, that is, adsorption is irreversible.
Puranik and Paknikar On the basis of the above assumptions, the residual concentration is considered to have the following relationship with the adsorption time:
\[\frac{{dc}}{{dt}} = - {K_t}{c_t}[1 - \theta (t)]\]
\({{c_i}}\): The initial concentration; \({c_t}\), : The remaining concentration at time t; \({{c_{eq}}}\) : Balance concentration; \({K_t}\) : Rate constant.
Fig.14.
According to the expression of θ (t), the physical meaning of 1 - θ (t) is that the remaining adsorption sites account for the percentage of total adsorption active sites at time t.
Integral:
\[\ln \frac{{{c_t}}}{{{c_t} - {c_{eq}}}} = \ln \frac{{{c_i}}}{{{c_i} - {c_{eq}}}} + \frac{{{c_t}}}{{{c_t} - {c_{eq}}}}{K_t}t\]
According to the above formula, drawing the curve with the t, rate constant can be obtained from the slope.
In the adsorption column, the adsorption capacity and the adsorption rate constant of the immobilized biosorption particles can be calculated by the kinetic model. Thomas dynamics model is:
\[\frac{{{c_e}}}{{{c_0}}} = \frac{1}{{1 + \exp [\frac{K}{Q}({q_0}M - {c_0}V)]}}\]
\({{c_e}}\): effluent concentration;
\({{c_0}}\): influent concentration;
K: Thomas rate constant;
\({{q_0}}\): maximum adsorption capacity;
M: the quality of the biosorption particles;
V: reactor volume;
Q: flow rate.
The constant K and q0 values obtained from the operating data of the adsorption column can be used to design large scale adsorbent beds.
Construction of RFP expression Model
Overview
Our goal is to simulate the RFP expression of the yeast cell with CUP1 promoter and compare with the wild type yeast which has only a normal promoter and RFP gene. With this goal, the first thing we needed to do is using computational method simulate the biological process and figure out whether our design is feasible.
The kinetic model in the single cell
The first of these biological processes is the expression of transcription factor ACE1 which contains two steps: transcription and translation.
The transcription step can be described as following ODEs (ordinary differential equations):
\[\frac{{d[mACE1]}}{{dt}} = cp{n_{\rm{1}}} \times (tr{c_1} - {\deg _1} \times [mACE1])\]
\([mACE1]\) is the concentration of transcription factor ACE1 mRNA;
\(cp{n_{\rm{1}}}\) is the copy number of ACE1 gene in the genome;
\(tr{c_1}\)is the transcription rate of ACE1 gene;
\({\deg _1}\)is the digestion rate of ACE1 mRNA.
The translation step is described as following ODEs:
\[\frac{{d[ACE1]}}{{dt}} = tr{s_1} \times [mACE1] - {\deg _2} \times [ACE1]\]
\([ACE1]\) is the concentration of transcription factor ACE1;
\(tr{s_1}\)is the translation rate of ACE1 mRNA;
\({\deg _2}\)is the digestion rate of ACE1 transcription factor ACE1;
The following step is ACE1 induced by copper ion and change into active form.
The yeast cell can be seen as the isolated environment. At this condition, the transcription factor molecules are colliding with the copper ions to produce the active transcription factor. It is satisfied with law of mass action. But it is only happened in the condition that the concentration is not higher than a threshold value.
\[ACE{\rm{1 + C}}{{\rm{u}}^{{\rm{2 + }}}}{\leftrightarrow}{\rm{a}}ACE1\]
\[[aACE1] = {k_1} \times [ACE1] \times [C{u^{2 + }}]\]
\([aACE1]\)is the concentration of active transcription factor ACE1;
\({k_1}\)is reaction rate constant.
If it is higher than a threshold value, the concentration of active transcription factor will get decreased.
\[[aACE1] = {k_{\rm{d}}} \times [ACE1] \times {[C{u^{2 + }}]^{{\rm{ - }}1}}\]
\({k_{\rm{d}}}\) is the restrain constant;
The process of combination of transcription factor and promoter and RNA polymerase which drives mRNA transcription can be described as following equation :
\[{\rm{dNTP + DNA + E}}{\leftrightarrow }{\rm{ES}}{\leftrightarrow }DNA + mRNA + E\]
E is the RNA polymerase;
K2 is the reaction rate constant of combination ;
K3 is the reaction rate constant of transcription;
The process can be seen as the kinetics of an enzymatic reaction in Michaelis–Menten kinetics model. The reaction rate can be described as :
\[{{\rm{V}}_{}}{\rm{ = }}\frac{{{{\rm{V}}_{\max }}[aACE1]}}{{{k_m} + [aACE1]}}\]
\({{\rm{V}}_{\max }}\)is the maximum reaction rate;
\({k_m}\) is Michaelis–Menten kinetics constant of this reaction.
It is according to the Michaelis–Menten kinetics equation. So the concentration of RFP mRNA can be described as following delaying differential equation:
\[\frac{{d[mRFP]}}{{dt}} = cp{n_2} \times \left( {\frac{{{{\rm{V}}_{\max }}[aACE1](t - \tau )}}{{{k_m} + [aACE1](t - \tau )}}} \right) - {\deg _3} \times [mRFP]\]
\([mRFP]\)is the concentration of RFP mRNA;
\(\tau \) is the delaying time factor;
\(cp{n_2}\)is the copy number of RFP in genome;
\({\deg _3}\) is the rate of RFP digestion.
So the quantity of RFP expression can be described as following:
\[\frac{{d[RFP]}}{{dt}} = tr{s_2} \times [mRFP] - {\deg _4} \times [RFP]\]
\([RFP]\)is the concentration of RFP;
\(tr{s_2}\)is the translation rate of mRNA;
\({\deg _4}\)is the digestion rate of RFP.
The fluorescence microplate is used to measure the quantity of RFP expression. The concentration of RFP is described by the absorption photometry in the 587 nm .
\[OD = [RFP] \times D \times E\]
\(OD\)is absorption photometry;
\(D\)is thickness of absorption vessel;
\(E\)is moral factor of fluorescence microplate.
The Result and analysis of modeling
These constants above can be found in the reference. Solve the ordinary and delaying differential by MATLAB. Plot the curve of RFP and time. The concentration of Cu is supposed as 0.5 mM.

Fig.5.1 simulate figure of RFP expression
In the figure, the concentration of RFP is growing rapidly with the time going. At final states, it is going to be mild and be a constant.
Change the concentration of 0.5 ,0.05,0 mM. We can get the following figure.

Fig.5.2 simulate figure of RFP expression by different copper ions concentration
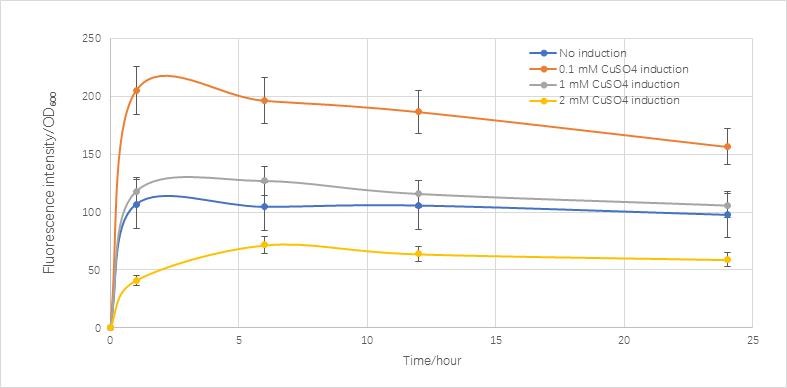
Fig.5.3 real condition of RFP expression induced by copper ions
Compared with the real condition we measured,it is very similar to the real condition except in the final stage the real condition concentration is going to decrease.
SUMMARY
We construct the model of RFP expression in the single cell stage with molecular analysis. The result is similar with the real condition. This model can help us to confirm that the CUP1 promoter is effective to be induced by copper ions. It also can help us to confine the best concentration of copper ions to induce and the maximum expression quantity in a certain copper ions concentration.
Construction of Global Cu and Cd Pollution Map
This part is not common in modeling, because this part is not a model of our biological system to simulate and predict its behavior. What we do in this part is an assessment of its value and scope of use of our biological systems. In addition, we get a preliminary database of copper and cadmium pollution in the world through the data collection, which is also within the scope of modeling. In this part, we work with teammates who are responsible for human practice to carry out the main work of data collection and map processing. Because different countries and regions have different monitoring and treatment methods for copper and cadmium pollution, and many countries and regions even lack of monitoring and treatment methods of copper and cadmium pollution, we spent a lot of time to collect data. Even so, we did not collect enough data to conduct detailed data analysis of copper and cadmium pollution worldwide. Nevertheless, our existing work can still lead to some preliminary and regional results for the pollution of copper and cadmium.
Data collection
As the United States for the detection and processing of pollution is better, we firstly start from the United States to collect data. We find the National Aquatic Resource Surveys in the EPA (United States Environmental Protection Agency) website. There are four national assessments in NARS: National Coastal Condition Assessment (NCCA), National Lakes Assessment (NLA), National Rivers and Streams Assessment (NRSA), National Wetland Condition Assessment (NWCA). Only the NWCA has the data of copper and cadmium, so we use it as one of the data sources of our maps. The methods and standards used in NWCA are shown in EPA websites.
The methods we used to collect European data is similar to that of the United States. We use the FOREGS-EuroGeoSurveys Geochemical Baseline Database as one of data sources of our maps. The methods and standards used are shown in FOREGS-EuroGeoSurveys Geochemical Baseline Database websites.
The data collection process of China is more difficult than that of Europe and the USA, although China also has a comprehensive monitoring and treatment system for copper and cadmium pollution, these data have not published in detail, so we cannot get these authoritative national census data.
So we turn to other sources to collect data of China. The team of Jianchao Li from Shanxi Normal University retrieved 2450 papers on six kinds of heavy metal pollution (Cd, Pb, Zn, As, Cu, Cr) in China's soil for nearly ten years. After finishing the analysis, the data of 850 papers has plotted the distribution of heavy metal pollution, and provided a detailed distribution of the key pollution areas. The work was published in June 2016 at Bulletin of Environmental Contamination and Toxicology.
Duan Q., Lee J., Liu Y., Chen H., Hu H., (2016) Distribution of Heavy Metal Pollution in Surface Soil Samples in China: A Graphical Review. Bull Environ Contam Toxicol. Jun 24.
For the data of other regions, we did not find similar data sources, so we refer to the practice of the Jiaochao Li team, through the web of science core collection on the literature in recent years, we retrieve 309 sets of data. Although these data is not enough Detailed global analysis, we draw some preliminary conclusions.
Map Drawing
We stored data we collected as .mat file in MATLAB, and then we use the worldmap and our map drawing command to draw our Global Cu and Cd Pollution Map.

The pollution of copper worldwide

The pollution of copper worldwide
Analysis of Global Cu and Cd Pollution Map
From the pollution map we can see the following:
1,The pollution in Asia, Africa and Latin America is more serious in the United
States and Europe: Although we don’t have comprehensive data for Africa and Latin
America, but still can find this phenomenon.
2, the distribution of pollution is not uniform or normal, but most of the region
at a good level of the environment at the same time, there are some serious
polluted areas.
3, many countries and regions are still lack of investigation of copper and cadmium
pollution and supervision, so there may be more areas of serious copper and cadmium
pollution.