Difference between revisions of "Team:CCA San Diego/Measurement"
(Replaced content with "{{CCA_Stylesheets}} {{CCA_Bootstrap}} {{CCA_AllowFullWidth}} {{CCA_indentText}} {{CCA_HideIgemHeader}} {{CCA_NavBar}} <html style="height:1200px;"> <meta name="viewport"...") |
|||
| Line 13: | Line 13: | ||
<h2 style="font-size:79px">Measurement</h2> | <h2 style="font-size:79px">Measurement</h2> | ||
| − | <h6> | + | <h6>First we standardized our measurements in both LUDOX-HS40 and water by taking a set of measurements in a spectrophotometer and calculating a correction factor to convert our data into the standardized units that iGEM requested (OD<subscript>600</subscript>). |
| + | </h6> | ||
| + | |||
| + | <table width="35%" height="auto"> | ||
| + | <tr><td> | ||
| + | <img src="https://static.igem.org/mediawiki/2017/a/a1/InterlabFigure1.png" width="100%" height="auto"> | ||
| + | <br><h6>Figure 1: Absorbance measurement of LUDOX 100% and H2O and correction factor table.</h6> | ||
| + | </td></tr> | ||
| + | </table> | ||
| + | |||
| + | <br><h6>Next we used a serial dilution of fluorescein to generate a standard curve of the concentration, which we used to correct our cell-based GFP readings later in the experiment to ensure the accuracy of our measurements. | ||
| + | </h6> | ||
| + | |||
| + | <table width="35%" height="auto"> | ||
| + | <tr><td> | ||
| + | <img src="https://raw.githubusercontent.com/anjalisg/IGEM/master/IGEM%20Website/assets/img/InterlabFigure2.png" width="100%" height="auto"> | ||
| + | <br><h6>Figure 2: FITC standard curve plotted from the data of 12 dilutions of concentration of 4 replicates</h6> | ||
| + | </td></tr> | ||
| + | </table> | ||
| + | <h6>For consistency of results, we used E.Coli k-12 DH5 Alpha for all of our transformations. We also conducted 4 trials to generate 4 replicates on the final sampling plate. <br><br> | ||
| + | To measure the cell-based assays, we started by transforming 8 plates of E. coli with the 8 samples provided in Kit 7. After allowing the colonies to form on the plates, each plate had 2 colonies selected to be grown in 5-10 mL LB medium + Chloramphenicol overnight (16-18 hours) at 37°C and 220 rpm. | ||
| + | </h6> | ||
| + | <table width="35%" height="auto"> | ||
| + | <tr><td> | ||
| + | <img src="https://raw.githubusercontent.com/anjalisg/IGEM/master/IGEM%20Website/assets/img/InterlabFigure3.png" width="100%" height="auto"> | ||
| + | <br><h6>Figure 3: In order from left to right and top to bottom: Negative Control, Device 1, Device 2, Device 3, Device 4, Device 5, Device 6 and Puc19 serving as a plasmid indicator.</h6> | ||
| + | </td></tr> | ||
| + | </table> | ||
| + | |||
| + | |||
| + | |||
| + | <h6>The plate readers were configured to measure OD<sub>600</sub> and the overnight cultures were measured once to help calibrate the concentrations to the desired OD<sub>600</sub> of 0.02. The samples were once again incubated at 37°and 220 rpm. At the 0, 2, 4 and 6 hour time points during the incubation, 500 µL of each sample from both colonies were taken and measured for fluorescence.</h6> | ||
| + | |||
| + | <table width="35%" height="auto"> | ||
| + | <tr><td> | ||
| + | <img src="https://raw.githubusercontent.com/anjalisg/IGEM/master/IGEM%20Website/assets/img/InterlabFigure4.png" width="100%" height="auto"> | ||
| + | <br><h6>Figure 4: The overnight cultures show indications of varying fluorescence even before the formal testing period.</h6> | ||
| + | </td></tr> | ||
| + | </table> | ||
| + | <h6>For each time point, we had a 96 well plate that was organized according to the diagram provided by iGEM with each of our 8 devices over 4 replicates and an LB blank. Finally, the data we gathered was corrected and converted into the standardized units that the interlab uses to compare data across all the participating labs. | ||
| + | <br><br></h6> | ||
| + | |||
| + | |||
| + | |||
| + | |||
<div class="footer-dark"> | <div class="footer-dark"> | ||
Revision as of 07:57, 31 October 2017
Measurement
First we standardized our measurements in both LUDOX-HS40 and water by taking a set of measurements in a spectrophotometer and calculating a correction factor to convert our data into the standardized units that iGEM requested (OD600 ).

Figure 1: Absorbance measurement of LUDOX 100% and H2O and correction factor table. |
Next we used a serial dilution of fluorescein to generate a standard curve of the concentration, which we used to correct our cell-based GFP readings later in the experiment to ensure the accuracy of our measurements.
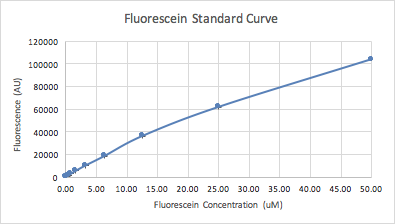
Figure 2: FITC standard curve plotted from the data of 12 dilutions of concentration of 4 replicates |
For consistency of results, we used E.Coli k-12 DH5 Alpha for all of our transformations. We also conducted 4 trials to generate 4 replicates on the final sampling plate.
To measure the cell-based assays, we started by transforming 8 plates of E. coli with the 8 samples provided in Kit 7. After allowing the colonies to form on the plates, each plate had 2 colonies selected to be grown in 5-10 mL LB medium + Chloramphenicol overnight (16-18 hours) at 37°C and 220 rpm.
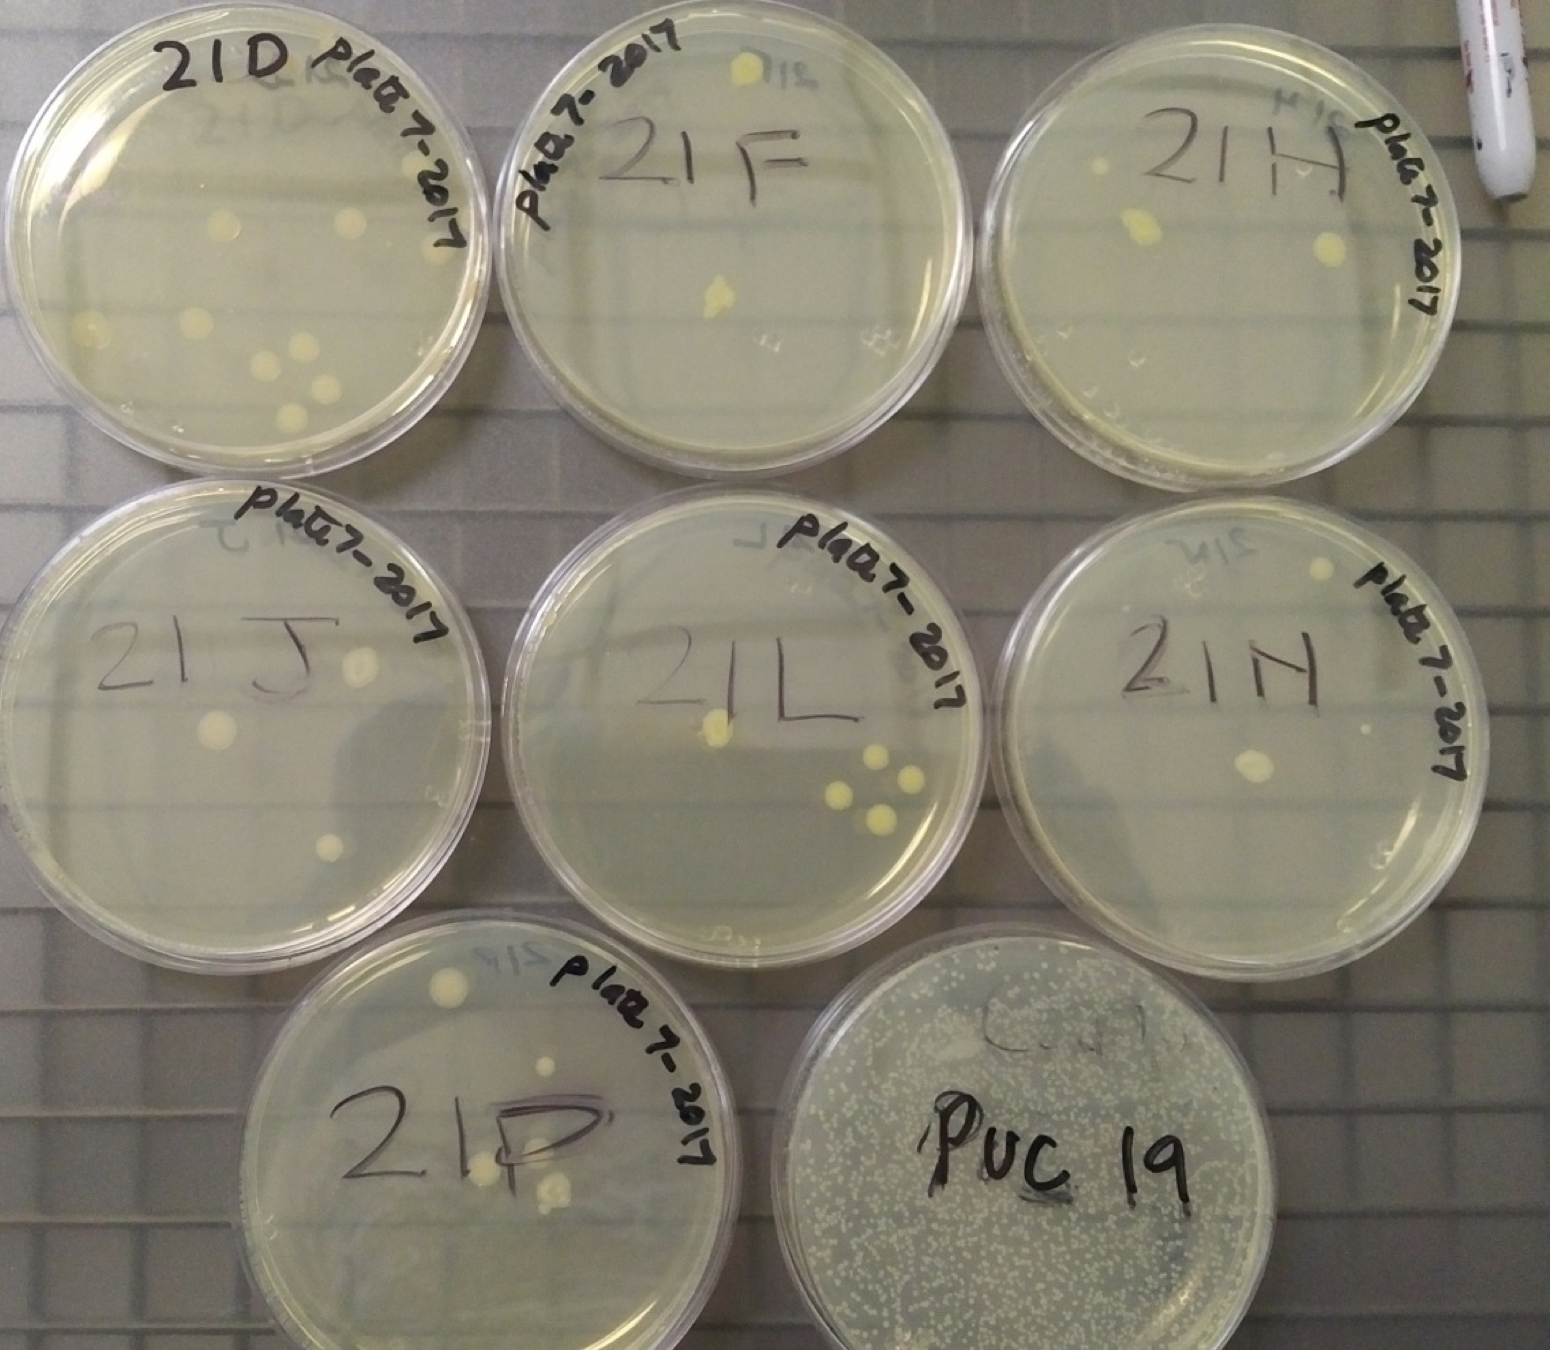
Figure 3: In order from left to right and top to bottom: Negative Control, Device 1, Device 2, Device 3, Device 4, Device 5, Device 6 and Puc19 serving as a plasmid indicator. |
The plate readers were configured to measure OD600 and the overnight cultures were measured once to help calibrate the concentrations to the desired OD600 of 0.02. The samples were once again incubated at 37°and 220 rpm. At the 0, 2, 4 and 6 hour time points during the incubation, 500 µL of each sample from both colonies were taken and measured for fluorescence.
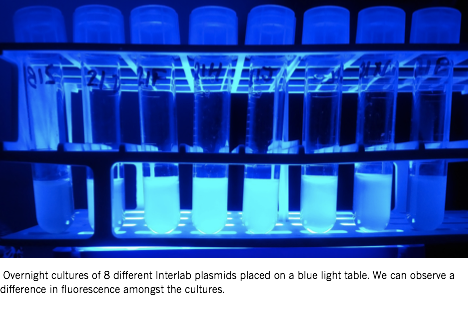
Figure 4: The overnight cultures show indications of varying fluorescence even before the formal testing period. |
For each time point, we had a 96 well plate that was organized according to the diagram provided by iGEM with each of our 8 devices over 4 replicates and an LB blank. Finally, the data we gathered was corrected and converted into the standardized units that the interlab uses to compare data across all the participating labs.
Canyon Crest Academy iGEM 2017 CC; |