| Line 931: | Line 931: | ||
<h3 class="collapse-card__title"> | <h3 class="collapse-card__title"> | ||
<i class="fa fa-map-marker" aria-hidden="true"></i> | <i class="fa fa-map-marker" aria-hidden="true"></i> | ||
| − | Construction of | + | Construction of Global Cu and Cd Pollution Map |
</h3> | </h3> | ||
</div> | </div> | ||
| Line 938: | Line 938: | ||
<h4>Data collection</h4> | <h4>Data collection</h4> | ||
<p>As the United States for the detection and processing of pollution is more perfect, we first from the United States to start the data collection of data. We find the National Aquatic Resource Surveys in the EPA (United States Environmental Protection Agency) website. There are four national assessments in NARS: National Coastal Condition Assessment (NCCA), National Lakes Assessment (NLA), National Rivers and Streams Assessment (NRSA), National Wetland Condition Assessment (NWCA). Only the NWCA have the data of copper and cadmium, so we use it as one of data sources of our maps. The methods and standards used in NWCA are shown in EPA websites.</p> | <p>As the United States for the detection and processing of pollution is more perfect, we first from the United States to start the data collection of data. We find the National Aquatic Resource Surveys in the EPA (United States Environmental Protection Agency) website. There are four national assessments in NARS: National Coastal Condition Assessment (NCCA), National Lakes Assessment (NLA), National Rivers and Streams Assessment (NRSA), National Wetland Condition Assessment (NWCA). Only the NWCA have the data of copper and cadmium, so we use it as one of data sources of our maps. The methods and standards used in NWCA are shown in EPA websites.</p> | ||
| − | <p>The methods we used to collect European data is similar to that of the United States. We use the FOREGS-EuroGeoSurveys Geochemical Baseline Database as one of data sources of our maps. The methods and standards used | + | <p>The methods we used to collect European data is similar to that of the United States. We use the FOREGS-EuroGeoSurveys Geochemical Baseline Database as one of data sources of our maps. The methods and standards used are shown in FOREGS-EuroGeoSurveys Geochemical Baseline Database websites.<p> |
<p>The data collection process of China is more difficult than that of Europe and the USA, although China also has a comprehensive monitoring and treatment system for copper and cadmium pollution, these data have not published in detail, so we cannot get these authoritative national census data.</p> | <p>The data collection process of China is more difficult than that of Europe and the USA, although China also has a comprehensive monitoring and treatment system for copper and cadmium pollution, these data have not published in detail, so we cannot get these authoritative national census data.</p> | ||
<p>So we turn to other sources to collect data of China. The team of Jianchao Li from Shaanxi Normal University retrieved 2450 papers on six kinds of heavy metal pollution (Cd, Pb, Zn, Zn, Cu, Cu, Cr) in China's soil for nearly ten years. After finishing the analysis, the data of 850 papers is plotted the distribution of heavy metal pollution, and provided a detailed distribution of the key pollution areas. The work was published in June 2016 at Bulletin of Environmental Contamination and Toxicology.</p> | <p>So we turn to other sources to collect data of China. The team of Jianchao Li from Shaanxi Normal University retrieved 2450 papers on six kinds of heavy metal pollution (Cd, Pb, Zn, Zn, Cu, Cu, Cr) in China's soil for nearly ten years. After finishing the analysis, the data of 850 papers is plotted the distribution of heavy metal pollution, and provided a detailed distribution of the key pollution areas. The work was published in June 2016 at Bulletin of Environmental Contamination and Toxicology.</p> | ||
| Line 954: | Line 954: | ||
<h4>Map Drawing</h4> | <h4>Map Drawing</h4> | ||
| − | <p>We stored data we collected as .mat file in MATLAB, and then we use the worldmap and our map drawing command to draw our | + | <p>We stored data we collected as .mat file in MATLAB, and then we use the worldmap and our map drawing command to draw our Global Cu and Cd Pollution Map.</p> |
Revision as of 14:29, 30 October 2017
/* OVERRIDE IGEM SETTINGS */
Model
Overview
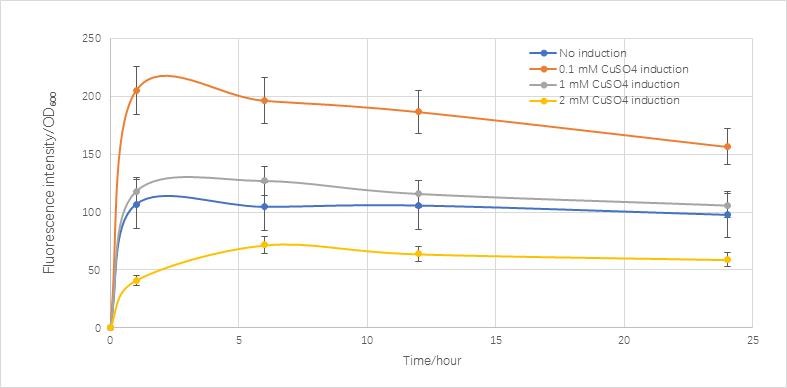
The models we built included five parts. First, We established a bistable model to analyze the feasibility of functional switch of cells. Then,We used software to model and simulate the functional switch process after cell mating. And we build a RFP expression model to simulate the expression RFP in yeast cells with CUP1 promoter. What’s more, we construct a model of adsorption to simulate the combination of heavy metal ions and heavy metal-treated proteins inside the yeast cells. Finally, we worked with teammates of human practice to draw the World Copper and Cadmium Pollution Map and establish a preliminary World Copper and Cadmium Pollution Database.


