Team:CCA San Diego/InterLab

Interlab Study
Overview
CCA iGEM is proud to participate in the 2017 iGEM interlab for the first time, and we’re happy to share our results with the community at large. The objective of this year’s interlab was to use an identical protocol for eight different plasmids (6 test devices, a positive, and a negative control) in expressing GFP and measuring it in common units to compare results across the world and across a variety of plate readers.
This year, a new bicistronic design element (J364100) was used in an attempt to improve the accuracy and reliability of results worldwide in conjunction with the three promoters that were tested last year: J23101, J23106, and J23117. The new BCD was measured against the B0034 single ribosome binding site with the same promoters and against both a positive and negative control in I20270 and R0040. These plasmids were transformed on the pSB1C3 vector in standard fashion and tested to produce the results below.
Methodology
First we standardized our measurements in both LUDOX-HS40 and water by taking a set of measurements in a spectrophotometer and calculating a correction factor to convert our data into the standardized units that iGEM requested (OD600 ).

Figure 1: Absorbance measurement of LUDOX 100% and H2O and correction factor table. |
Next we used a serial dilution of fluorescein to generate a standard curve of the concentration, which we used to correct our cell-based GFP readings later in the experiment to ensure the accuracy of our measurements.
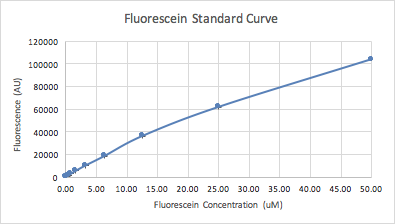
Figure 2: FITC standard curve plotted from the data of 12 dilutions of concentration of 4 replicates |
For consistency of results, we used E.Coli k-12 DH5 Alpha for all of our transformations. We also conducted 4 trials to generate 4 replicates on the final sampling plate.
To measure the cell-based assays, we started by transforming 8 plates of E. coli with the 8 samples provided in Kit 7. After allowing the colonies to form on the plates, each plate had 2 colonies selected to be grown in 5-10 mL LB medium + Chloramphenicol overnight (16-18 hours) at 37°C and 220 rpm.
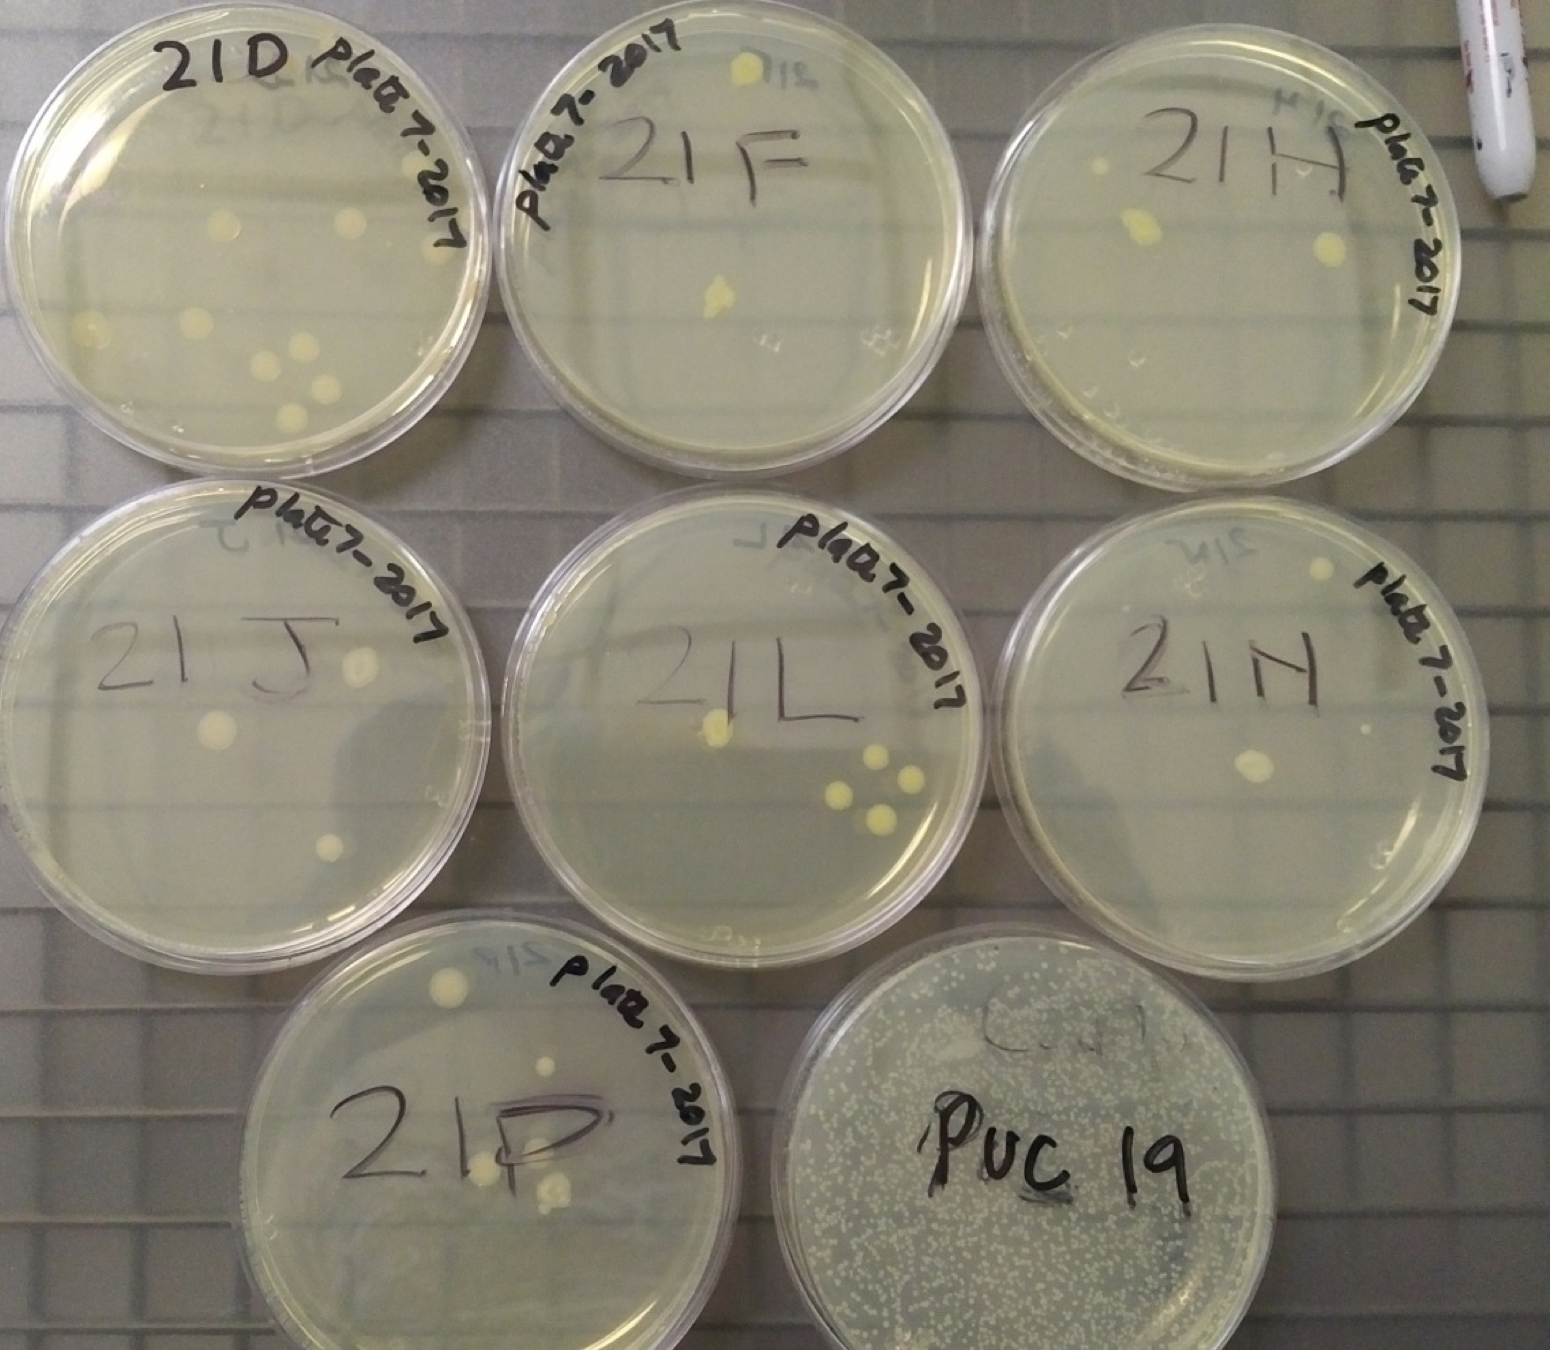
Figure 3: In order from left to right and top to bottom: Negative Control, Device 1, Device 2, Device 3, Device 4, Device 5, Device 6 and Puc19 serving as a plasmid indicator. |
The plate readers were configured to measure OD600 and the overnight cultures were measured once to help calibrate the concentrations to the desired OD600 of 0.02. The samples were once again incubated at 37°and 220 rpm. At the 0, 2, 4 and 6 hour time points during the incubation, 500 µL of each sample from both colonies were taken and measured for fluorescence.
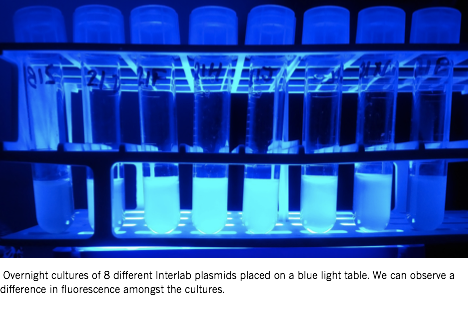
Figure 4: The overnight cultures show indications of varying fluorescence even before the formal testing period. |
For each time point, we had a 96 well plate that was organized according to the diagram provided by iGEM with each of our 8 devices over 4 replicates and an LB blank. Finally, the data we gathered was corrected and converted into the standardized units that the interlab uses to compare data across all the participating labs.
Results
Using water as a blank, the corrected absorbance of LUDOX is 0.0084. Correction factor was then calculated by dividing the corrected absorbance by a reference OD value of 0.0425. Hence, the correction factor of 5.059 FI represents the fluorescence intensity, and absorbance 600 represents the density of bacterial culture. Therefore, FI/Abs600 is used to assess the strength of the GFP expression.
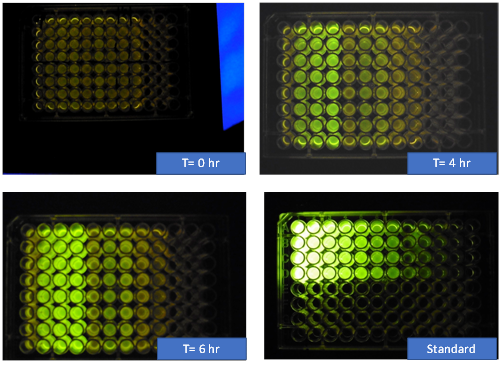
Figure 5: Images taken from the plate reader at 0 hours, 4 hours, 6 hours, and the standard fluorescein plate. |
Interlab Notebook
Canyon Crest Academy iGEM 2017 CC; |