Team:Hong Kong UCCKE/Results
After we have successfully cloned our plasmids into the E.coli, we did miniprep to obtain purified plasmid DNA. Then, we did restriction map and sent the samples to BGI for sequencing. The results are shown below.
BBa_K2197300
Restriction Map
After mini prep, we used the same restriction enzymes EcoR1 and Pst1 to do restriction digestion and gel electrophoresis. However, the size of K2197300 and the backbone pSB1C3 are almost the same, thus we cannot prove by the Gel photo.

Image of gel electrophoresis of 300a+b
Sequencing Result
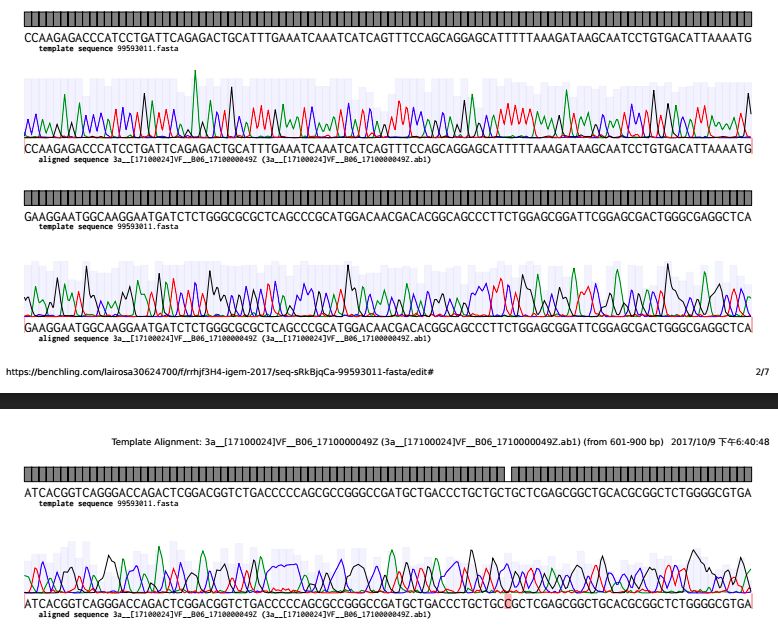
With the help of team 2017 Hong_Kong-CUHK, we sent our plasmid to BGI for sequencing. We aligned the sequence we ordered from IDT (As the template sequence 99593011 below) with the sequencing result received from BGI (as the aligned sequence below). And here is our analysis.
The black area indicates the two sequences are the same which those red strips represent there're some mutations.

Sequencing result of BBa_K2197300

Sequence Alignment(1)
Sequence Alignment(2)
Conclusion
From the results above, we can say we have successfully cloned the DNA that IDT sent us into the cell. However, as what we have mentioned in the experiment page, we found that the cells cannot express GFP. Then, we aligned the sequence registered in iGEM with the one that IDT send us, we found that the sequence containing 'tactagag' is missing.

Sequence Alignment(1)

Sequence Alignment(2)
BBa_K2197400
Restriction Map
After mini prep, we used the same restriction enzymes EcoR1 and Pst1 to do restriction digestion and gel electrophoresis. As seen, the position of K2197400 (2214 bp) and the backbone pSB1C3 (2070 bp) are similar to our predicted result.

Image of gel electrophoresis of 400a+b and 500

Image of theoretical gel electrophoresis of 400 from genome compiler
Sequencing Result
With the help of team 2017 Hong_Kong-CUHK, we sent our plasmid to BGI for sequencing. We aligned the sequence we ordered from IDT (As the template sequence 163014570 below) with the sequencing result received from BGI (as the aligned sequence below). And here is our analysis.
The black area indicates that the two sequences are the same which those red strips represent there're some mutations.


Sequence Alignment (1)

Sequence Alignment (2)
Conclusion
From the results above, we can say we have successfully cloned the plasmid DNA into the cell.
BBa_K2197500
Restriction Map
Also using the same restriction enzymes EcoR1 and Pst1 to do restriction digestion and gel electrophoresis. The position of K2197500 (1668 bp) and the backbone pSB1C3 (2070 bp) is similar to our predicted result.

Image of gel electrophoresis of 400a+b and 500

Image of theoretical gel electrophoresis of 500 from genome compiler
Sequencing Result
We sent our plasmid to BGI for sequencing. We aligned the sequence we ordered from IDT (As the template sequence 163014569 below) with the sequencing result received from BGI(as the aligned sequence below). And here is our analysis.
The black area indicates that the two sequences are the same which those red strips represent that there're some mutations.

Sequencing Result of BBa-K2197500

Project 500 (1)

Project 500 (2)
Conclusion
From the results above, we can say we have successfully cloned the plasmid DNA into the cell.
BBa_K2197502
Sequencing Result
We sent our plasmid to BGI for sequencing. We aligned the sequence that we ordered from IDT (As the template sequence 163014567 below) with the sequencing result received from BGI (as the aligned sequence below). And here is our analysis.
The black area indicates that the two sequences are the same which those red stripsrepresent that there're some mutations.

Sequencing result of BBa_K2197502

Project 502 (1)

Project 502 (2)
Conclusion
From the results above, we can say we have successfully cloned the plasmid DNA into the cell.