
Team:NYU Abu Dhabi/Results

Successfully digested, ligated, and transformed rfbE into pSB1C3
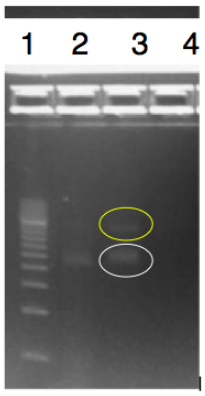
The objective of this experiment was to digest and ligate the rfbE BioBrick BBa_K2495001 into the pSB1C3 linearized backbone for DNA submission and characterization. The rfbE gene was obtained in the BioBrick format from IDT. A modified restriction double digest and ligation protocol was used and can be found on our protocol page. We confirmed that our gene of interest was successfully ligated into the pSB1C3 backbone by running PCR using primers BBa_K2495019 and BBa_K2495020. The products were visualized by running a 1.2% agarose gel. Our ligated part in lane 2 shows a band at approximately 2000-bp, which corresponds to the length of our amplified region. Lane 3 also shows the amplified product, as well as the ligated product (in yellow) at approximately 4500-bp.
Optimized the LAMP reaction to 20 minutes without lysis or centrifugation
The optimal conditions for cell lysis were previously investigated using E. coli DH5α transformed with pGLO plasmid (see biology lab notebook). The optimal cell lysis conditions for use with LAMP were tested using rfbE transformed into E. coli.
To test the specificity of the LAMP reaction, we employed multiple controls. Ligated products that were purified by miniprep (Qiagen) and verified previously by PCR were used as the positive controls. Negative controls included DH5α cells and a swab of E. coli from beef, which was verified by gram staining.
To show that we have successfully cloned rfbE into the pSB1C3 backbone, and to show the specificity of our PCR primers (BBa_K2495019, BBa_K2495020) targeting rfbE that we designed using PrimerExplorer V5, we ran PCR of our samples below according to the following program:
- Initial denaturation at 95ºC for 5 min
- 30 cycles of denaturation at 94ºC for 30 s, annealing at 50ºC for 45 s
- Final extension at 72ºC for 1.5 min
- Hold at 4ºC
LAMP was run according to the instructions of the manufacturer (OptiGene) using primers targeted at rfbE designed with PrimerExplorer V5. The experimental conditions were:
- rfbE gene fragment (IDT) - positive control
- Plasmid DNA of rfbE in DH5α - negative control
- Plasmid DNA of rfbE in DH5α treated with 10 minutes of 95˚C heat lysis - negative control
- Plasmid DNA of rfbE in DH5α
- rfbE in DH5α suspended in TE buffer and treated with 10 minutes of 95˚C heat lysis
- rfbE in DH5α suspended in TE buffer (without heat treatment)
- Plasmid DNA of beef E. coli
- Plasmid DNA of beef E. coli treated with 10 minutes of 95˚C heat lysis
The PCR reaction showed a clear band at 1000-bp (circled in black), while LAMP showed the typical smear of amplification. Both PCR and LAMP reactions did not show any banding or smearing in the DH5α or beef E. coli results, indicating that both techniques are specific to our gene of interest. However, comparison of the heat versus no heat lysis variables (circled in red) show that LAMP is able to amplify our gene of interest in the absence of the heat lysis step. This indicates that the LAMP technique is much more sensitive than PCR.
Due to the superior specificity and sensitivity of LAMP, we envision that it will not be necessary to include a heat lysis step in our final version of the detection process for Shiga-toxigenic bacteria.


Sensitive to 106 cells/mL
To determine the limit of detection of our LAMP reactions, we ran it on serial dilutions of inoculated broth and monitored the progress using the Applied Biosystems SteponePlus Real-Time PCR System (Thermo Fisher, MA). Inoculated broth was diluted and run according to the optimized protocol described in our biology lab notebook. The dilutions ranged from 108 cells/mL to 101 cells/mL. Six serial dilutions of a previously miniprepped sample were used as positive controls. The negative control was TE buffer. The reaction was run on a total volume of 12.5µl. Duplicates were averaged and the fluorescence was plotted against time using Excel.
The results corresponded with a subsequent gel on the amplified products. The band intensity of the gels were in agreement with the relative fluorescence intensities visualized during the reaction.


The results visualized on the gel are in great agreement with the recorded change in fluorescence intensity, both indicating that the intensity of concentrations above and including 106 cells/mL are significantly higher than the control when using a 12.5µl total reaction volume. While samples of lower concentrations were run, we could not draw any conclusive evidence from these as they did not differ significantly from the fluorescence intensity of the control. We have found that using a larger reaction volume (25µl) does increase our sensitivity significantly, but due to shipping difficulties we were unable to obtain enough MasterMix to continue testing with a 25 µl reaction volume. Instead, subsequent tests were tested with 12.5µl volume.
Based on these results, we determined that our limit of detection is 106 cells/mL.


The reaction products were also visualized under blue light and UV light at 302 nm. We can clearly visualize a gradient in the fluorescence from highest to lowest concentrations of DNA. All samples are clearly more fluorescent than the negative control.

Constructed a PDMS chip to house the reaction

Each chip design was tested with the following conditions and requirements:
- Able to let a volume of 25µl of sample to flow into the necessary reaction chamber.
- Mix sufficiently well with the reagents (Simulated with water and dye for experimentation).
- Prevent any leakage of fluid either via gaps or evaporation.
After testing numerous chip prototypes, we designed the optimized chip design that shows both successful fluid flow and thermal performance when subjected to 65˚C heating for LAMP reactions. A 5-well design was the result which prevented any fluid loss due to leakage and optimum mixing between the sample and LAMP reagents. No valving was necessary and the entire chip is 40 mm x 25 mm, making it much smaller and thus cheaper than previous designs.
Each well can hold up to a of 50µl, which is more than enough to contain both liquid reagents and sample. Thus, our design is not only limited to just lyophilized reagents. Previous designs only showed successful fluid flow but were not able to prevent condensate from escaping. The current design solves this by covering the wells with a hydrophobic, transparent material (optical adhesive) that does not interfere with fluorescence results.
Designed a heating circuit
 When developing the heating method, we found that it needed to satisfy the following properties:
- Sustain a temperature of 65˚C for the reaction
- Contain feedback control to maintain the temperature
- Affordable
Between Peltier Cooler Modules, ITO heaters and hand warmers, we chose the Peltier because we found that it could reach the desired temperature, was easy-to-use and customize, and was reasonably priced compared to the ITO heater. The Peltier can be used with 5-7V voltage input and 1-2A current input. This property was ideal, considering that most portable power banks have a DC output of 5V and 2.1A. Hence, the heater was developed such that a portable power bank can act as the power supply.
 The Peltier temperature response graph of data taken over 2 hours shows that the time it takes for the glass plate to reach 65˚C is less than 4 minutes and 30 seconds, and remains at a constant 65 ±2 ˚C throughout the entire 2 hours.
To control the Peltier Cooler Module, we used the tmp36 temperature sensor because it is cheap and easy-to-use. Additionally, an Arduino nano was used as the microchip controller due to its simplicity, a compact size, and its ability to do a proportional-integral-derivative (PID) control using tmp36. Finally, an N-Mosfet transistor was used to act as a switch control for the Peltier heater.
An external power supply was added using a power adapter that allows for 6V and 1.5A. The Arduino nano was powered by Laptop USB, which only allows 500mA of current.The tmp36 uses the 5V voltage as a reference to measure the temperature on the Peltier heating plate. This sensor controls the N-Mosfet transistor that works with a low-side switch setup, allowing the current to flow whenever the temperature of the Peltier registers below 65˚C.
The prototype of our STEC-detecting device was constructed using a PDMS chip containing 5 wells of 3 mm of diameter sealed with PCR-compatible optical adhesive film. The 65ºC temperature was achieved using a Peltier Modular Cooling system with a 6 Volts, 1.5 Amperes external power supply adapter. For more information on the design of the chip and the Peltier system used, please refer to the lab notebook.
All the wells were loaded with 5μL of Isothermal Master Mix (OptiGene), 1.25μL of 10X SYBR Green (BioRad), 0.25μL of F3 primer (BBa_K2495014), 0.25μL of B3 primer (BBa_K2495015), 1μL of FIP primer (BBa_K2495016), and 1μL of BIP primer (BBa_K2495017). All primers were procured from Sigma Aldrich.
Our LAMP reaction on our gene of interest, rfbE, was confirmed twice. The left image shows our first trial, in which the wells were loaded from left to right as follows: miniprep, positive control; TE buffer, negative control; 2.5µl of 106 cells/mL; 5µl of 106 cells/mL; and, 5µl of 106 cells/mL. The results were visualized under UV at 302 nm and blue light. The image on the right shows the wells under blue light after running the LAMP reaction. The positive control (miniprepped target) shows significantly stronger fluorescence than the negative control (TE buffer). The samples of inoculated broth show an intermediate degree of fluorescence, indicating that there our target gene, rfbE is present in the samples.


A time lapse of both trials are provided below.
To demonstrate the wide applicability of our device, we decided to test its capability to detect the presence of malaria-causing pathogen Plasmodium falciparum using primers targeting the mitochondrial cytochrome oxidase subunit 1 gene, which is specific to Plasmodium falciparum and allows it to be distinguished from Plasmodium vivax.1 The LAMP reaction was prepared according to our optimized protocol. The samples were loaded to the PDMS chip as follows:
- 3x diluted genomic DNA, Sample 1
- 5x diluted genomic DNA, Sample 2
- 7x diluted genomic DNA, Sample 3
- TE Buffer, negative control
- Genomic DNA (2ng/µl), positive control


After the reaction proceeded, all three samples exhibited a gradient of fluorescence under UV light (365 nm) and under blue light, as expected (Figure 2). There is also a clear difference in fluorescence between the samples and the negative control, indicating that the LAMP reaction successfully amplified the malarial marker with a high specificity. This experiment demonstrates our device’s potential as a pathogen surveillance method. The impact of our device extends far beyond our original purpose of food safety. By simply using a different set of primers to target a different genomic sequence, we can utilize the same device and technique to detect the presence of other known pathogens and viruses. This diagnostic method can easily be applied to the field of disease surveillance. In the context of malaria, this device could be used to test multiple water samples to detect the presence of malaria-causing pathogen in its breeding ground.
These preliminary studies prove that our device works with fluorescence detection. In future trials, the use of microfluidics channels will be investigated to provide a more user-friendly method to load the samples at once. The device will also be tested with a broader range of bacterial concentrations and on different pathogens and viruses in the near future.

Chen, et al. (2017)2 developed a similar device which required the use of centrifugation and heat lysis. Their device was estimated to cost $550 USD, which is considerably more expensive and requires more laboratory techniques than the method we have developed.
1. Modak et al. Rapid Point-of-Care Isothermal Amplification Assay for the Detection of Malaria without Nucleic Acid Purification. Infectious Diseases: Research and Treatment 2016:9 1–9 doi:10.4137/IDRT.S32162.
2. Chen, et al. Mobile Platform for Multiplexed Detection and Differentiation of Disease-Specific Nucleic Acid Sequences, Using Microfluidic Loop-Mediated Isothermal Amplification and Smartphone Detection. Analytical Chemistry 2017 doi:10.1021/acs.analchem.7b02478.


