Team:UNebraska-Lincoln/Results
UNL 2017
Helping reduce methane emissions from livestock


Results
Overview
We are excited to present the following results:
- Successfully cloned and fully sequenced without mutation two new biobrick parts. A new nitrite reductase enzyme and vanadium-dependent bromoperoxidase.
- Observed potential increase in nitrite metabolism for the nrfAH plasmid at concentrations around 30 mM NaNO2 with respect to the empty vector.
- Proved that our bromoperoxidase protein is being produced and works as expected.
Nitrite Reductase
Background
One of the potential ways to reduce methanogenesis in cattle is to divert resources away from methanogens to other microorganisms in the gut. Nitrogen-fixing bacteria present in the rumen compete with methanogens for hydrogen, using it to make ammonium which can then be rapidly converted to amino acids by other microorganisms. The reduction route from nitrate to ammonium is shown in the following equation.

In comparison to the reduction of nitrate to nitrite, reduction of nitrite to ammonium is relatively slower. Because the nitrite anion is substantially more toxic than the other molecular species in the nitrate reduction pathway, elimination of nitrite is the key step. To solve this problem, nitrogen-fixing bacteria containing a gene that encodes a more efficient nitrite reductase is required in the rumen. As a consequence, methanogenesis could be reduced, and protein production could increase for the animal as well.
To achieve this goal, we transformed a plasmid encoding a nitrite-reductase enzyme into an E. coli chassis. Once a successfully-transformed strain was obtained, we then examined the cell growth and nitrite reduction activity in conditions similar to the cattle rumen.
Nitrite reductase activity was analyzed using Nessler’s Test. Nessler’s Test is a quantitative chemical reaction that is used to determine ammonium concentration in solution. The amount of ammonium present is directly correlated with nitrite reductase activity. Nessler’s Reagent contains 0.09M potassium tetraiodomercurate (K2[HgI4]) in 2.5 M aqueous potassium hydroxide solution. The reaction of this reagent with aqueous ammonium is shown in the following equation.

Testing
- Successfully introduce a plasmid containing a nitrite reductase gene into an E. coli chassis.
- Grow the transformed E. coli under aerobic condition as a seed culture. A strain containing a plasmid encoding RFP (red fluorescence protein) was used as the control for the characterization of NrfA (E. coli Cytochrome C nitrite reductase). A culture containing the empty vector is used as a control in the characterization of NrfHA (S. ruminantium Cytochrome C nitrite reductase).
- Inoculate the anaerobic vials with seed culture. Media contained varying concentrations of nitrite. Cells were cultured overnight.
- Take OD measurements of the cultures at 600 nm to monitor cell growth.
- Collect cell-free supernatant and test ammonium concentration using Nessler’s Reagent. (Nessler’s reagent reacts with ammonium in solution to form a brown precipitate. The mass of this precipitate is used to gauge the nitrite metabolism.)
Data Analysis (Rounds 1-2):
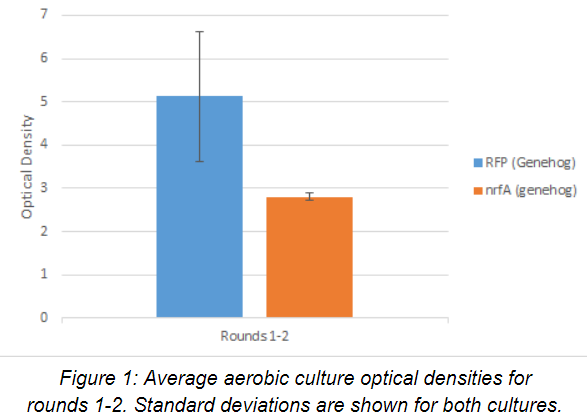
E. coli strain containing the RFP (red fluorescence protein) plasmid was used for the control in rounds 1-2, while our experimental strain contained a defective form of the nrfA plasmid. The cell chassis used for both strains was Genehog. Average optical density readings (n=4) for the aerobic seed cultures for rounds 1-2 are shown below after 24 hours of growth in Figure 1. Both strains grew well under aerobic conditions. The control strain, on average, grew much faster than the experimental one.
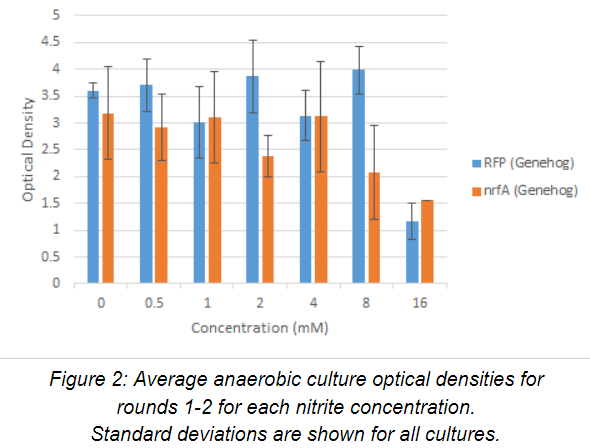
Average optical density (n=2) of anaerobic culture for rounds 1-2 after 24 hours of growth. The OD600nm are plotted against nitrite concentration below in Figure 2. For the control strain, growth is consistent in media containing 0-8 mM nitrite, but drops substantially at 16 mM. For the experimental strain, growth is consistent in media containing 0-4 mM nitrite, but drops for concentrations above 8 mM. However, the growth of the experimental strain is slightly better than the growth of the control strain at 16 mM nitrite.
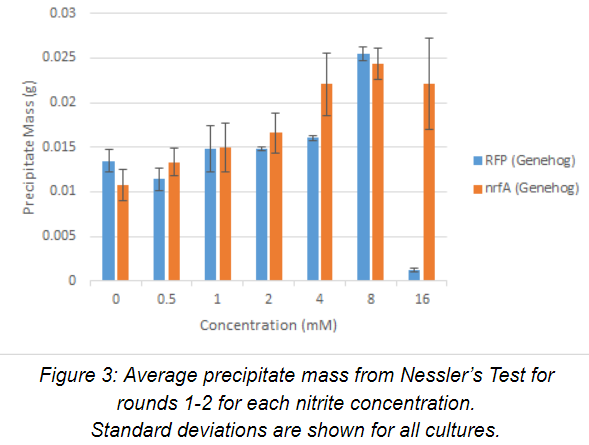
Nessler’s Test was performed (n=2) on the cell-free supernatant of each culture. Averaged data for rounds 1-2 is displayed below for each nitrite concentration along with standard deviation in Figure 3. Precipitate mass from Nessler’s Test serves as an indicator of ammonium present in solution. Precipitate mass for both the control and experimental cultures steadily increased as nitrite concentration increased, up to 8 mM nitrite. This likely indicates that both strains produce ammonium. However, at 16 mM, the control strain had largely died off and was unable to metabolize any nitrite, while the experimental strain was still performing adequately. Sequencing results obtained after the completion of round 2 showed a deletion in the open reading frame of the nrfA gene in the experimental strain. The better growth by the experimental strain at 16 mM nitrite is likely due to the decreased metabolic burden with respect to the control, as it did not have to overexpress a protein. The higher concentration of ammonium accumulation by the experimental strain at 16 mM is likely due to the E. coli native nitrite reductase activity under the anaerobic culturing condition.
Data Analysis (Round 3):
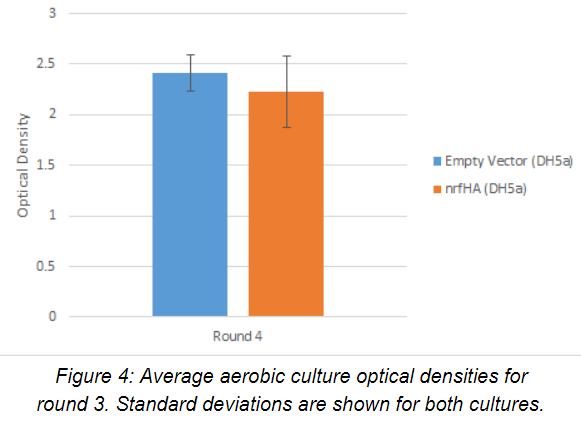
E. coli strain containing the empty vector (pSB1C3) was used for the control in round 3, while our experimental strain contained the nrfHA plasmid. The cell chassis used for both strains was DH5α, which showed better transformation efficiency. Due to time constraints, we were only able to characterize the new nrfHA strains once.
Average optical density readings (n=2) for the aerobic seed cultures after 24 hours of growth for round three are shown below in Figure 4. Experimental and control strains had comparable growth under aerobic conditions.
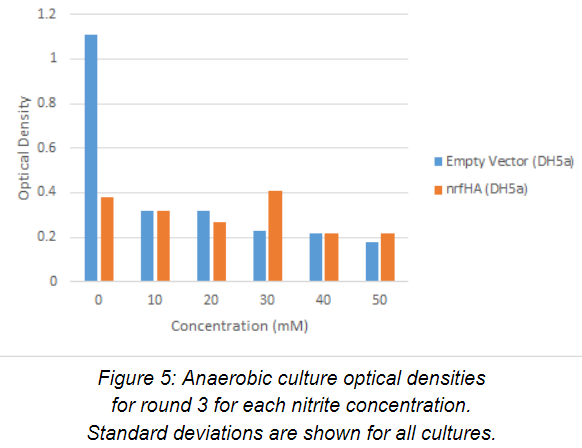
Optical density of anaerobic cultures (n=1) for round three after 24 hours of growth are plotted against nitrite concentration in the media in Figure 5. A much larger range of nitrite concentrations (0-50 mM) were examined in this round. The control grew significantly faster than the experimental strain in the 0 mM nitrite media. This suggests that the difference in metabolic burden caused by production of the nitrite reductase enzyme may be exacerbated by the anaerobic conditions. However, only one experiment was performed with these strains, so additional data would need to be obtained to confirm the hypothesis. In media containing nitrite (10-50 mM), both strains had poor growth, and optical densities were very low across the board. This suggests that neither strain could survive in the tested nitrite concentrations.
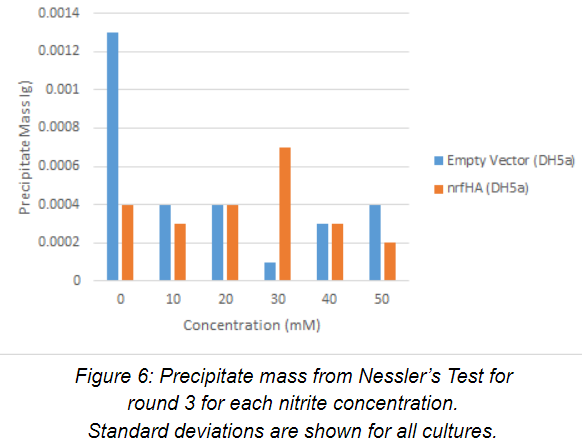
Nessler’s Test was performed (n=1) on the cell-free supernatant of each culture. Precipitate data for round 3 is displayed below for each nitrite concentration in Figure 6. Nessler’s Test data largely paralleled the optical density measurements for the anaerobic cultures. The relatively large precipitate mass present in the control strain at 0 mM suggests that E. coli produces ammonium as a byproduct of its own metabolism. This conclusion is supported by the first two rounds of experimentation as well. For the rest of the cultures, precipitate mass was extremely low, with the small spike at 30 mM nitrite in the experimental strain, which can either be explained by experimental error or a potential increase in nitrite reductase activity. Again, more data is needed to clarify this observation.
Bromoperoxidase
Background
Seaweed is now being studied as a food additive because it has been shown to reduce the amount of methane produced by cattle. The compound within seaweed that is responsible for reducing methane is bromoform. Bromoform works by inhibiting the efficiency of the methyltransferase enzyme by reacting with the reduced vitamin B12 cofactor required for the second to last step of methanogenesis. We set out to successfully insert a plasmid containing a bromoperoxidase enzyme from the algae corallina pilulifera into an E. coli chassis. Once a successfully transformed strain was produced, we could then begin testing how it would fare in conditions similar to the rumen of a cow.
Testing
- Successfully introduce a plasmid containing the bromoperoxidase gene into an E. coli chassis.
- Perform protein purification procedures to isolate the bromoperoxidase enzyme.
- Use the isolated enzyme in the monochlorodimedone enzyme assay.
- Mix the isolated enzyme with potassium bromide, monochlorodimedone and the MOPS buffer in a UV Transparent plate reader.
- Record the absorbance at 290 and ensure that it is constant.
- Add hydrogen peroxide to catalyze the reaction and record the decrease in absorbance at 290.
Data Analysis
After a couple of attempts we successfully cloned bromoperoxidase into the pSB1C3 backbone. We had an inclination that the eighth colony on the bromoperoxidase agar plate was cloned correctly when we performed PCR with primers that replicated at the prefix and suffix and obtained the results shown below.

Under the B8 label two bright bands can be seen. This was a good sign that our gene insert was successfully cloned into our E. coli. We used the iGEM primers VF2 and VR that were designed to replicate at the prefix and suffix site. After we obtained a thick bright band as a result we knew that the prefix and suffix sites were present in our plasmid. The next step was to sequence our plasmid to ensure that it was cloned without deletions or mutations. We spent the next week or so fully sequencing the plasmid. The sequencing results were positive and ensured us that the bromoperoxidase gene was successfully cloned into our E. coli without mutations.
After receiving this great news we immediately started protein purifications to see if the bromoperoxidase protein was being produced. If the E. coli is producing the bromoperoxidase protein then a band should be seen at 64 kDa. The resulting SDS Page is shown below.

There is a small band present in the 500 mM imidazole wash at approximately 64 kDa. This indicates that a small amount of enzyme is being produced. This was a positive sign. Due to our constitutive promoter we were worried that our protein might not be expressed at a noticeable rate. We would suggest that if any other team continues this experiment they should start from the beginning with an inducible promoter. This will help later with characterizing the part. With the constitutive promoter only a small amount of the enzyme was being produced at its natural expression rate.
Next we performed the monochlorodimedone enzyme assay. We used cell lysate first and a control composed of bromide ions, monochlorodimedone and a buffer, but no cell lysate. We catalyzed both solutions with hydrogen peroxide according to the protocol.


If the monochlorodimedone is being brominated by our enzyme then the absorbance at 290 should decrease. This is exactly what we found.


The results above indicate that the enzyme is performing its designed function because monochlorodimedone is being brominated. This is shown by the decrease in absorbance in the cell lysate compared to the decrease in absorbance of the control solution. Although both the control and the cell lysate show a decrease in absorbance, the cell lysate has a steeper slope indicating greater absorbance. The data points for the cell lysate also had a higher R2 value of .889 compared to the R2 value of .195 (control). This shows that the data points from the cell lysate are significantly closer to the fitted regression line. This is a good sign that our data is following a trend and decreasing while the control seems to be increasing and decreasing randomly.
The next step in analyzing the data is to determine how many units of monochlorodimedone can be brominated per milliliter of enzyme. One unit will catalyze the conversion of 1.0 micromole of monochlorodimedone to monobromochlorodimedone per min at pH 6.4 at 25°C. To do this use the equation shown below


After this calculation was done the cell lysate was found to be converting 0.0043 units of monochlorodimedone per milliliter of enzyme. This proves that the enzyme is working as expected. To perform further characterization more assays were performed.
Next the cell lysate containing bromoperoxidase was tested again to ensure that the results still showed a decrease in absorbance at 290. The cell lysate was compared to the control solution along with a cell lysate containing the empty vector pSB1C3.

Both reactions were catalyzed with hydrogen peroxide as referenced in the protocol.


The above results further display that our part is working as expected. When hydrogen peroxide is added to the cell lysate containing bromoperoxidase there is a negative slope indicating a decrease in absorbance. When hydrogen peroxide is added to the empty vector the slope has a positive value indicating an increase in absorbance. Both cell lysates stick to their regression lines roughly the same amount. The bromoperoxidase cell lysate has a R2 value of 0.693 and the empty vector cell lysate has a R2 value of 0.652. This shows that both reactions followed their trend line to a significant degree. This is good news because it means that our data was not random, instead it was being controlled by the bromination of monochlorodimedone into monobromochlorodimedone.
In this trial the cell lysate was found to be converting 0.00094 units of monochlorodimedone per milliliter of enzyme. The cell lysate with the empty vector was converting -0.0019 units of monochlorodimedone per milliliter of enzyme. This makes sense because the empty vector was not brominating monochlorodimedone.

Next we compiled the data from all of our trials using the cell lysate with bromoperoxidase and compared it to the control solution that was used in every trial. Below is a graph showing the results.

Statistical analysis shows that the cell lysate from E. coli containing the bromoperoxidase plasmid has significant activity. Although the cell lysate showed positive results we wanted to test the purified enzyme. Unfortunately, we were not able to perform a test on the purified enzyme itself, because there were issues with the protein purification method used. We used the Ni-NTA Purification System, but in the literature the DEAE-Sepharose Fast Flow column was used. If another iGEM team were to continue our project we would suggest avoiding the Ni-NTA Purification System and using the DEAE-Sepharose Fast Flow column method. We hypothesize that the His tag purification method did not work well because our enzyme is vanadium dependent. The vanadium ions at the active center act similarly to the immobilized nickel ions present in the resin. Because of this, the nickel ion may interfere with the binding of the vanadium ion in the active site and cause the purified enzyme to lose activity.
Thanks to Our Sponsors
