Difference between revisions of "Team:IISc-Bangalore/Results"
| Line 27: | Line 27: | ||
</figure> | </figure> | ||
| − | <p>It was found that the particle size increased considerably on addition of chitosan. The data from the Dynamic light scattering experiment is plotted in Figure 3. It was seen that at very high chitosan concentration, the R<sub>H</sub> dropped back to a nominal value. This might be due to a lysis of the vesicles when they were incubated at extremely high concentration of acetic acid.</p> | + | <p>It was found that the particle size increased considerably on addition of chitosan. The <a href="https://static.igem.org/mediawiki/2017/8/89/T--IISc-Bangalore--Model-ChitosanData.xlsx">data</a> from the Dynamic light scattering experiment is plotted in Figure 3. It was seen that at very high chitosan concentration, the R<sub>H</sub> dropped back to a nominal value. This might be due to a lysis of the vesicles when they were incubated at extremely high concentration of acetic acid.</p> |
<figure> | <figure> | ||
Revision as of 19:57, 1 November 2017


| Sponsors | |||||
|---|---|---|---|---|---|
 |
 |
 |
|||
 |
 |
||||
| Contact | |||||
|---|---|---|---|---|---|
|
|
|
|||

Chitosan
Chitosan
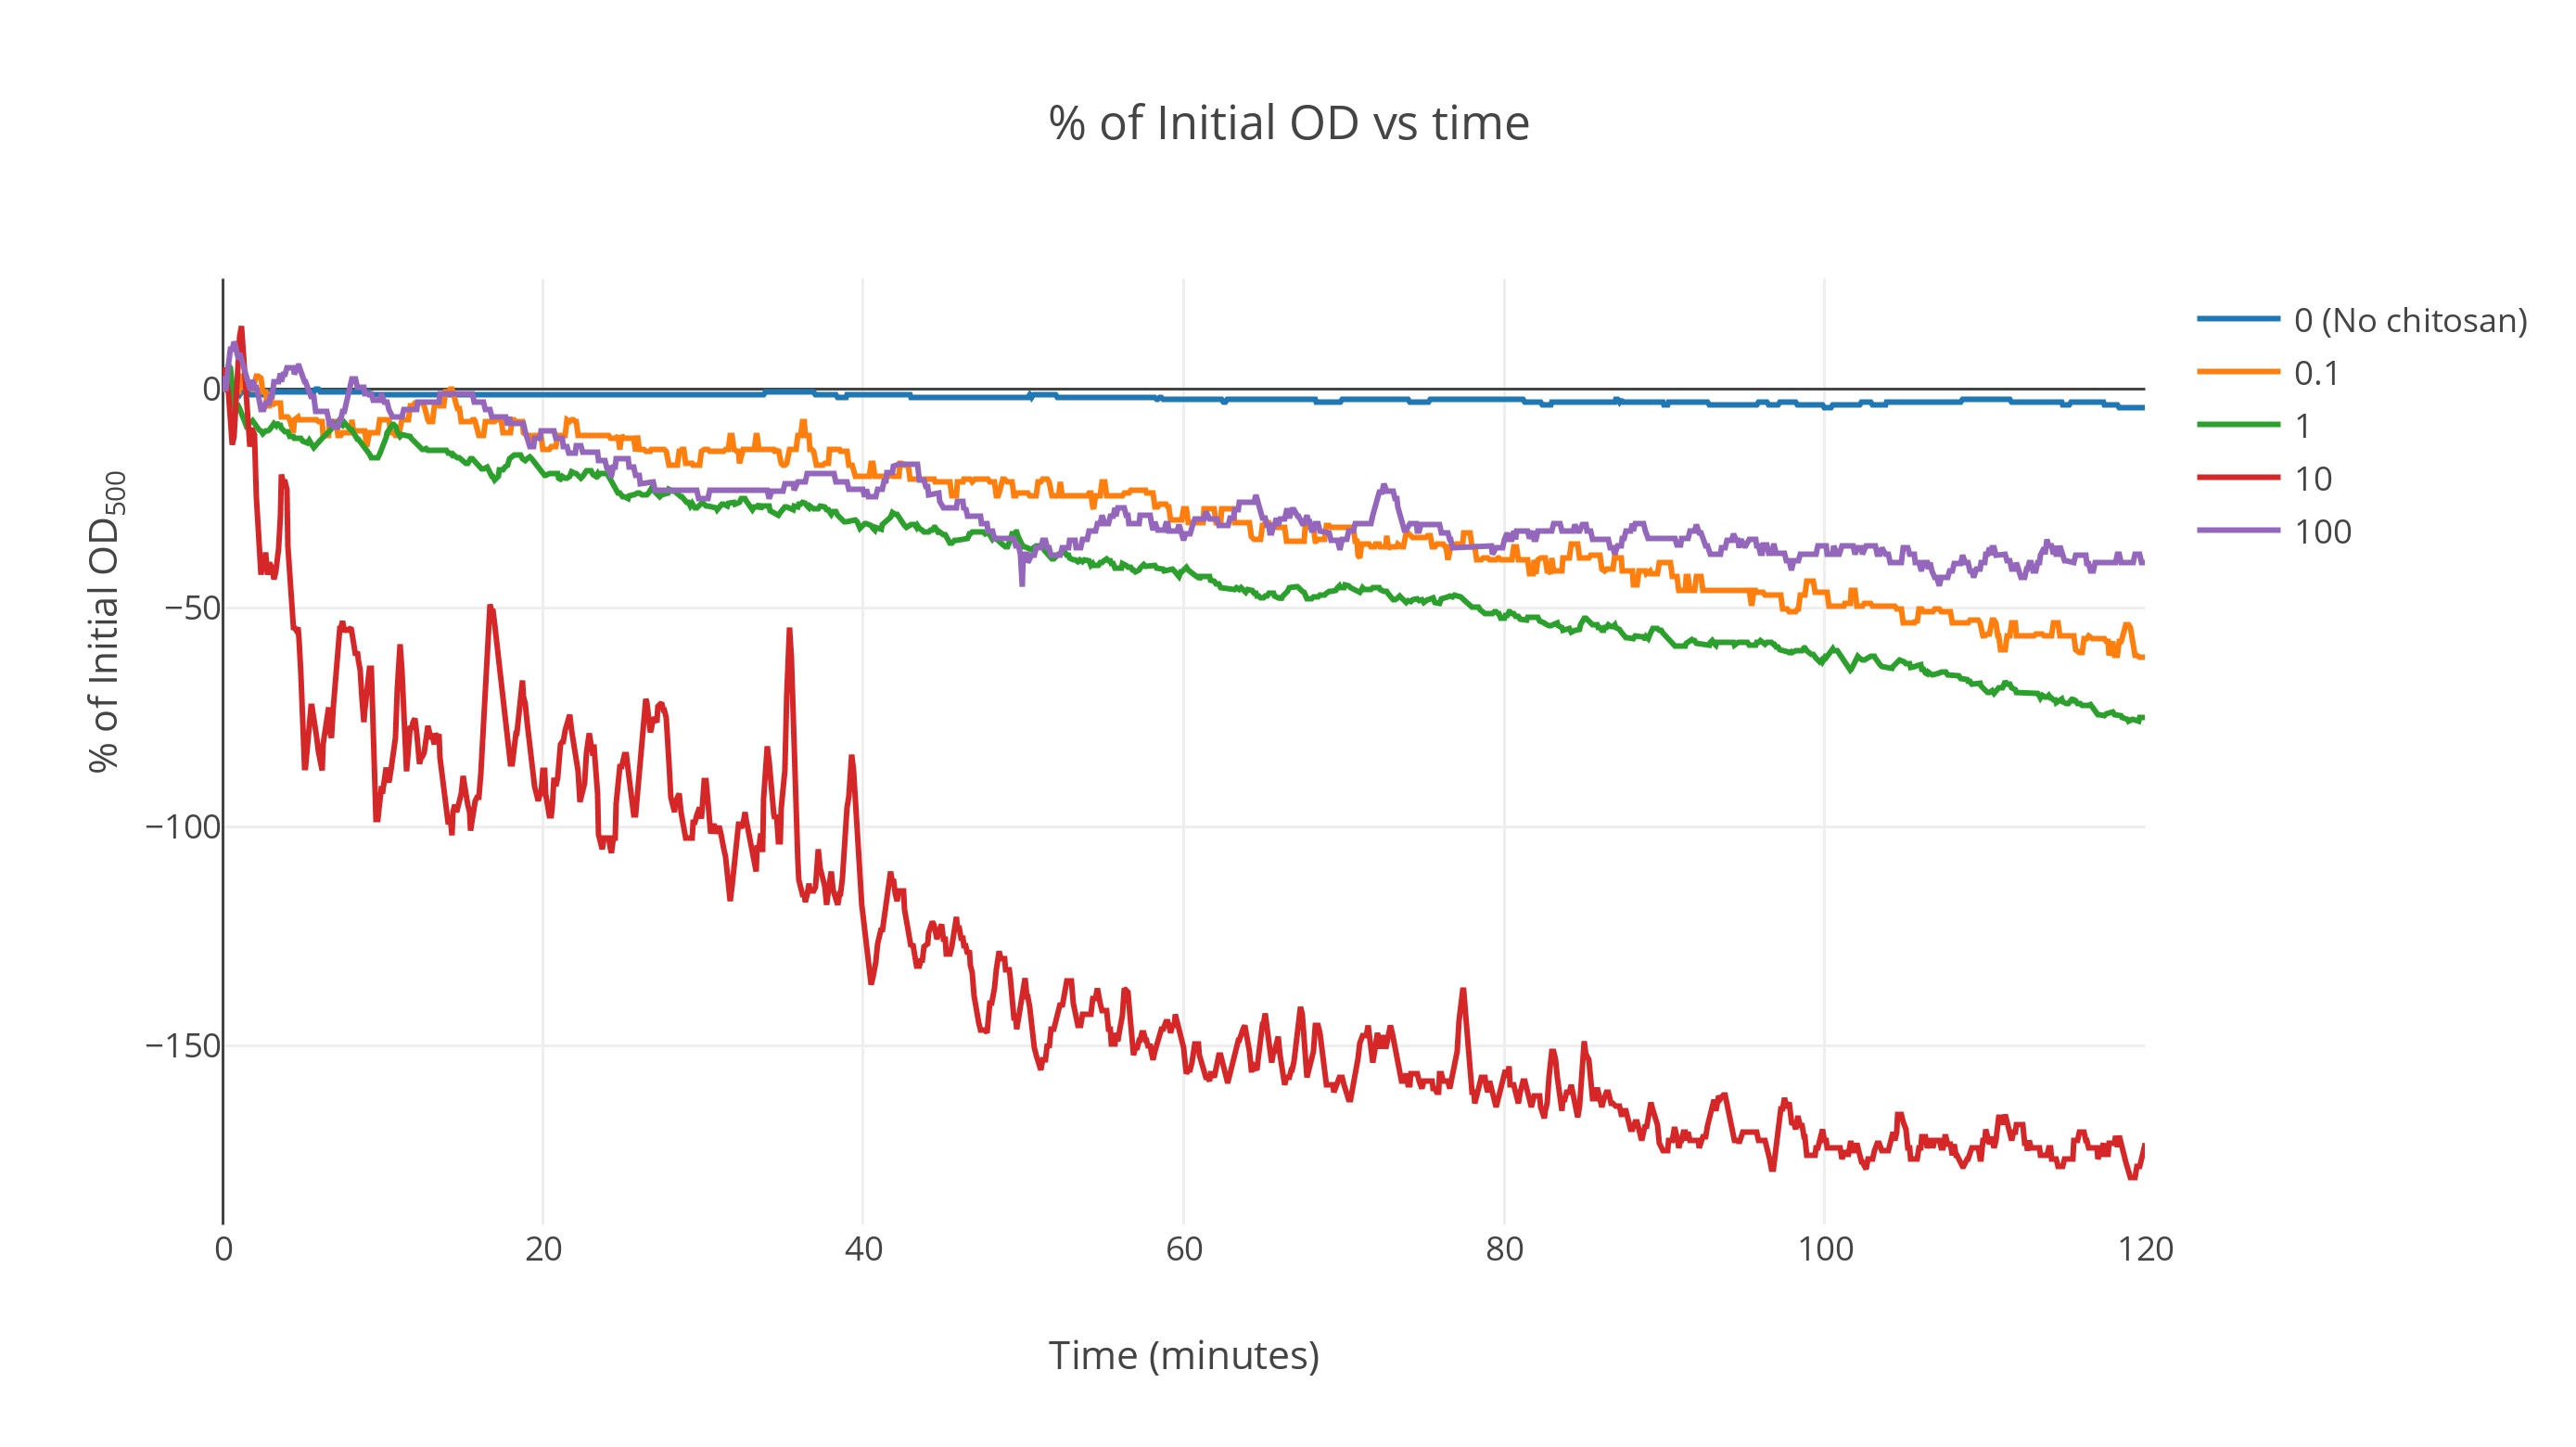
The data when averaged over the replicates shows a marked faster decrease in OD as time passes for chitosan treated gas vesicles. The gas vesicles without chitosan show no significant decrease over a duration of two hours while the ones with an intermediate chitosan concentration show a fast decrease at the start which saturates as time passes. All other curves lie above this one (Fig 1). At very high concentrations, it was seen that the saturation point shifted upwards. We postulate this is because of the gas vesicles being irreversibly denatured by the action of excessive acetic acid concentration during chitosan incubation. More detailed analysis can be conducted to find the optimum concentration at which maximum flotation is achieved. From these results, we expect it to be around the 500ng/ul order of magnitude.
The plot was smoothed out over a window of 85 data points giving the smooth profiles. (Fig 2)

It was found that the particle size increased considerably on addition of chitosan. The data from the Dynamic light scattering experiment is plotted in Figure 3. It was seen that at very high chitosan concentration, the RH dropped back to a nominal value. This might be due to a lysis of the vesicles when they were incubated at extremely high concentration of acetic acid.
