Team:IISc-Bangalore/Results


| Sponsors | |||||
|---|---|---|---|---|---|
 |
 |
 |
|||
 |
 |
||||
| Contact | |||||
|---|---|---|---|---|---|
|
|
|
|||

Chitosan
Chitosan
Four different concentrations of chitosan were added to gas vesicle suspensions (30 µl stock) and the resulting solutions were diluted to 2 mL to perform a flotation spectrophotometry assay.
| Sample Label | Effective gas vesicle concentration (ng/μl) |
Effective chitosan concentration (ng/μl) |
Remarks (Relative concentration) |
|---|---|---|---|
| 1 | 15 | 0 | Control tube (0) |
| 2A | 15 | 5 | First replicate (0.1) |
| 2B | 15 | 5 | Second replicate (0.1) |
| 3A | 15 | 50 | First replicate (1) |
| 3B | 15 | 50 | Second replicate (1) |
| 4A | 15 | 500 | First replicate (10) |
| 4B | 15 | 500 | Second replicate (10) |
| 5A | 15 | 5000 | First replicate (100) |
| 5B | 15 | 5000 | Second replicate (100) |
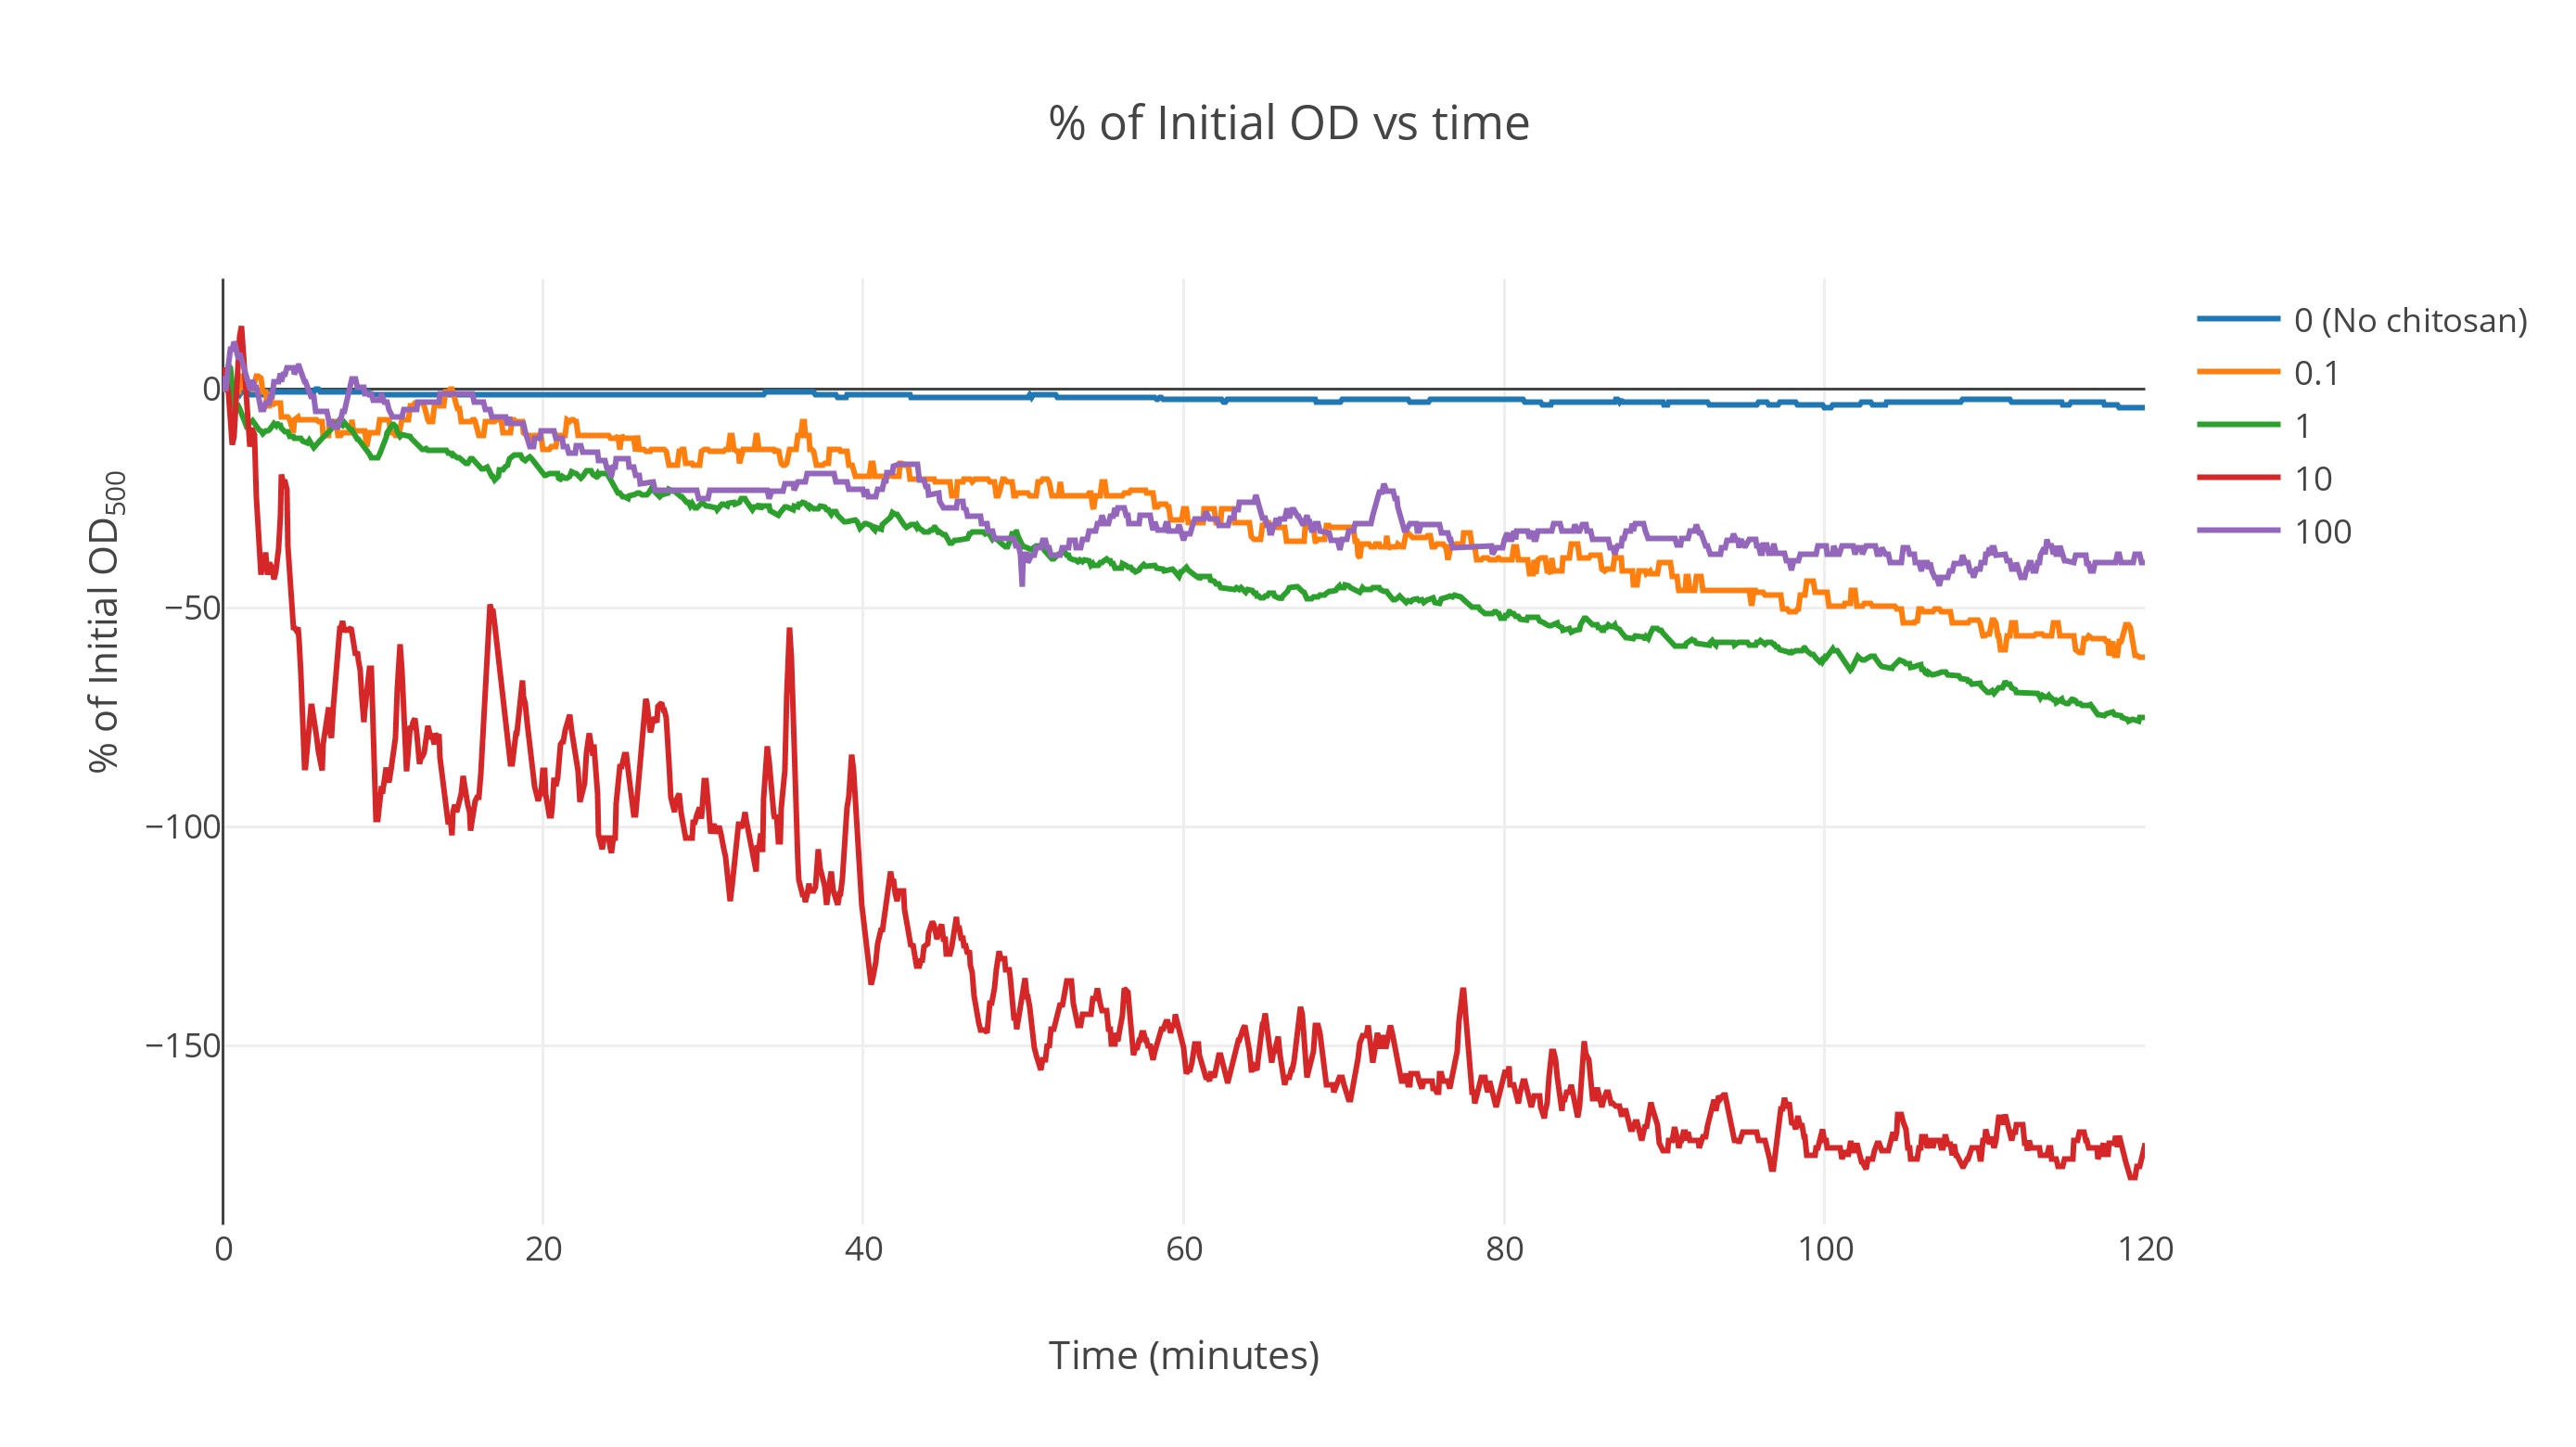
Averaged over the replicates, the data shows a markedly-faster decrease in OD with time for chitosan-treated gas vesicles. The control gas vesicle suspensions (without chitosan) show no significant decrease in OD over a duration of two hours while the suspensions with intermediate chitosan concentrations show a fast decrease at the start which saturates as time passes. All other curves lie above this one (Fig 1).
At very high concentrations, the saturation point shifted upwards. We postulate that this is because of the irreversible denaturation of gas vesicles by the action of excess acetic acid during chitosan incubation. A more detailed analysis can be conducted to determine the optimum concentration at which maximum flotation is achieved. From these results, we expect it to this optimal concentration be around 500 ng/µl.
The plot was smoothed out over a window of 85 data points giving the smooth profiles. (Fig 2)

It was found that the particle size increased considerably on addition of chitosan. The data from the Dynamic Light Scattering experiment is plotted in Figure 3. Again, at very high chitosan concentrations, the RH dropped back to a nominal value, probably due to lysis of the vesicles during incubation with concentrated acetic acid.

Biotin-Streptavidin
NHS-biotin was used to biotinylate gas vesicles and these biotinylated gas vesicles were incubated with streptavidin to allow aggregation. This experiment was conducted in two ways.
Method I:
Our protocol for biotinylation requires the addition of NHS-biotin in greater than or equal to a 20 fold molar excess. The first strategy that was adopted to discourage binding of streptavidin was to add the streptavidin in excess. As each streptavidin molecule can potentially bind to four biotins, a 1/4 molar ratio would imply proper stoichiometry for the reactions. We settled with a 1:2 and 1:1 ratio of streptavidin:biotin to ensure that all biotin in the suspension is sequestered.
Method II:
The second method we used to remove excess biotin was enrichment of the gas vesicles by centrifugation. After incubation with NHS-biotin, the gas vesicles were centrifuged at 500 rpm overnight to allow them to float to the top. This was followed by removal of the upper layer and incubation with quantities of streptavidin on the order of number of gas vesicles in the suspension. The measurements were repeated thrice for all samples.
| Sample Label | Effective gas vesicle concentration (ng/µl) |
Effective NHS-Biotin concentration (ng/µl) |
Effective Streptavidin concentration (ng/µl) |
Remarks |
|---|---|---|---|---|
| S2Ctrl | 15 | 300 | 0 | Control (no streptavidin) |
| SB | 15 | 300 | 100 | Method I |
| SC | 15 | 300 | 200 | Method I |
| S21 | 15 | 300 | 1 | Method II |
| S23 | 15 | 300 | 3 | Method II |
| S25 | 15 | 300 | 5 | Method II |
All the above experiments gave negative results, with the particle sizes for both the treated and untreated vesicles being similar to each other. This could mean either of these two possibilities:
- NHS-Biotin was unable to biotinylate the GvpA amine residues, or
- Our methods were unable to eliminate unnecessary free biotin-streptavidin interactions.
The first possibility eliminates the chance of using biotin-streptavidin for future experiments. No spectrophotometry assays were carried out with these solutions due to the absence of positive results from the DLS experiments. The following graph shows the particle sizes recorded at different concentrations of streptavidin.
