Difference between revisions of "Team:UNOTT/Experiments"
| (38 intermediate revisions by 4 users not shown) | |||
| Line 246: | Line 246: | ||
<div class="expandable-boxes"> | <div class="expandable-boxes"> | ||
<div class="expandable-box"> | <div class="expandable-box"> | ||
| − | <h4 style="color: #ffffff; font-weight: bold; font-size: 30px;">STEP 1: Create guideRNA Plasmid </h4> | + | <h4 style="color: #ffffff; font-weight: bold; font-size: 30px;">STEP 1: Create guideRNA Plasmid </h4><center><img class="icons" src="https://static.igem.org/mediawiki/2017/7/7e/T--UNOTT--gRNAp.png" style="width:400px;height:auto;"></center> |
<div id="clear2" style="display: none;"><div class="whitebox"> | <div id="clear2" style="display: none;"><div class="whitebox"> | ||
<div class="whiteboxmargin"> | <div class="whiteboxmargin"> | ||
<h1>Why</h1> | <h1>Why</h1> | ||
| − | <p> | + | <p>In our experiment, the production of differentially identifiable expression patterns is paramount. A library of promoters with robust expression patterns was required to achieve this. To further modulate the expression patterns, a promoter targeted short guide RNA (sgRNA)-Cas9 repression system was devised. These sgRNAs have a 20bp SEED region homologous to the promoter between the -10 and -35 box, a deactivated Cas9 associates with the sgRNA and is directed to the promoter through it’s homology, this will inhibit the RNA polymerase as it’s very large and bind with a high affinity. The strength of inhibition is proportional to the binding afinity of the SEED region. <br> |
| + | A two vector based system was decided upon to express this system. One low copy vector will express the catalytically inactive Cas9 protein, promoters and a downstream reporter; the other will contain the sgRNAs and a high copy origin of replication (ori). Confining the sgRNAs to a separate vector is advantageous in that it can be easily substituted out for another vector, potentially detailing sgRNAs with a differing affinity to the promoter. This interchangeability can facilitate a ‘plug and play’ system to produce a multitude of expression levels with ease. | ||
| + | </p> | ||
<h1>How</h1> | <h1>How</h1> | ||
| + | <p> Refer to step 2 for plasmid construction.To select for a dual transformation, each vector backbone requires separate antibiotic resistances. Consequently, the high copy vector (containing sgRNAs) was given an erythromycin resistant cassette, the low copy backbone was given a Chloramphenicol resistance cassette. Each vector also required a gram-negative compatible ori. High copy ColE1 was present on the sgRNA vector to drive high expression and promoter inhibition. A low copy pSC101 ori was initially given to the other, as dCas9 is toxic in high concentrations. | ||
| + | Another set of sgRNAs were designed to have no inhibitory activity, termed sgRNA0s. The ‘seeds’ were not homologous to any of the promoter, whereas the other set were 100% homologous. This will act as a control, to signify how the expression will differ when inhibition is occurring. It will also serve later to increase the pool of possible expression patterns when we come to the random ligation experiments. These were cloned using traditional type II restriction cloning with BsaI sites.<br><br> | ||
| + | To construct the sgRNAs, primer dimers were PCR amplified to generate the initial fragments of the sgRNA, it’s promoter, and terminator; also with their complimentary BsaI sites. After digestion with BsaI, the fragments were linearly ligated to produce promoter-sgRNA-terminator ‘bricks’. These were then amplified using a set of ‘universal’ primers designed to be capable of amplifying all of our ‘bricks’, these primers were complementary to a multiple cloning site (MCS) flanking each brick we produced. These sgRNA bricks were then digested with this MCS and ligated into their associated high copy backbone. | ||
| + | </p> | ||
<h1>Results</h1> | <h1>Results</h1> | ||
| + | <p>For the CRISPRi results check step 6 and the lab-book for more in detail descriptions of the prodution of the gRNA and gel images.</p> | ||
| Line 278: | Line 285: | ||
<div class="whiteboxmargin"> | <div class="whiteboxmargin"> | ||
<h1>Why</h1> | <h1>Why</h1> | ||
| + | <p>To create a stepwise and logical order of production, a reporter plasmid was constructed firstly, out of only various promoter types, mRFP and terminators, to allow for testing. This was then escalated to include dCas9 for the final experiment.<p/> | ||
<h1>How</h1> | <h1>How</h1> | ||
| + | <center><img src="https://static.igem.org/mediawiki/2017/a/a1/T--UNOTT--brickstitching.jpeg"></center> | ||
| + | <p>Each individual Promoter-Reporter-Terminator brick contains interchangeable parts. The three parts are linked together with Bsa1 sites so that there is no preference for any part when ligating together. This allows randomness to be added later. This method is used also for the construction of Promoter-gRNA-Terminator bricks so that this could be randomised in the future. The bricks are then flanked by a prefix and suffix, and these are flanked by restriction sites ABCD on either end. Digestion of bricks with A+B, B+C, and C+D allows any brick to be placed in any position within the plasmid but it would be pre-determined. This means that the no one promoter-reporter-terminator brick would be limited to one specific place in the plasmid, which allows another level of randomness in assembly as we would not know which reporter was being placed where, which could also affect expression levels.</p> | ||
| + | <p>The arrangement of the DCBA restriction system means that any brick can be placed in any position in the plasmid which allows expansion of possibilities whilst maintaining randomness of insertion later. Bricks can be joined together via amplifying each randomly assembled brick through common amplification sites and then cutting them using a set of restriction enzymes which give each plasmid a specific order of bricks, depending on which are cut and then ligated together.</p> | ||
| + | <center><img src="https://static.igem.org/mediawiki/2017/c/c3/T--UNOTT--multiplebricks.jpeg"></center> | ||
| + | |||
| + | <p>This was then used for the promoter library.</p> | ||
| + | |||
| + | <p>After this, the same method as above was used for the final dCas9 including vector. However with an addition of dCas9 in the final ligation phase. In this way two promoter libraries were produced.</p> | ||
<h1>Results</h1> | <h1>Results</h1> | ||
| + | <p>For results check steps 3 and 4.</p> | ||
| Line 300: | Line 317: | ||
<div class="whiteboxmargin"> | <div class="whiteboxmargin"> | ||
<h1>Why</h1> | <h1>Why</h1> | ||
| + | <p> | ||
| + | To establish the relative strength of every single promoter, each of them must be tested and their expression level measured throughout the bacterial growth. This will provide data to demonstrate it is possible to differentiate between them, proving that our key will work effectively by having identifiable spectral states. Getting unique spectral profiles is a cause of concern as the excitation and emission spectra of RFP, CFP and GFP overlap somewhat and cross excitation will occur, perhaps masking CFP’s emissions and reducing the potential for separate keys to be identifiable. To fully address this, a promoter library was constructed to assess the promoter’s strength. | ||
| + | </p> | ||
<h1>How</h1> | <h1>How</h1> | ||
| + | <p>This growth curve was carried as described in week 15 of the lab book, please refer for full details. To summarise, overnight cultures of each specimen were inoculated into a new batch of media. These were then grown at 37°C for 24 hours, with measurements of OD600nm absorbance and fluorescence carried at 0, 2, 4, 6, and 24 hours. The promoters were paired with a downstream RFP reporter gene.</p> | ||
<h1>Results</h1> | <h1>Results</h1> | ||
| − | <img src="https://static.igem.org/mediawiki/2017/3/30/T--UNOTT--Promoterpoolstrength.png"> | + | |
| − | <img src="https://static.igem.org/mediawiki/2017/ | + | <p><table> |
| + | <tr><img src="https://static.igem.org/mediawiki/2017/3/30/T--UNOTT--Promoterpoolstrength.png"></tr> | ||
| + | <tr><img src="https://static.igem.org/mediawiki/2017/3/30/T--UNOTT--Promoterpoolstrength.png"></tr> | ||
| + | <tr><th>Figure 1. This graph shows the relative fluorescent intesnity of strong and weak RBS promoters SP1-E and WP1-4. These were grown for a 24 hour period and measurements were taken at 0, 2, 4, 6, 9, and 24 hours.</th></tr></table> | ||
| + | <br>Figure 1 illustrates the strengths of each set of strong (SP) and weak (WP) RBS promoters, the first graph being the SPs 1, 2, 3, 4, 5, and E. E is a null promoter which will produce no expression, providing an additional control like sgRNA0 is for the gRNA parts design. It will help making sure no unspecific interference happens when no promoter is present. The second graph shows W1-4. It is clear there are some extremely different expression levels. SP3 and SP4 are quite similar with peaks of 5500-5800 a.u. at 24 hours; it would be hard to discern between them, but these are significantly the strongest promoters and would be useful as a ‘maximum’ expression promoter. SP1 and W4 are also quite comparable with peak around 3000 a.u., these would be considered intermediate/strong promoters. W3, W1, SP2 and perhaps SP5 are all relatively similar with peaks from 900-1700 a.u. at 24 hours. These would be considered weak promoters, they would be useful in a triple reporter experiment to act as the separate targets for the sgRNAs and see if they have distinct inhibited states. W2 is by far the weakest active promoter, with a peak at >500 it would be classed as the weakest promoter, perhaps serving as a minimum activation promoter. SE as expected produced no expression, and can be concluded it will work as a negative control or null promoter. | ||
| + | In conclusion, it is promising that we have 5 distinct states of expression with maximal, strong, weak, minimal, and off. There is also the opportunity to have SP2, W1, W2 and maybe SP5 to act as a way to discern how effective the sgRNA:dCas9 inhibition, owing to their similar expression patterns. | ||
| + | </p> | ||
| + | |||
| + | |||
</div> | </div> | ||
</div> | </div> | ||
| Line 317: | Line 346: | ||
<div class="expandable-box"> | <div class="expandable-box"> | ||
| − | <h4 style="color: #ffffff; font-weight: bold; font-size: 30px;">STEP 4: Random Ligations</h4><center><img class="icons3" src="https://static.igem.org/mediawiki/2017/ | + | <h4 style="color: #ffffff; font-weight: bold; font-size: 30px;">STEP 4: Random Ligations</h4><center><img class="icons3" src="https://static.igem.org/mediawiki/2017/9/93/T--UNOTT--Randomligation.png" style="width:300px;height:auto;"></center> |
<div id="clear5" style="display: none;"> | <div id="clear5" style="display: none;"> | ||
<div class="whitebox"> | <div class="whitebox"> | ||
<div class="whiteboxmargin"> | <div class="whiteboxmargin"> | ||
<h1>Why</h1> | <h1>Why</h1> | ||
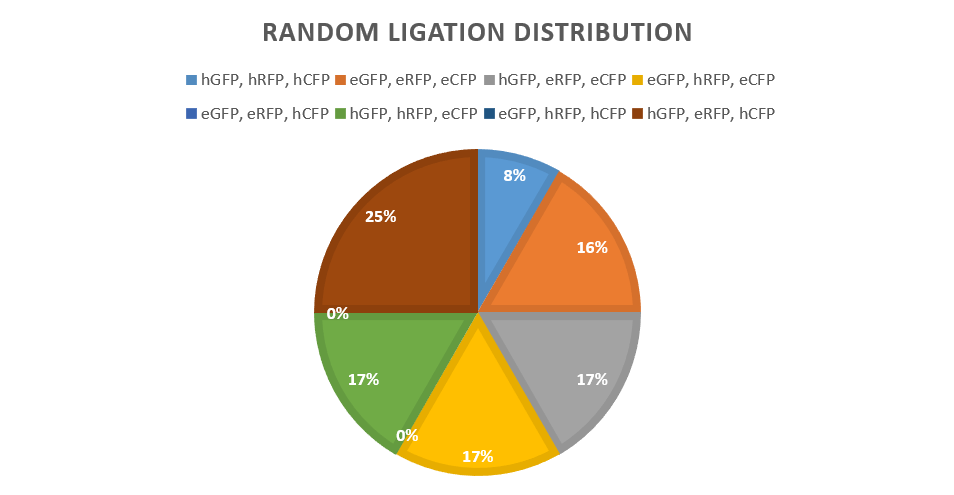
| − | <p> The random ligation of different promoter-protein bricks is an experiment to test the viability of a brownian motion driven random ligation process. This random ligation is the basis for the unpredictability of a large scale key design process. The experiment hoped to produce a random mixture of fluorescent protein expression levels. This random mixture of multiple proteins in a single vector would then show the viability of the Key.coli restriction enzyme-ligation process for achieving unpredictability for keys.</p> | + | <p> The random ligation of different promoter-protein bricks is an experiment to test the viability of a brownian motion driven random ligation process. This random ligation is the basis for the unpredictability of a large scale key design process. The experiment hoped to produce a random mixture of fluorescent protein expression levels. This random mixture of multiple proteins in a single vector would then show the viability of the <i>Key. coli</i> restriction enzyme-ligation process for achieving unpredictability for keys.</p> |
<h1>How</h1> | <h1>How</h1> | ||
| − | <p> The | + | <p> The strongest and weakest promoters were chosen to give the most easily visible result, promoters E and 4. Promoter 4 gives a high expression of fluorescent proteins, as shown by our promoter library findings. The promoters were then attached to each reporter protein CFP, RFP and GFP via BsaI digestion and ligation along with a terminator to form six "brick" variants. After amplification of the bricks produced via PCR, seven products combinations were ligated to a low copy backbone in the pattern of red, green and blue fluorescent proteins, consistently through the controlled use of the DCBA digestion site. Each ligation has only one ligation slot (due to availability of restriction cut sites) per reporter colour, leaving random chance to produce a combination of all the possible variants in the random ligations where multiple promoters are available.</p> |
| + | <p> | ||
| + | e= empty promoter, h= high expression promoter</p> | ||
| + | <p> e= empty promoter, h= high expression promoter</p> | ||
| + | <p><span style="color: #ffffff;"> </span></p> | ||
| + | <p><span style="color: #ffffff;"> </span></p> | ||
<center><img src="https://static.igem.org/mediawiki/2017/a/a1/T--UNOTT--brickstitching.jpeg"></center> | <center><img src="https://static.igem.org/mediawiki/2017/a/a1/T--UNOTT--brickstitching.jpeg"></center> | ||
| + | <p><span style="color: #ffffff;"> </span></p> | ||
| + | <p><span style="color: #ffffff;"> </span></p> | ||
<p> These bricks were ligated with the backbone as follows: </p> | <p> These bricks were ligated with the backbone as follows: </p> | ||
<li> eRFP-eGFP-eCFP - Low expression in all reporters</li> | <li> eRFP-eGFP-eCFP - Low expression in all reporters</li> | ||
| Line 332: | Line 368: | ||
<li> eRFP-hGFP-eCFP - Low expression in RFP and CFP, but High expression of GFP</li> | <li> eRFP-hGFP-eCFP - Low expression in RFP and CFP, but High expression of GFP</li> | ||
<li> eRFP-eGFP-hCFP - Low expression in RFP and GFP, but High expression of CFP</li> | <li> eRFP-eGFP-hCFP - Low expression in RFP and GFP, but High expression of CFP</li> | ||
| − | <li> eRFP | + | <li> eRFP-hGFP-hCFP - Low expression in RFP, but High expression of GFP and CFP</li> |
| + | <li> hRFP-eGFP-hCFP - Low expression in GFP, but High expression of RFP and CFP</li> | ||
| + | <li> hRFP-hGFP-eCFP - Low expression in CFP, but High expression of RFP and GFP</li> | ||
| + | <p><span style="color: #ffffff;"> </span></p> | ||
| + | <p><span style="color: #ffffff;"> </span></p> | ||
<p> This produced a control for each reporter fluorescent protein in isolation. It also produced a control for all reporters on either highest expression or lowest expression. This finally also produced a random set of colonies for isolation (after transformation) for comparison and test for true randomness.</p> | <p> This produced a control for each reporter fluorescent protein in isolation. It also produced a control for all reporters on either highest expression or lowest expression. This finally also produced a random set of colonies for isolation (after transformation) for comparison and test for true randomness.</p> | ||
<h1>Results</h1> | <h1>Results</h1> | ||
| Line 362: | Line 402: | ||
<div class="whiteboxmargin"> | <div class="whiteboxmargin"> | ||
<h1>Why</h1> | <h1>Why</h1> | ||
| − | <p>For <i>Key. coli</i> to | + | <p>For <i>Key. coli</i> to become a success, the ability to transport the bacterial key in a safe way whilst maintaining a sample of viable cells with similar expression patterns is vital. The <i>Key. coli</i> cells can either be kept in a metabolically active state or in a freeze dried, metabolically inactive state. The first option has two major disadvantages: a continues supply of nutrients will have to be provided and through successive bacterial generations genetic drift will occur, meaning that cells will lose certain traits, traits that are not essential for the applied growth conditions. The reporters we will be expressing inside the cell will not be essential for cell survival and thus will be lost, hence the key will no longer be functional. The second option, storing freeze dried cells inside a sealed capsule, allows ‘semi’ long term storage with very little phenotypic change and no need for nutrients. In addition, they are very quickly activated when properly mixedwith recovery medium and nutrients. </p> |
| − | + | ||
| − | + | ||
| − | + | ||
| − | + | ||
| − | + | ||
| − | </p> | + | |
<br> | <br> | ||
| + | <p>When the cells are revived, their reporter levels will need to be measured to ascertain the key’s identity. This brings into question how fast and accurately this process can and should occur. When cells are freeze dried, any proteins are also locked; after revival, there will be residual amounts of the reporter present in approximately the correct proportions. Although these signals are present and representative, they will be low and not optimal, after 4 hours the cells will have grown substantially to produce an appropriate level of reporter to measure. With the experiment described below we show that freeze drying cells is a reliable and reproducible way to store the <i>Key. coli</i> cells.</p> | ||
<br> | <br> | ||
<h1>How</h1> | <h1>How</h1> | ||
| − | <p> | + | <p>The cells were freeze dried in accordance with a protocol we devised, for further details <a style="font-weight:bold;" href="https://static.igem.org/mediawiki/2017/b/b5/T--UNOTT--FreezeDryingProtocol.pdf"> click here</a>. To summarise, colonies of our bacteria were grown overnight to produce a batch of our specimen. New media was inoculated with our bacteria and grown for 24 hours, with OD<sub>600nm</sub> absorbance and fluorescence intensity at 0, 2, 4, 6, 8, and 24 hour timepoints. Just before the bacteria enter the stationary growth phase, a 1 ml sample was taken for freeze drying. The cells were washed twice with water before resuspending the cells in a 10% sterile sucrose solution.The sucrose solution acts as our cryo-protectant, therefore the cell resuspension was incubated for 5 minutes on the becnh to allow the sucrose to build up inside the cell. Subsequently, the samples were snap frozen in liquid nitrogen at -200°C and placed on dry ice. After all samples were frozen, the tube lids were pierced and placed in a chilled vacuum chamber overnight to remove all present moisture</p> |
<h1>Results</h1> | <h1>Results</h1> | ||
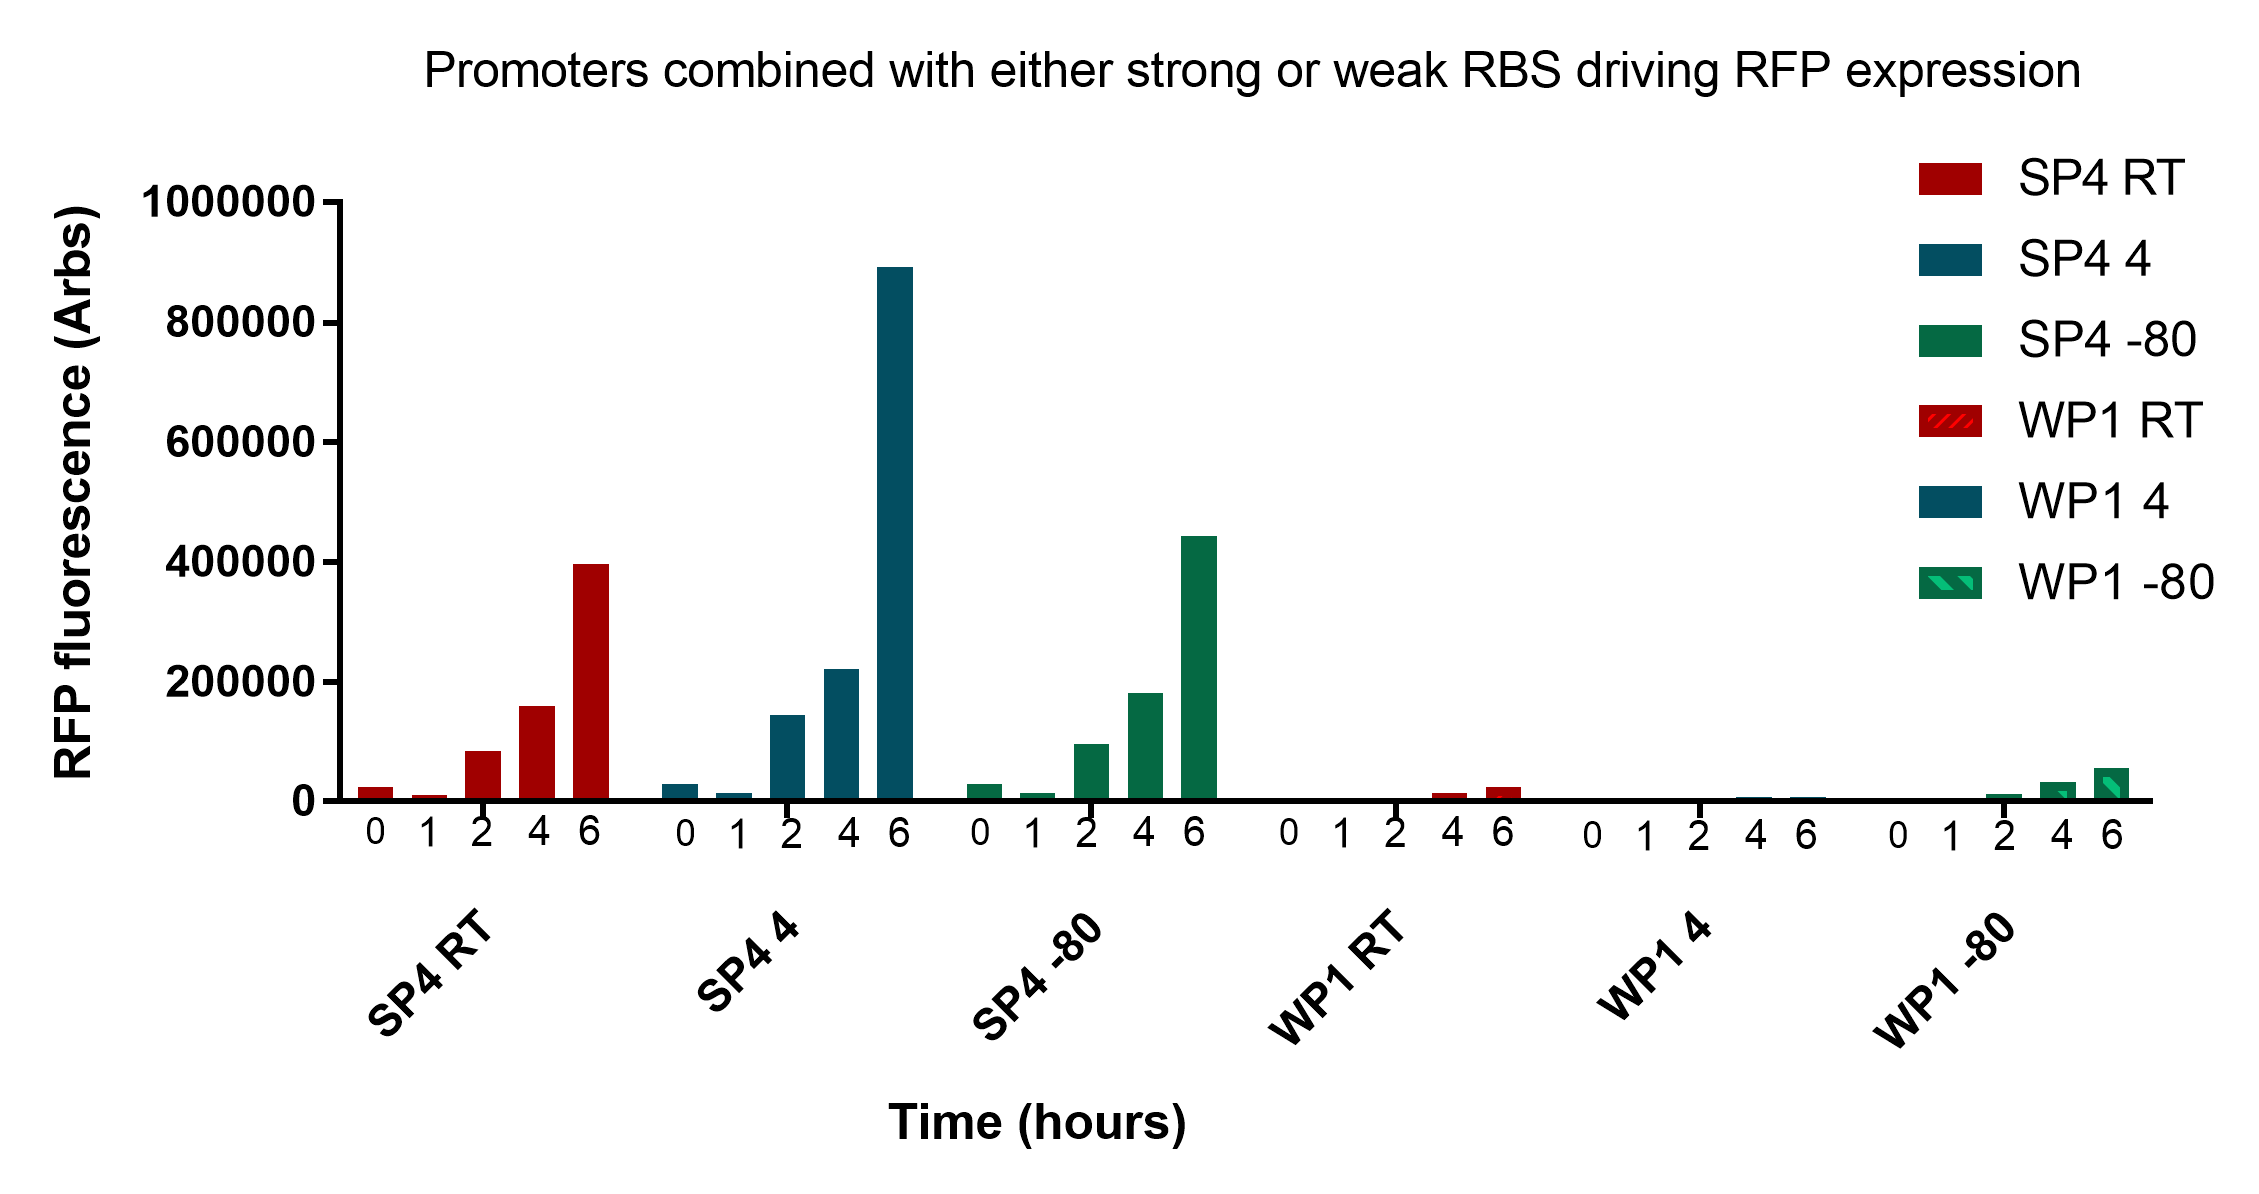
| − | <img src="https://static.igem.org/mediawiki/2017/4/40/T--UNOTT--SP4WP1RFP.png"> | + | <p>The results presented in figure 1 show that the two promoters, SP4 and WP1, are clearly distinct from each other at every stage of revival and storage time. This information is important as we will need to calibrate the thresholds for identification accordingly. The data also shows that storing the cells for two weeks at different temperatures has no to little effect on the reporter expression.</p> |
| − | <p class="imgcaption"><b>Figure 1:</b> Graph of strong promoter 4 and weak promoter 1 transformed cells RFP fluorescence assay after freeze-drying revival two weeks and three weeks after samples were freeze dried. </p> | + | <table><tr><img src="https://static.igem.org/mediawiki/2017/4/40/T--UNOTT--SP4WP1RFP.png"></tr> |
| + | <p class="imgcaption"><tr><th><b>Figure 1:</b> Graph of strong promoter 4 and weak promoter 1 transformed cells RFP fluorescence assay after freeze-drying revival two weeks and three weeks after samples were freeze dried.</th></tr></table> </p> | ||
| + | <br> | ||
| + | <p>However, there is a notable decease in fluorescence from 2 to 3 weeks at room temperature, especially pronounced at 4 and 6 hour after revival.. This problem may be mitigated in that the drop offs seem proportional to both WP1 and SP4, so the ratios of expression may remain the same. Having said this, the differences in expression would be within the bounds of the thresholds set to compare the two, as even with the changes they would still be identifiable. One might argue that the need to set so many time and storage dependent thresholds makes the system unnecessary complicated. To minimise the described variables that need to be taken into consideration keys stored at room temperature should be replaced after two weeks. Keys which require long term storage should be stored at -80°C.</p> | ||
| + | <br> | ||
| + | <p>Interestingly, as predicted there is a substantial amount of fluorescence detectable 2 hours after revival, suggesting that a bacterial key could possibly be identifiable with little waiting period. However, they are undoubtedly more pronounced at 4 and 6 hours which would likely to be a more accurate time to measure.</p> | ||
| + | <p><table><tr><img src="https://static.igem.org/mediawiki/2017/f/f4/Groningen_data_revival.jpeg";></tr> | ||
| + | <tr><th> Figure 2. This graph represents data kindly given to us by the University of Groningen. It details the revival of the two samples containing strong RBS promoter 4 and weak RBS promoter 1 with a RFP reporter. These were grown for an 6 hour period and fluorescence measurements were taken at 0, 1, 2, 4, and 6 hours. One sample each was stored at either room temperature, 4<sup>o</sup>C, or -80<sup>o</sup>C.</th><tr></table></p><br> | ||
| + | <p> | ||
| + | In figure 2, samples were transported to the University of Groningen through the postal courier service, so the samples at -80<sup>o</sup>C would not have been at this temperature for the entire duration up until measuremment. With this in mind, it still appears what was discussed before still holds true. </p> | ||
| + | <br> | ||
| + | <p>In conclusion, these results are very promising and show that cells remain viable and reliably express the reporter for up to three weeks at convenient storage conditions necessary for our key to work in a practical sense. The two promoters SP4 and WP1 are very distinct and easily discernible. There still remains a significant amount of viable bacteria regardless of storage conditions and their fluorescence intensity is very comparable at all stages of growth. It is worth noting that measurements were taken at 0 and 1 hours in figure 2, and these showed minimal fluorescent intensity, suggesting that further optimisation needs to occur to achieve 0-1 hour readings. For details on the revival protocol, download <a style="font-weight:bold;" href="https://static.igem.org/mediawiki/2017/9/9d/Revival_protocol.docx">here.</a></p> | ||
<br> | <br> | ||
| + | <p>For future research, this process could be optimised to produce even more reproducible results and yield a more robust identification process. Distinct 0 hour expression levels might also be possible, greatly increasing the potential of <i>Key. coli</i> becoming a common security system. Multiple reporters should be the next focus to strengthen the security of the key. All reporters will need to be tested for their stability and reproducibility. </p> | ||
<br> | <br> | ||
| − | <p> | + | <img src="https://static.igem.org/mediawiki/2017/9/91/T--UNOTT--GroningenData.png" style="width:100%;height:auto;"> |
| + | <p class="imgcaption"><tr><th><b>Figure 3:</b> Testing the affect of storage time at various storage temperatures (Room temperature, 4°C and -80°C) on the fluorescence of revived cells expressing strong or weak RFP expression</th></tr></table></p> | ||
<br> | <br> | ||
<br> | <br> | ||
| Line 399: | Line 447: | ||
<div class="whiteboxmargin"> | <div class="whiteboxmargin"> | ||
<h1>Why</h1> | <h1>Why</h1> | ||
| + | <p>In our experiment, the production of differentially identifiable expression patterns is paramount. A library of promoters with robust expression patterns was generated to achieve this (step 3 to 5). To further modulate the expression patterns, a promoter targeted short guide RNA (sgRNA)-dcas9 repression system was devised. Using such a system will add a third expression level to the already existing ON and OFF states of our system, expanding the options further.</p> | ||
| + | <p>The sgRNAs have a 20bp ‘SEED’ region homologous to the promoters (used in step 3) between the -10 and -35 box, which will form a complex with a deactivated Cas9. The complex will be directed to the promoter through the homology between promoter sequence and the sgRNA. Binding of this very big RNA-protein complex to the promoter sequence will inhibit recognition and binding of RNA polymerase to the promoter region due to allosteric hindrance. The strength of inhibition is related to the binding affinity of the complex to the target DNA. Ideally, each promoter will have its own unique sgRNA which only inhibits the intended promoter to prevent cross interference.</p> | ||
<h1>How</h1> | <h1>How</h1> | ||
| + | <p>To exemplify that the presence of a repression system would allow an increase in possible key outputs so we decided to start with a simple proof of function experiment. Therefore, we decided to go for a two plasmid based system. </p> | ||
| + | <p>One low copy vector was used to express both the catalytically inactive Cas9 protein and the RFP reporter, fused to any of the five promoters previously tested in step 3. Using a low-copy plasmid for the expression of reporter and dCas9 was a precautionary measure, as high levels of dCas9 can be toxic to the cells due to unspecific binding to other regions of the genome. Starting the experiments with only one reporter would allow us to easily establish how well each sgRNA represses the complementary promoter. The second plasmid was comprised of the sgRNAs and a high copy origin of replication (ori). Confining the sgRNAs to a separate vector is advantageous in that it can be easily substituted out for another vector, potentially detailing sgRNAs with a differing affinity to the promoter. This interchangeability can facilitate a ‘plug and play’ system to produce a multitude of expression levels with ease.</p> | ||
| + | <p>To select for a dual transformation, each vector backbone requires separate antibiotic resistances. Consequently, the high copy vector (containing sgRNAs) was given an chloramphenicol resistant cassette, the low copy backbone was given a erythromycin resistance cassette. </p> | ||
| + | <p>As a control, a sgRNA 0 was added to the library. The ‘SEED’ region of this sgRNA is not homologous to any of the promoters. This will act as a control, to signify how the expression will differ when inhibition is occurring. It will also serve later to increase the pool of possible expression patterns when we come to the random ligation experiments . These were cloned using traditional type II restriction cloning with BsaI sites.</p> | ||
| + | <p>To construct the sgRNAs, primer dimers were PCR amplified to generate the initial fragments of the sgRNA, it’s promoter, and terminator; also with their complimentary BsaI sites. After digestion with BsaI, the fragments were linearly ligated to produce promoter-sgRNA-terminator ‘bricks’. These were then amplified using a set of ‘universal’ primers designed to be capable of amplifying all of our ‘bricks’, these primers were complementary to a multiple cloning site(MCS) flanking each brick we produced. These sgRNA bricks were then digested using this MCS and ligated into their associated high copy backbone.</p> | ||
<h1>Results</h1> | <h1>Results</h1> | ||
<img src="https://static.igem.org/mediawiki/2017/c/c1/T--UNOTT--gRNAs.png"> | <img src="https://static.igem.org/mediawiki/2017/c/c1/T--UNOTT--gRNAs.png"> | ||
| − | + | <p>The above graph shows characterization of the sgRNAs. As you can see, gRNA3, 4 and 5 are repressing well. gRNA 1 and 2 have no repression, and P<sub>E</sub> shows that there is very little expression as a background level.</p> | |
</div> | </div> | ||
</div> | </div> | ||
Latest revision as of 03:59, 2 November 2017

EXPERIMENTS:
STEP 1: Create guideRNA Plasmid

STEP 2: Create Reporter Plasmid


STEP 3: Promoter Library


STEP 4: Random Ligations

STEP 5: Freeze Drying & Revival


STEP 6: CRISPRi & gRNA Efficiency


![]()


