Team:UiOslo Norway/InterLab
InterLab Measurement Study
Once again, the iGEM foundation arranges the InterLab study and invited the teams to participate. This year, the study is centered around GFP-measurement. Specifically, testing the accuracy of GFP intensity measurement by the use of a plate reader, and comparing the data between the teams. Each team was given 8 GFP probes to transform DH5-alpha E. Coli-cells with, and were to measure the cell concentration and GFP excitation intensity of these, and send them in for comparison. The goal was to create a common protocol for GFP measurement in plate readers, by seeing how close the different teams would be able to get their results.At the end of the page there is an Excel document containing all results and calculations throughout fire sheets. During this interlab study we were given an interlab measurement kit providing us with plasmids listed in Table 1: Measurement Kit.
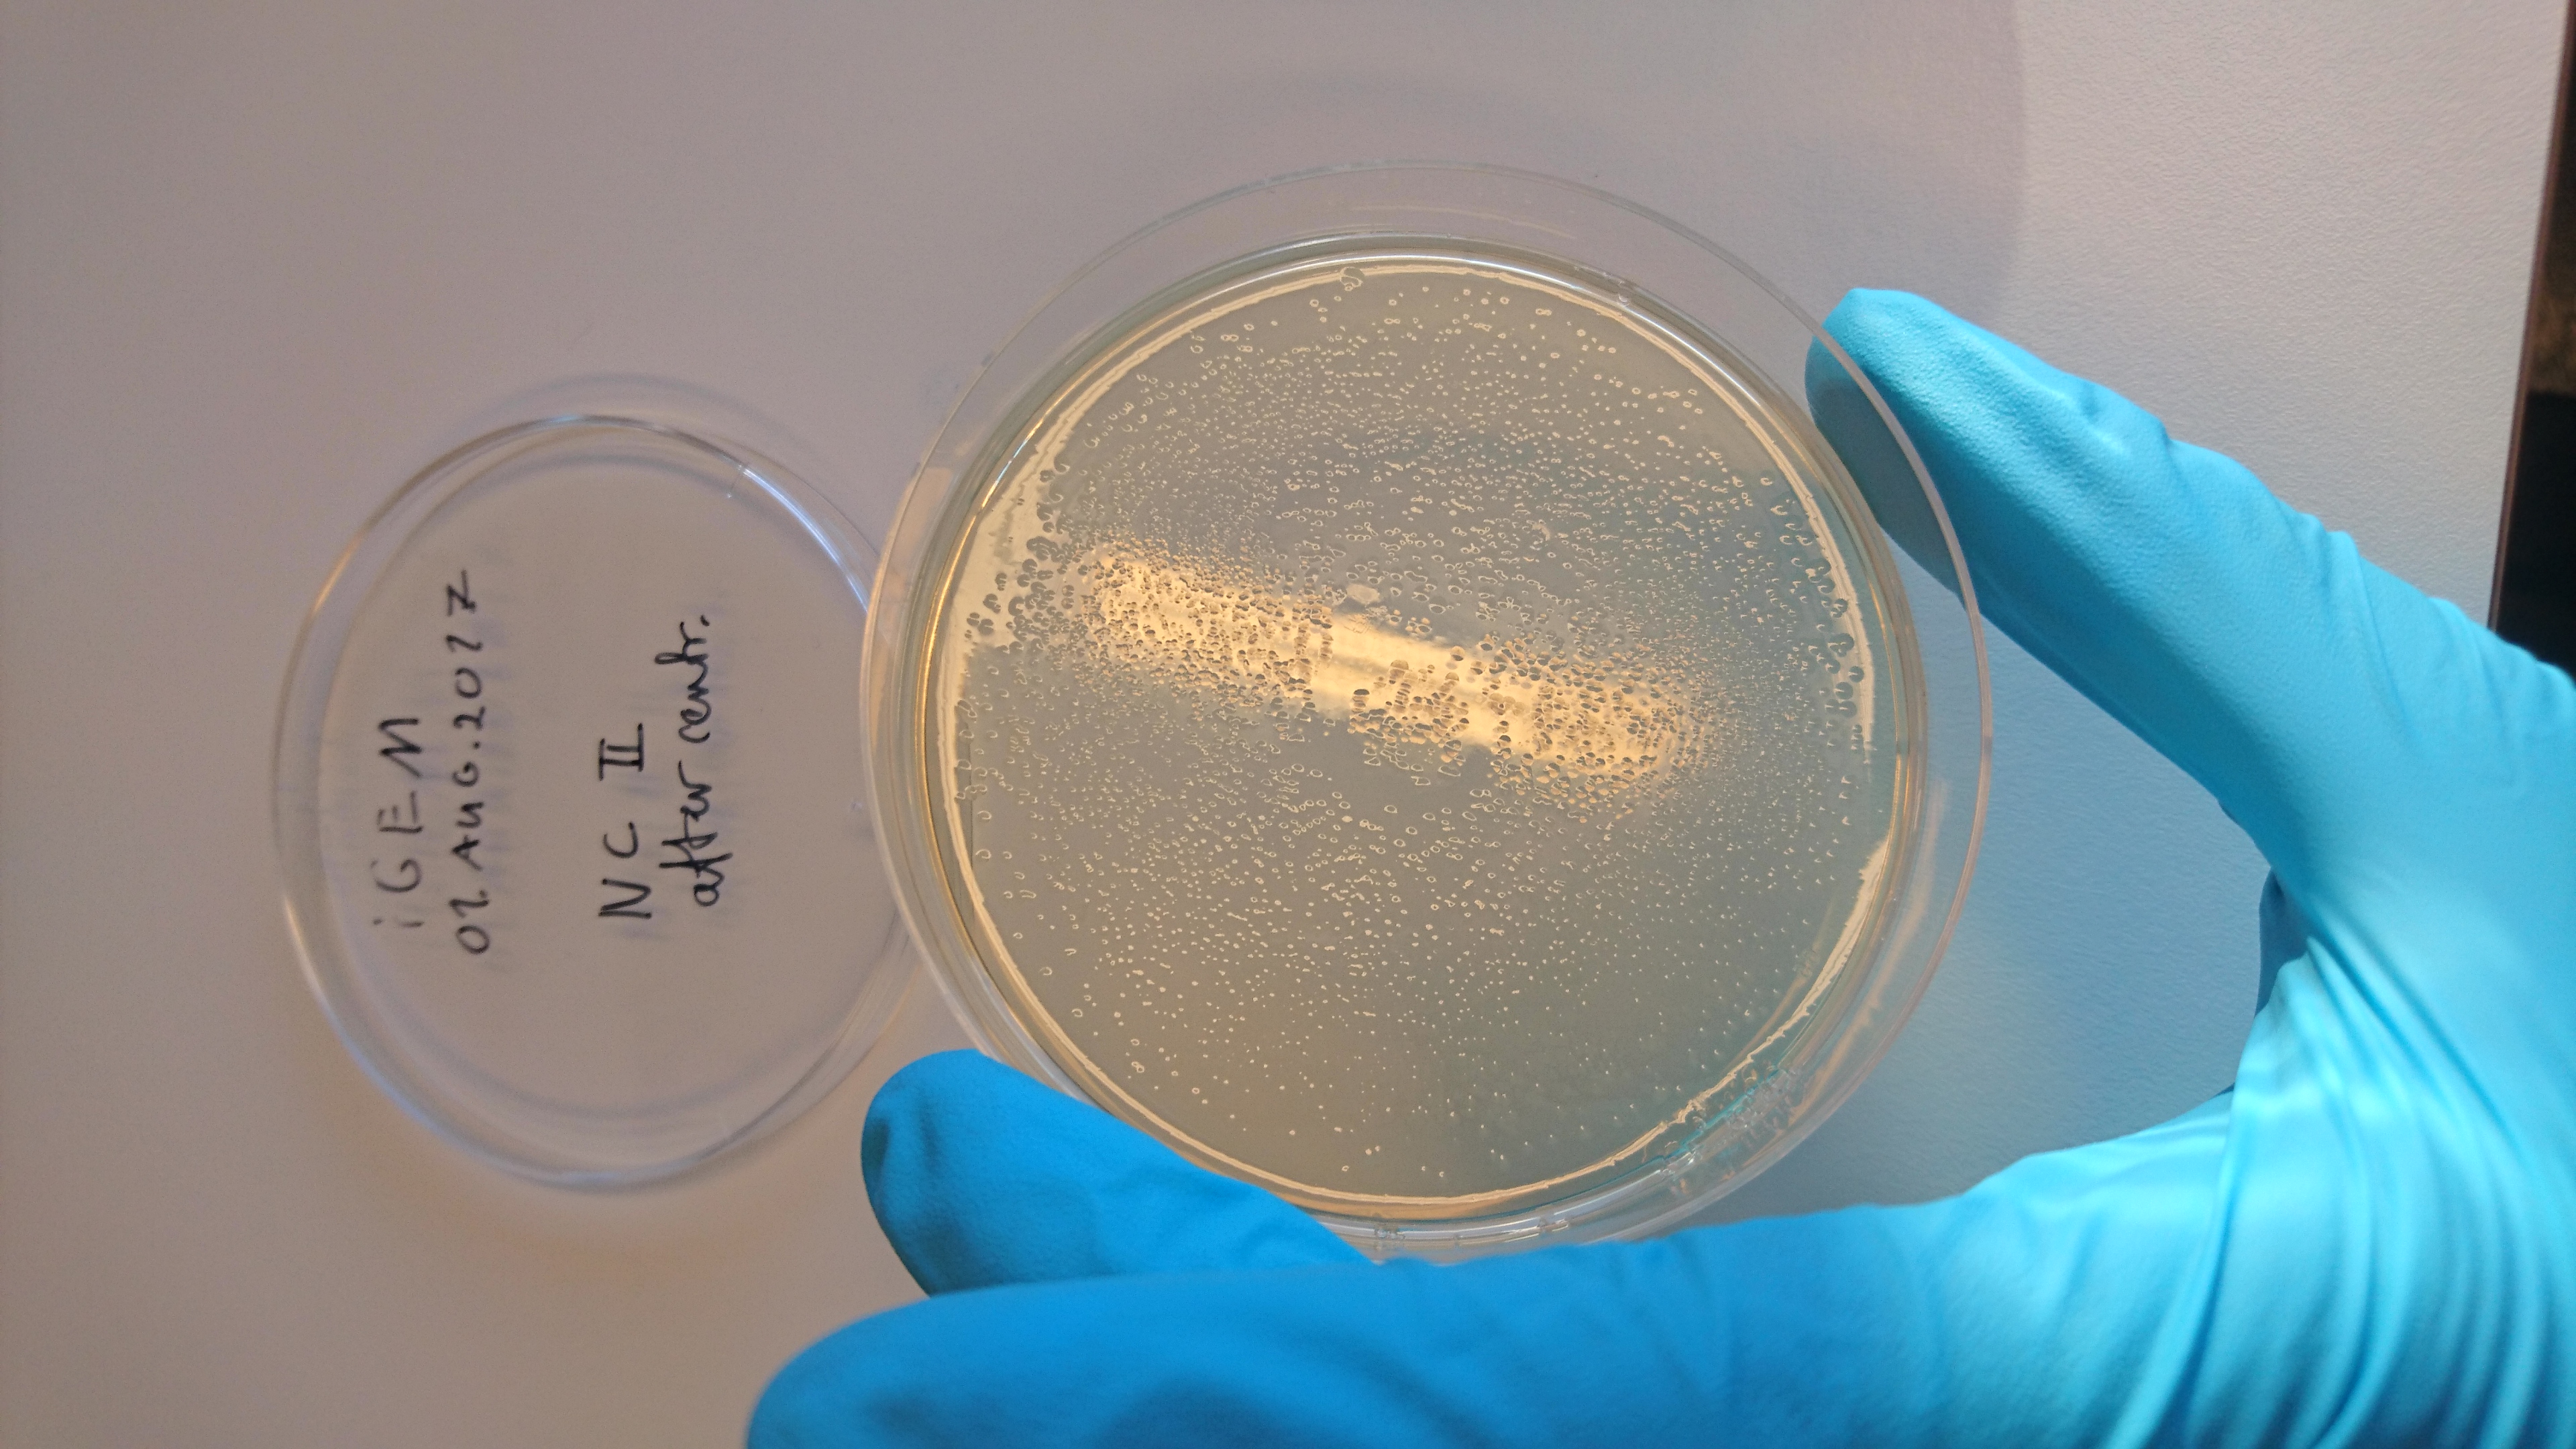
Protocol used is the E.coli DH5Alpha protocol provided form iGEM. Step 15 and 16 was shipped since colony growth indicates successful transformation. Pictures of the plates from step 13 in the protocol are linked to in the tables below.
| Name | Marked on plate | Containing |
|---|---|---|
| Positive control | PC | - |
| Negative control | NC | - |
| TestDevice 1 | T1 | J23101+I13504 |
| TestDevice 2 | T2 | J23106+I13504 |
| TestDevice 3 | T3 | J23117+I13504 |
| TestDevice 4 | T4 | J23101.BCD2.E0040.B0015 |
| TestDevice 5 | T5 | J23106.BCD2.E0040.B0015 |
| TestDevice 6 | T6 | J23117.BCD2.E0040.B0015 |
| Hour 0: | Neg. Control | Pos. Control | Device 1 | Device 2 | Device 3 | Device 4 | Device 5 | Device 6 | LB + Chlor (blank) |
|---|---|---|---|---|---|---|---|---|---|
| Colony 1, Replicate 1 | 0.045 | 0.047 | 0.045 | 0.045 | 0.046 | 0.048 | 0.048 | 0.048 | 0.044 |
| Colony 1, Replicate 2 | 0.047 | 0.047 | 0.047 | 0.05 | 0.044 | 0.049 | 0.047 | 0.048 | 0.042 |
| Colony 1, Replicate 3 | 0.047 | 0.046 | 0.047 | 0.046 | 0.042 | 0.048 | 0.049 | 0.048 | 0.045 |
| Colony 1, Replicate 4 | 0.047 | 0.047 | 0.052 | 0.047 | 0.043 | 0.046 | 0.047 | 0.048 | 0.043 |
| Colony 2, Replicate 1 | 0.051 | 0.053 | 0.048 | 0.049 | 0.059 | 0.048 | 0.049 | 0.054 | 0.045 |
| Colony 2, Replicate 2 | 0.046 | 0.048 | 0.046 | 0.047 | 0.048 | 0.048 | 0.049 | 0.048 | 0.044 |
| Colony 2, Replicate 3 | 0.05 | 0.047 | 0.048 | 0.045 | 0.043 | 0.047 | 0.046 | 0.045 | 0.043 |
| Colony 2, Replicate 4 | 0.048 | 0.048 | 0.048 | 0.048 | 0.047 | 0.048 | 0.047 | 0.048 | 0.044 |