Our results vary from the characteristics of light from a LED to how a protein solution with fluorescent properties (GFP) act when light upon: <br>
+
<div class="row">
−
<ul style="list-style-type:disc">
+
<div class="col-md-12">
−
<li>We managed to create a light source that emitted light in the correct wavelength for the GFP to get excited. This being a homemade LED-circuit with a blue diode.</li>
+
<ul id="tab2" class="nav nav-pills">
−
<li>We proved that there were no fluorescens from the GFP when light upon with green or red light, only when being light upon by the light source that had the correct wavelength (blue LED-circuit).</li>
Our results vary from the characteristics of light from a LED to how a protein solution with fluorescent properties (GFP) act when light upon: <br>
−
Successful transformation of E.coli TOP10 with Gibson solution indicated by bacterial growth on LB plates containing chloramphenicol(25 mg/mL). <br> <br>
+
<ul style="list-style-type:disc">
+
<li>We managed to create a light source that emitted light in the correct wavelength for the GFP to get excited. This being a homemade LED-circuit with a blue diode.</li>
+
<li>We proved that there were no fluorescens from the GFP when light upon with green or red light, only when being light upon by the light source that had the correct wavelength (blue LED-circuit).</li>
+
<li>We managed to verify that you do not need monochromatic light to get fluorescens.</li>
+
<li>We were not able to measure the light emitted from the GFP with a CCD-camera.</li>
+
<li>We got to test multiple setups with the GFP solution, but none proved lasing, at least not with our equipment.</li>
+
<li>In the end we had some red light emitted from the GFP used, this we could see in the spectrometer.</li>
+
</ul>
+
</div>
+
<div class="modelling-picture">
+
<h1>picture1</h1>
−
Results from PCR further confirm an insert of correct length. <br> <br>
+
</div>
+
</div>
+
</div>
−
Sequencing results show as successful insertion into pSB1C3. <a href="https://static.igem.org/mediawiki/2017/a/a7/T--UiOslo_norway--results_cyc1_sequence_7IJ95.txt">Sequencing data provided here</a>. Has a 100% identity with BBa_K2110000.<br> <br>
<div class="tab-pane fade active in" id="tab-item2">
−
Successful transformation of E.coli TOP10 with Gibson solution indicated by bacterial growth on LB plates containing chloramphenicol(25 mg/mL). However there were red colonies persent, <a href="http://parts.igem.org/Help:Protocols/Linearized_Plasmid_Backbones">meaning that they contained an empty vector.</a> <br> <br>
Successful transformation of E.coli TOP10 with Gibson solution indicated by bacterial growth on LB plates containing chloramphenicol(25 mg/mL). <br> <br>
−
Gel from PCR suggested that white colonies do not contain insert, but rather are bacteria that are not chloramphenicol resistant. This occurs when plates are incubated to long and antibiotica has deteriorated. Reason for longer incubation time than recommended is due to the antibiotics used. Chloramphenicol is tougher on bacteria cells than ampicillin and bacteria may need more time to grow. <br> <br>
+
Results from PCR further confirm an insert of correct length. <br> <br>
−
Several attempts have given same result. It been theorized that the reason why nmt1 is harder to insert is caused by its DNA secondary structure; we were informed that this could potentially cause problems when the DNA was syntesized. <br> <br>
−
However, this stepback has caused us to modify gibson assembly protocol. Increase incubation to 1h and dilute the gibson solution to remove some molecules in the Gibson Mix causing trouble during transformation. We have diluted 1:3, but increased the volume used in transformation to 3 times of original volume. Leading to the same volume of plasmid, but ⅓ of the gibson mix. Results show an increased number of transformed colonies from the diluted solution. <br> <br>
+
Sequencing results show as successful insertion into pSB1C3. <a href="https://static.igem.org/mediawiki/2017/a/a7/T--UiOslo_norway--results_cyc1_sequence_7IJ95.txt">Sequencing data provided here</a>. Has a 100% identity with BBa_K2110000.<br> <br>
−
Further results for PCR indicate a insert of right size. Samples have also been sent to GATC for sequencing. <br> <br>
−
Composite part : <br> <br>
−
We faced similar problems with the composite part as with NMT1; likely for the same reasons as above, as the composite part contains the NMT1 sequence and would face the same issues with the secondary structure. We ordered specific primers to create a composite part with 5A overhangs (see Lab Methods) and used these to do 3A assembly on the composite part. This eventually lead to a successful transformation, and this transformation was purified and sent for sequencing. <br> <br>
Successful transformation of E.coli TOP10 with Gibson solution indicated by bacterial growth on LB plates containing chloramphenicol(25 mg/mL). However there were red colonies persent, <a href="http://parts.igem.org/Help:Protocols/Linearized_Plasmid_Backbones">meaning that they contained an empty vector.</a> <br> <br>
Using this <a href="http://www.biomol.net/en/tools/proteinextinction.html">calculator</a>, we calculated the extinction coefficient and molecular weight: <br><br>
+
+
Gel from PCR suggested that white colonies do not contain insert, but rather are bacteria that are not chloramphenicol resistant. This occurs when plates are incubated to long and antibiotica has deteriorated. Reason for longer incubation time than recommended is due to the antibiotics used. Chloramphenicol is tougher on bacteria cells than ampicillin and bacteria may need more time to grow. <br> <br>
−
The same calculations are done for batch nr. 2 (1 mL) and batch nr. 3 (877µL), which are actually samples from column nr. 2, just split into two. The results for these samples are: <br>
−
<ul>
−
<li>batch nr. 2 (1 mL): 5.15 mg</li>
−
<li>batch nr. 3 (877µL): 10.9 mg</li>
−
</ul>
−
This gives total mass of: <br>
−
total mass (sfGFP)=19.3 mg+5.15 mg+10.9 mg=35.35 mg <br> <br>
−
<b>SDS-page</b> <br>
−
<b>Observations</b> <br>
+
Several attempts have given same result. It been theorized that the reason why nmt1 is harder to insert is caused by its DNA secondary structure; we were informed that this could potentially cause problems when the DNA was syntesized. <br> <br>
−
Batch nr. 1 had bright green colour, and we got a lot of precipitation in this solution after dialysis. <br>
+
−
Batch nr. 2 and batch nr. 3 are made out of one sample from dialysis. It was not resuspended after centrifugation so the batch nr. 2 and 3 have different concentrations of sfGFP and amount of precipitation (batch nr. 3 had more precipitation and bigger absorbance). <br>
+
−
<h3>Second experiement</h3> <br>
+
However, this stepback has caused us to modify gibson assembly protocol. Increase incubation to 1h and dilute the gibson solution to remove some molecules in the Gibson Mix causing trouble during transformation. We have diluted 1:3, but increased the volume used in transformation to 3 times of original volume. Leading to the same volume of plasmid, but ⅓ of the gibson mix. Results show an increased number of transformed colonies from the diluted solution. <br> <br>
<figcaption> The isolated sfGFP stored in test tubes at 4ºC after repeating the procedure </figcaption>
+
−
</figure>
+
−
<b>Observations</b> <br>
+
−
The product was green which indicates presence of sfGFP protein. <br> <br>
+
−
<h2 align="center">NTNU collaboration</h2>
−
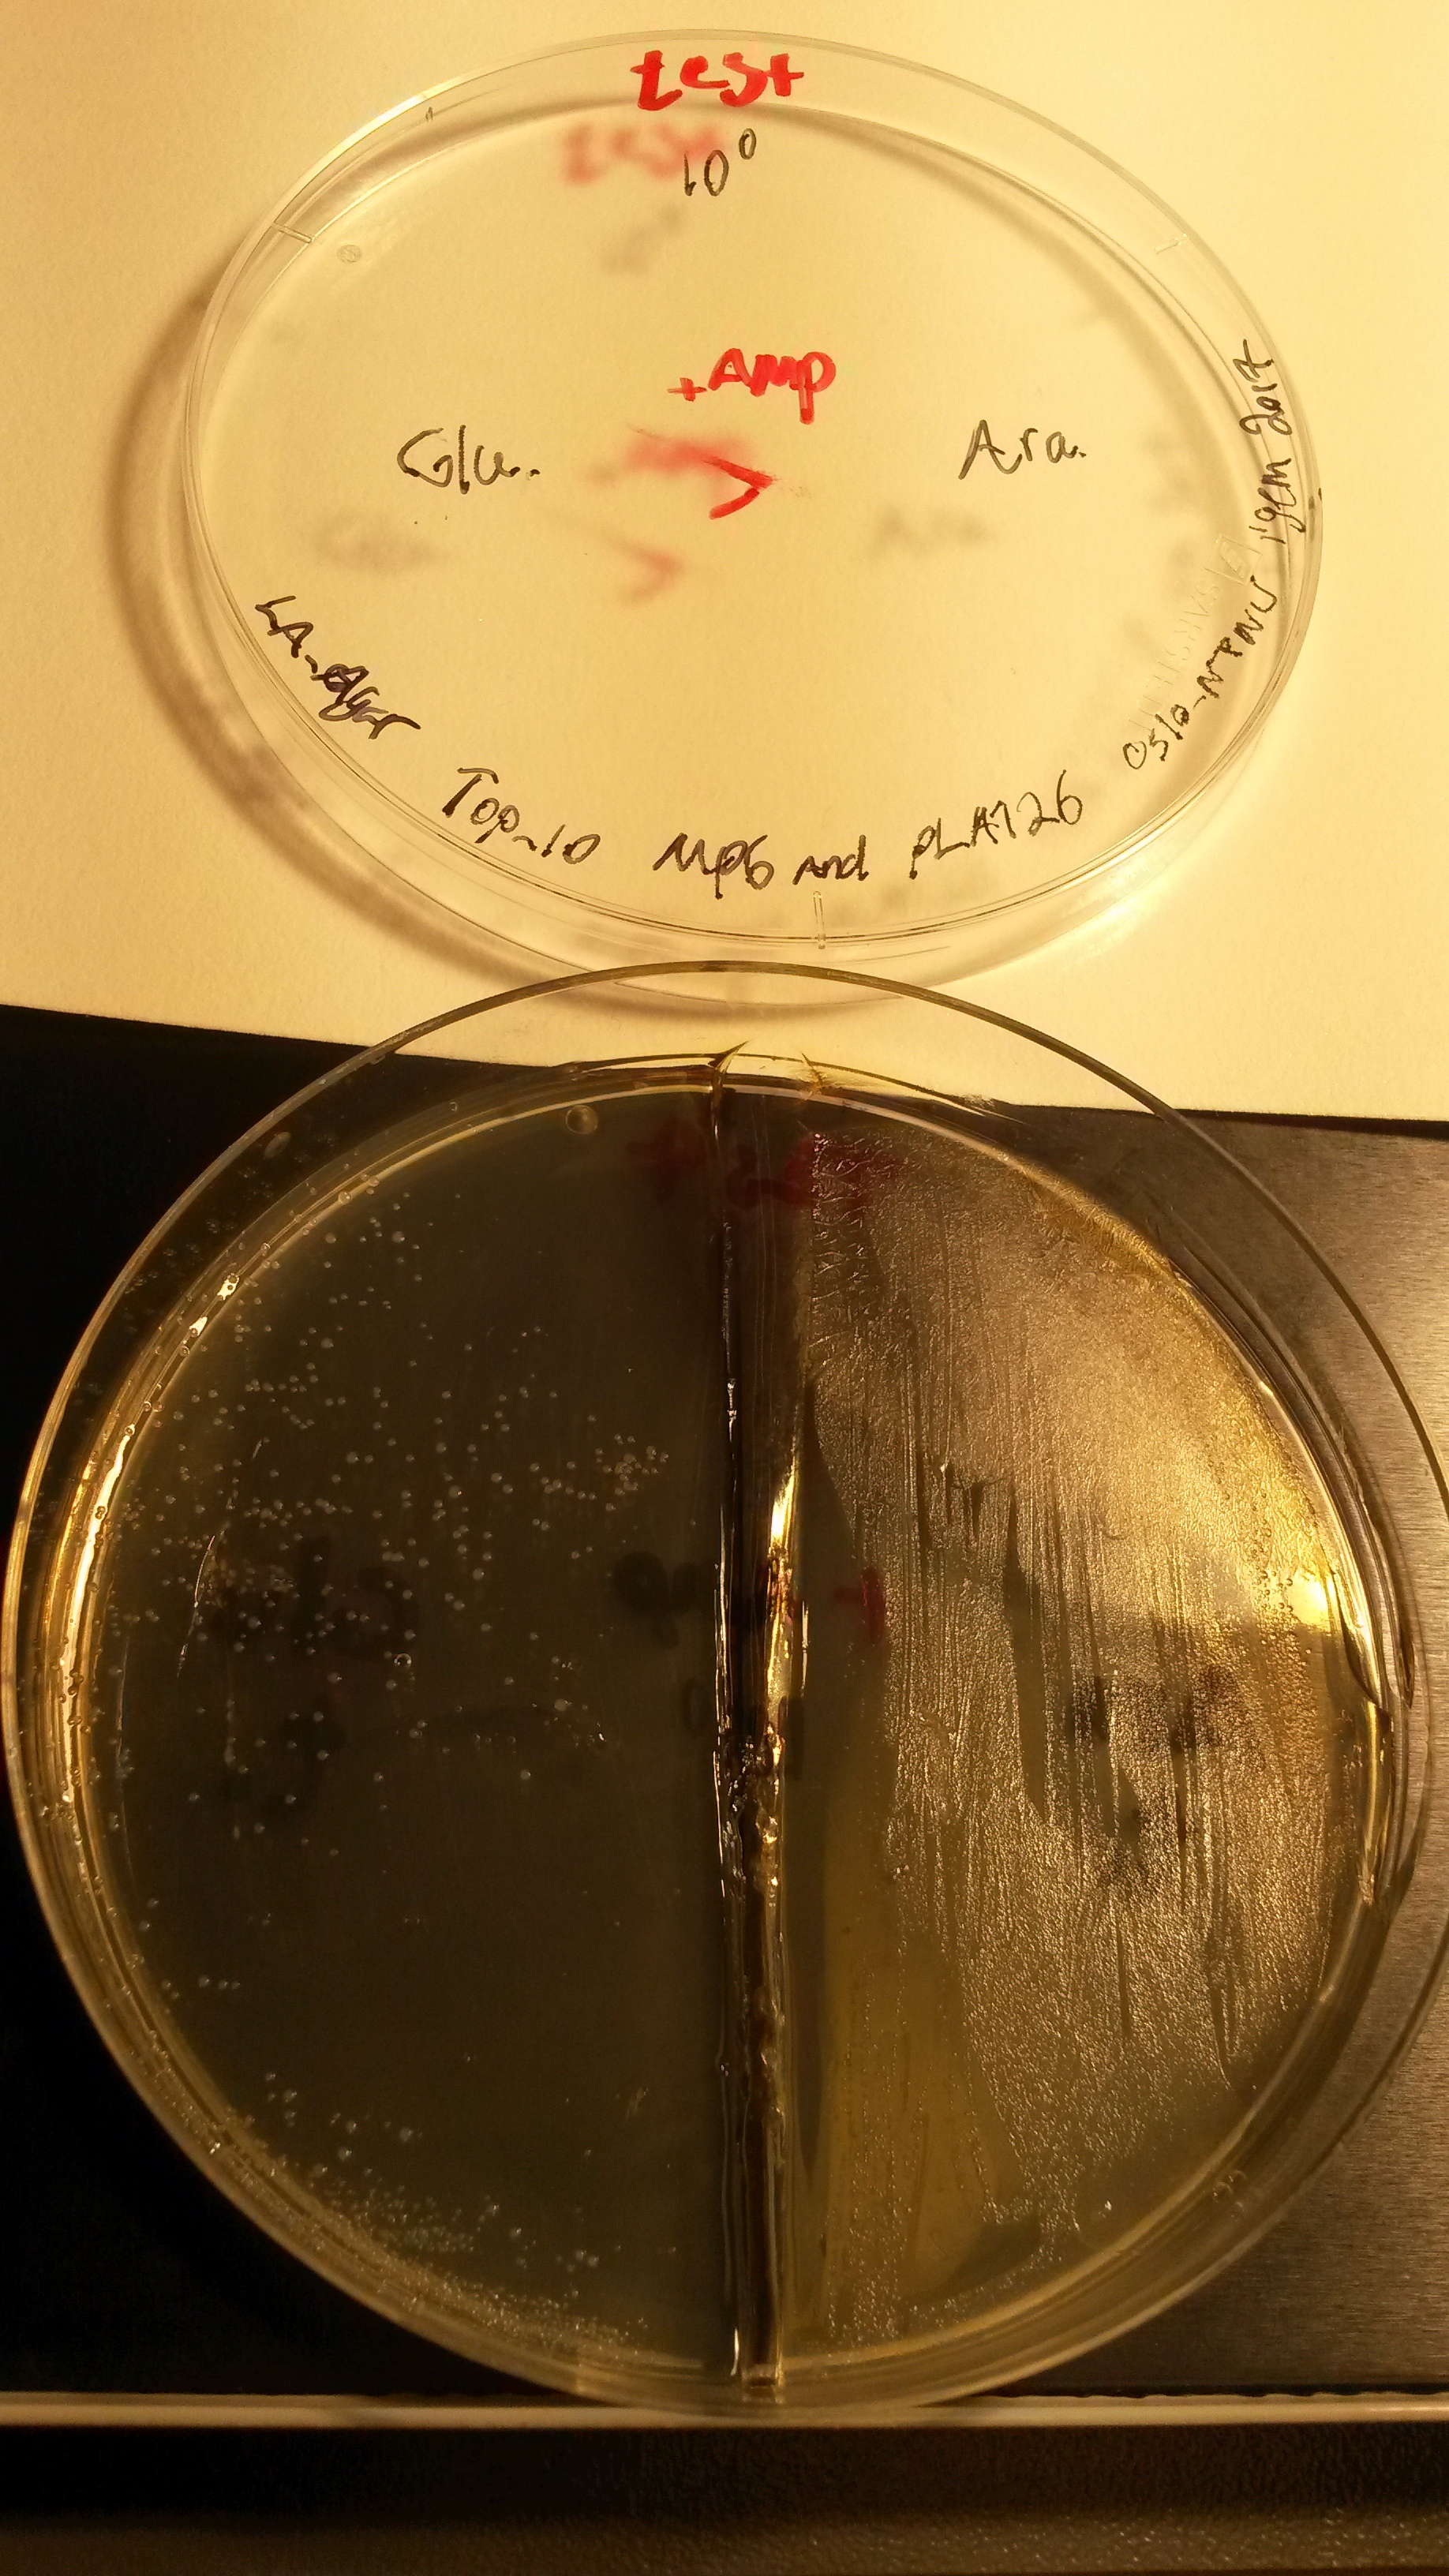
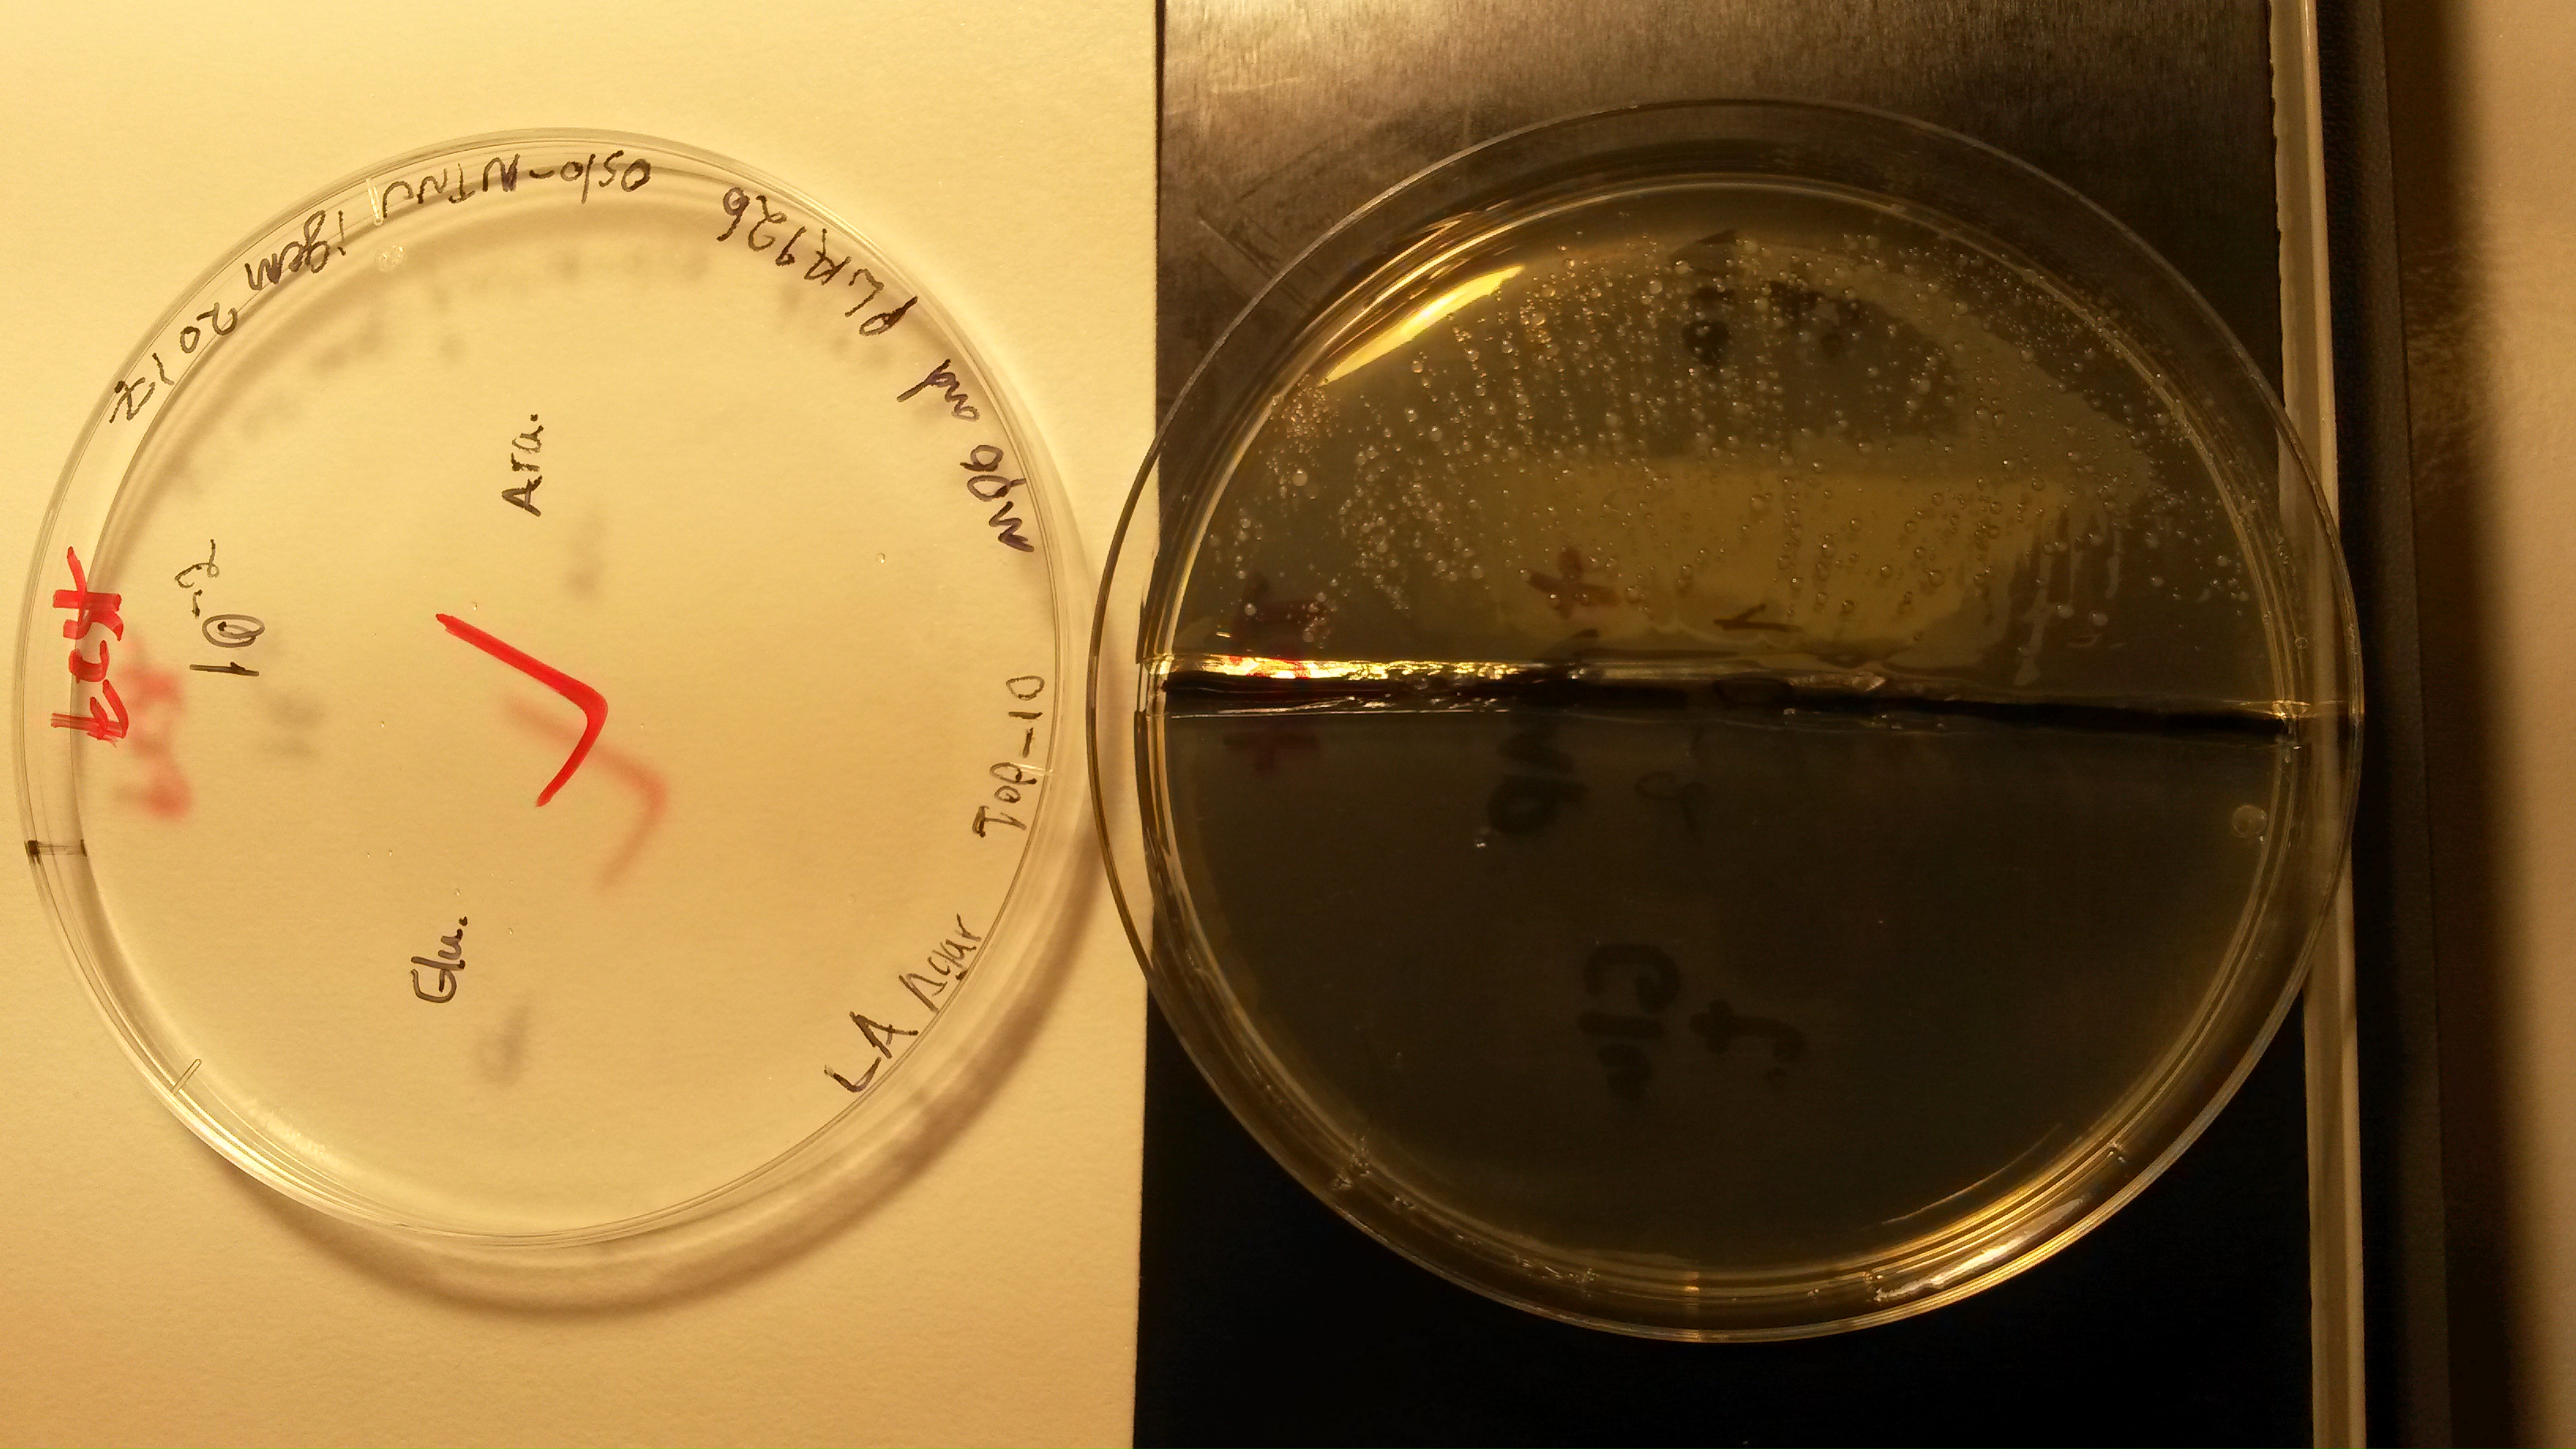
<a href="https://static.igem.org/mediawiki/2017/b/b0/T--UiOslo_norway--results_NTNU_collab.jpg">Fig. 2.0.</a> Significant differences observed between number of colonies formed (pLA230/MP6 transformed Top10 Ecoli cells) in plates, pre-incubated with either 20 mM arabinose or glocose in day3. Test (+ Amp, down) and control (-Amp, up). Individual plate results shown below. The images are linked rather than put here as the colonies are small and we need a very high resolution to see the colonies properly: <br>
−
<a href="https://static.igem.org/mediawiki/2017/c/c8/T--UiOslo_norway--results_collab_0.jpg">Fig. 2.1.</a> 10^0 concentration (+Amp); colonies formed pre-incubated with either 20 mM arabinose or glocose in day3.<br>
−
<a href="https://static.igem.org/mediawiki/2017/8/83/T--UiOslo_norway--results_collab_-1.jpg">Fig. 2.2.</a> 10^-1 concentration (+Amp); colonies formed pre-incubated with either 20 mM arabinose or glocose in day3.<br>
−
<a href="https://static.igem.org/mediawiki/2017/6/6a/T--UiOslo_norway--results_collab_-2.jpg">Fig. 2.3.</a> 10^-2 concentration (+Amp); colonies formed pre-incubated with either 20 mM arabinose or glocose in day3.<br>
−
<a href="https://static.igem.org/mediawiki/2017/8/8a/T--UiOslo_norway--results_collab_-3.jpg">Fig. 2.4.</a> 10^-3 concentration (+Amp); colonies formed pre-incubated with either 20 mM arabinose or glocose in day3.<br>
−
<a href="https://static.igem.org/mediawiki/2017/e/ef/T--UiOslo_norway--_results_collab_-5.jpg">Fig. 2.5.</a> 10^-5 concentration (-Amp); colonies formed pre-incubated with either 20 mM arabinose or glocose in day3.<br>
−
<a href="https://static.igem.org/mediawiki/2017/2/26/T--UiOslo_norway--results_collab_-6.jpg">Fig. 2.6.</a> 10^-6 concentration (-Amp); colonies formed pre-incubated with either 20 mM arabinose or glocose in day3.<br>
−
<a href="https://static.igem.org/mediawiki/2017/2/26/T--UiOslo_norway--results_collab_-7.jpg">Fig. 2.7.</a> 10^-7 concentration (-Amp); colonies formed pre-incubated with either 20 mM arabinose or glocose in day3.<br>
−
<a href="https://static.igem.org/mediawiki/2017/2/26/T--UiOslo_norway--results_collab_-8.jpg">Fig. 2.8.</a> 10^-8 concentration (-Amp); colonies formed pre-incubated with either 20 mM arabinose or glocose in day3.<br><br>
−
<b>Colony count for individual tests</b><br>
+
Further results for PCR indicate a insert of right size. Samples have also been sent to GATC for sequencing. <br> <br>
−
<u>Test_10^0:</u> Ara.~8000 Glu.=400<br>
+
Composite part : <br> <br>
−
<u>Test_10^-1:</u> Ara.=800 Glu.=120<br>
+
−
<u>Test_10^-2:</u> Ara.=600 Glu.=10<br>
+
−
<u>Test_10^-3:</u> Ara.=181 Glu.=4<br><br>
+
−
<u>Control_10^-5:</u> Ara.=125 Glu.=30<br>
+
We faced similar problems with the composite part as with NMT1; likely for the same reasons as above, as the composite part contains the NMT1 sequence and would face the same issues with the secondary structure. We ordered specific primers to create a composite part with 5A overhangs (see Lab Methods) and used these to do 3A assembly on the composite part. This eventually lead to a successful transformation, and this transformation was purified and sent for sequencing.
−
<u>Control_10^-6:</u> Ara.=30 Glu.=11<br>
+
−
<u>Control_10^-7:</u> Ara.=3 Glu.=4<br>
+
−
<u>Control_10^-8:</u> Ara.=0 Glu.=1
+
+
</div>
+
<div class="modelling-picture">
+
<h1>picture2</h1>
+
</div>
+
</div>
+
</div>
−
<h3>Interlab</h3>
−
Results from the InterLab Study can be found at the InterLab page of our wiki.
−
<figure>
+
<div class="tab-pane fade active in" id="tab-item3">
<figcaption>The gel after 1 hour of distaining (SDS-Page ran for 2x40min) </figcaption>
+
−
</figure>
+
+
Using this <a href="http://www.biomol.net/en/tools/proteinextinction.html">calculator</a>, we calculated the extinction coefficient and molecular weight: <br><br>
<figcaption> The light spectrum for the LED with no filters, a 4000 spaces pr inch. Showing that the light is not monochromatic. </figcaption>
−
</figure>
−
<figure>
+
The same calculations are done for batch nr. 2 (1 mL) and batch nr. 3 (877µL), which are actually samples from column nr. 2, just split into two. The results for these samples are: <br>
<figcaption>sfGFp sample that had fluorescence with our set up</figcaption>
+
−
</figure>
+
+
<b>Observations</b> <br>
+
Batch nr. 1 had bright green colour, and we got a lot of precipitation in this solution after dialysis. <br>
+
Batch nr. 2 and batch nr. 3 are made out of one sample from dialysis. It was not resuspended after centrifugation so the batch nr. 2 and 3 have different concentrations of sfGFP and amount of precipitation (batch nr. 3 had more precipitation and bigger absorbance). <br>
<a href="https://static.igem.org/mediawiki/2017/b/b0/T--UiOslo_norway--results_NTNU_collab.jpg">Fig. 2.0.</a> Significant differences observed between number of colonies formed (pLA230/MP6 transformed Top10 Ecoli cells) in plates, pre-incubated with either 20 mM arabinose or glocose in day3. Test (+ Amp, down) and control (-Amp, up). Individual plate results shown below. The images are linked rather than put here as the colonies are small and we need a very high resolution to see the colonies properly: <br>
+
<a href="https://static.igem.org/mediawiki/2017/c/c8/T--UiOslo_norway--results_collab_0.jpg">Fig. 2.1.</a> 10^0 concentration (+Amp); colonies formed pre-incubated with either 20 mM arabinose or glocose in day3.<br>
+
<a href="https://static.igem.org/mediawiki/2017/8/83/T--UiOslo_norway--results_collab_-1.jpg">Fig. 2.2.</a> 10^-1 concentration (+Amp); colonies formed pre-incubated with either 20 mM arabinose or glocose in day3.<br>
+
<a href="https://static.igem.org/mediawiki/2017/6/6a/T--UiOslo_norway--results_collab_-2.jpg">Fig. 2.3.</a> 10^-2 concentration (+Amp); colonies formed pre-incubated with either 20 mM arabinose or glocose in day3.<br>
+
<a href="https://static.igem.org/mediawiki/2017/8/8a/T--UiOslo_norway--results_collab_-3.jpg">Fig. 2.4.</a> 10^-3 concentration (+Amp); colonies formed pre-incubated with either 20 mM arabinose or glocose in day3.<br>
+
<a href="https://static.igem.org/mediawiki/2017/e/ef/T--UiOslo_norway--_results_collab_-5.jpg">Fig. 2.5.</a> 10^-5 concentration (-Amp); colonies formed pre-incubated with either 20 mM arabinose or glocose in day3.<br>
+
<a href="https://static.igem.org/mediawiki/2017/2/26/T--UiOslo_norway--results_collab_-6.jpg">Fig. 2.6.</a> 10^-6 concentration (-Amp); colonies formed pre-incubated with either 20 mM arabinose or glocose in day3.<br>
+
<a href="https://static.igem.org/mediawiki/2017/2/26/T--UiOslo_norway--results_collab_-7.jpg">Fig. 2.7.</a> 10^-7 concentration (-Amp); colonies formed pre-incubated with either 20 mM arabinose or glocose in day3.<br>
+
<a href="https://static.igem.org/mediawiki/2017/2/26/T--UiOslo_norway--results_collab_-8.jpg">Fig. 2.8.</a> 10^-8 concentration (-Amp); colonies formed pre-incubated with either 20 mM arabinose or glocose in day3.<br><br>
−
+
<b>Colony count for individual tests</b><br>
+
<u>Test_10^0:</u> Ara.~8000 Glu.=400<br>
+
<u>Test_10^-1:</u> Ara.=800 Glu.=120<br>
+
<u>Test_10^-2:</u> Ara.=600 Glu.=10<br>
+
<u>Test_10^-3:</u> Ara.=181 Glu.=4<br><br>
+
<u>Control_10^-5:</u> Ara.=125 Glu.=30<br>
+
<u>Control_10^-6:</u> Ara.=30 Glu.=11<br>
+
<u>Control_10^-7:</u> Ara.=3 Glu.=4<br>
+
<u>Control_10^-8:</u> Ara.=0 Glu.=1
−
</div>
+
</div>
+
<div class="modelling-picture">
+
<h1>picture1</h1>
−
</div>
+
+
+
</div>
+
</div>
+
</div>
+
+
+
+
+
<div class="tab-pane fade active in" id="tab-item5">
+
<br> <br>
+
<div class="bootstrap-overrides-with-pictures">
+
<div class="modelling-content">
+
+
Results from the InterLab Study can be found at the InterLab page of our wiki.
Our results vary from the characteristics of light from a LED to how a protein solution with fluorescent properties (GFP) act when light upon:
We managed to create a light source that emitted light in the correct wavelength for the GFP to get excited. This being a homemade LED-circuit with a blue diode.
We proved that there were no fluorescens from the GFP when light upon with green or red light, only when being light upon by the light source that had the correct wavelength (blue LED-circuit).
We managed to verify that you do not need monochromatic light to get fluorescens.
We were not able to measure the light emitted from the GFP with a CCD-camera.
We got to test multiple setups with the GFP solution, but none proved lasing, at least not with our equipment.
In the end we had some red light emitted from the GFP used, this we could see in the spectrometer.
Successful transformation of E.coli TOP10 with Gibson solution indicated by bacterial growth on LB plates containing chloramphenicol(25 mg/mL). However there were red colonies persent, meaning that they contained an empty vector.
Gel from PCR suggested that white colonies do not contain insert, but rather are bacteria that are not chloramphenicol resistant. This occurs when plates are incubated to long and antibiotica has deteriorated. Reason for longer incubation time than recommended is due to the antibiotics used. Chloramphenicol is tougher on bacteria cells than ampicillin and bacteria may need more time to grow.
Several attempts have given same result. It been theorized that the reason why nmt1 is harder to insert is caused by its DNA secondary structure; we were informed that this could potentially cause problems when the DNA was syntesized.
However, this stepback has caused us to modify gibson assembly protocol. Increase incubation to 1h and dilute the gibson solution to remove some molecules in the Gibson Mix causing trouble during transformation. We have diluted 1:3, but increased the volume used in transformation to 3 times of original volume. Leading to the same volume of plasmid, but ⅓ of the gibson mix. Results show an increased number of transformed colonies from the diluted solution.
Further results for PCR indicate a insert of right size. Samples have also been sent to GATC for sequencing.
Composite part :
We faced similar problems with the composite part as with NMT1; likely for the same reasons as above, as the composite part contains the NMT1 sequence and would face the same issues with the secondary structure. We ordered specific primers to create a composite part with 5A overhangs (see Lab Methods) and used these to do 3A assembly on the composite part. This eventually lead to a successful transformation, and this transformation was purified and sent for sequencing.
picture2
Using this calculator, we calculated the extinction coefficient and molecular weight:
The same calculations are done for batch nr. 2 (1 mL) and batch nr. 3 (877µL), which are actually samples from column nr. 2, just split into two. The results for these samples are:
batch nr. 2 (1 mL): 5.15 mg
batch nr. 3 (877µL): 10.9 mg
This gives total mass of:
total mass (sfGFP)=19.3 mg+5.15 mg+10.9 mg=35.35 mg
SDS-page Observations
Batch nr. 1 had bright green colour, and we got a lot of precipitation in this solution after dialysis.
Batch nr. 2 and batch nr. 3 are made out of one sample from dialysis. It was not resuspended after centrifugation so the batch nr. 2 and 3 have different concentrations of sfGFP and amount of precipitation (batch nr. 3 had more precipitation and bigger absorbance).
Second experiement
The isolated sfGFP stored in test tubes at 4ºC after repeating the procedure Observations
The product was green which indicates presence of sfGFP protein.
picture3
Fig. 2.0. Significant differences observed between number of colonies formed (pLA230/MP6 transformed Top10 Ecoli cells) in plates, pre-incubated with either 20 mM arabinose or glocose in day3. Test (+ Amp, down) and control (-Amp, up). Individual plate results shown below. The images are linked rather than put here as the colonies are small and we need a very high resolution to see the colonies properly: Fig. 2.1. 10^0 concentration (+Amp); colonies formed pre-incubated with either 20 mM arabinose or glocose in day3. Fig. 2.2. 10^-1 concentration (+Amp); colonies formed pre-incubated with either 20 mM arabinose or glocose in day3. Fig. 2.3. 10^-2 concentration (+Amp); colonies formed pre-incubated with either 20 mM arabinose or glocose in day3. Fig. 2.4. 10^-3 concentration (+Amp); colonies formed pre-incubated with either 20 mM arabinose or glocose in day3. Fig. 2.5. 10^-5 concentration (-Amp); colonies formed pre-incubated with either 20 mM arabinose or glocose in day3. Fig. 2.6. 10^-6 concentration (-Amp); colonies formed pre-incubated with either 20 mM arabinose or glocose in day3. Fig. 2.7. 10^-7 concentration (-Amp); colonies formed pre-incubated with either 20 mM arabinose or glocose in day3. Fig. 2.8. 10^-8 concentration (-Amp); colonies formed pre-incubated with either 20 mM arabinose or glocose in day3.
