Team:York/Software
Digital Inline Holographic Microscopy
We were allowed, by Dr. Laurence Wilson, of the Department of Physics at the University of York, to use his existing hologram construction software as the basis for our own. It can be found at York's Biophysical Imaging and Spectroscopy Lab website. Its functionality follows these steps:
- Input foreground and background images.
- Input details of microscopy setup.
- Bandpass filter: Yes/No, maximum pixels, minimum pixels.
- Number of steps to be in hologram.
- Wavelength of light used.
- Median refractive index of sample.
- Pixels per micron (how many pixels a one micron object would cover in an image taken with this setup).
- Step size (spatial interval between frames of the hologram).
- Offset distance (option to shift the initial focus of the hologram).
- Find data for POV-Ray: Yes/No.
- Refocus foreground image through the number of steps, applying the bandpass filter if selected.
- Stitch the steps into a hologram.
- Calculate the gradient of each frame.
- Stitch the gradient frames into a "gradient hologram".
- Output the hologram and gradient hologram as videos.
- If selected, find co-ordinates of the most visible features in the hologram.
- Output the co-ordinates in a format suitable for use in POV-Ray.
POV-Ray is free software that can be used to render visualisations of 3D space. This was not necessary for our purposes, so, in writing our own software, this option to find co-ordinates was omitted. We initially omitted the bandpass filter too, but later (after some feedback, see: Integrated Human Practices) wrote it in to improve the quality of the holograms we generated.
We also designed our software such that the individual frames of both the hologram and the gradient hologram can be exported as image files (PNG). This was useful for our analysis, as it meant that we could manually select focal frames more easily.
- Figure 1: Hologram created using Dr. Wilson's software.
- Figure 2: Hologram created using our software.
The above videos show that the end result of our hologram software is the same as the end result of Dr. Wilson's. There is some lightening/darkening of frames, due to the differences between Python and LabVIEW in terms of data handling, though the organisms (a chain of Streptococcus aureus [1] in this case) are still refocused correctly. All of our software is available on the Downloads page.
Blob Detection
In order to count the cells in a sample, we wrote a simple blob detection program. Its function is outlined in the below flowchart.
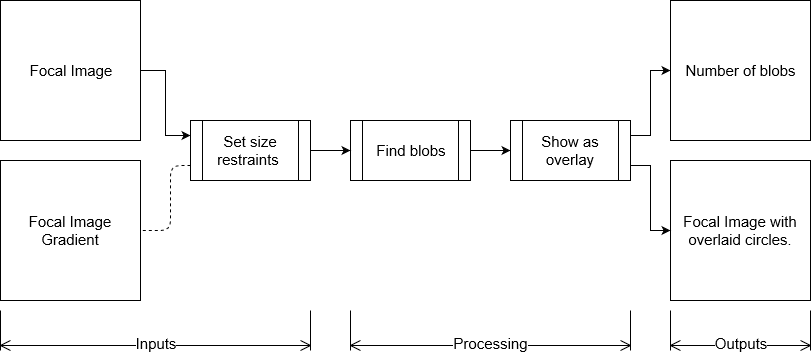
- Figure 3: The dotted line indicates that using the gradient image is optional.

As can be seen on the Results page, the blob detection software was very useful for calculating the number of cells in a given sample.
User Interface
We designed a control application in order to send commands to the Raspberry Pi (to take pictures of our samples) and to process the images all in one place. Unfortunately, we have come to the end of the project and did not manage to work out all the bugs. Regardless, we have made all the related files and scripts available on the Downloads page. We invite anyone to try to improve them. The main problem we experienced was that the software would only run on the desktop PC on which it was developed. When we transferred it to a computer we could take into the lab, it would not function.
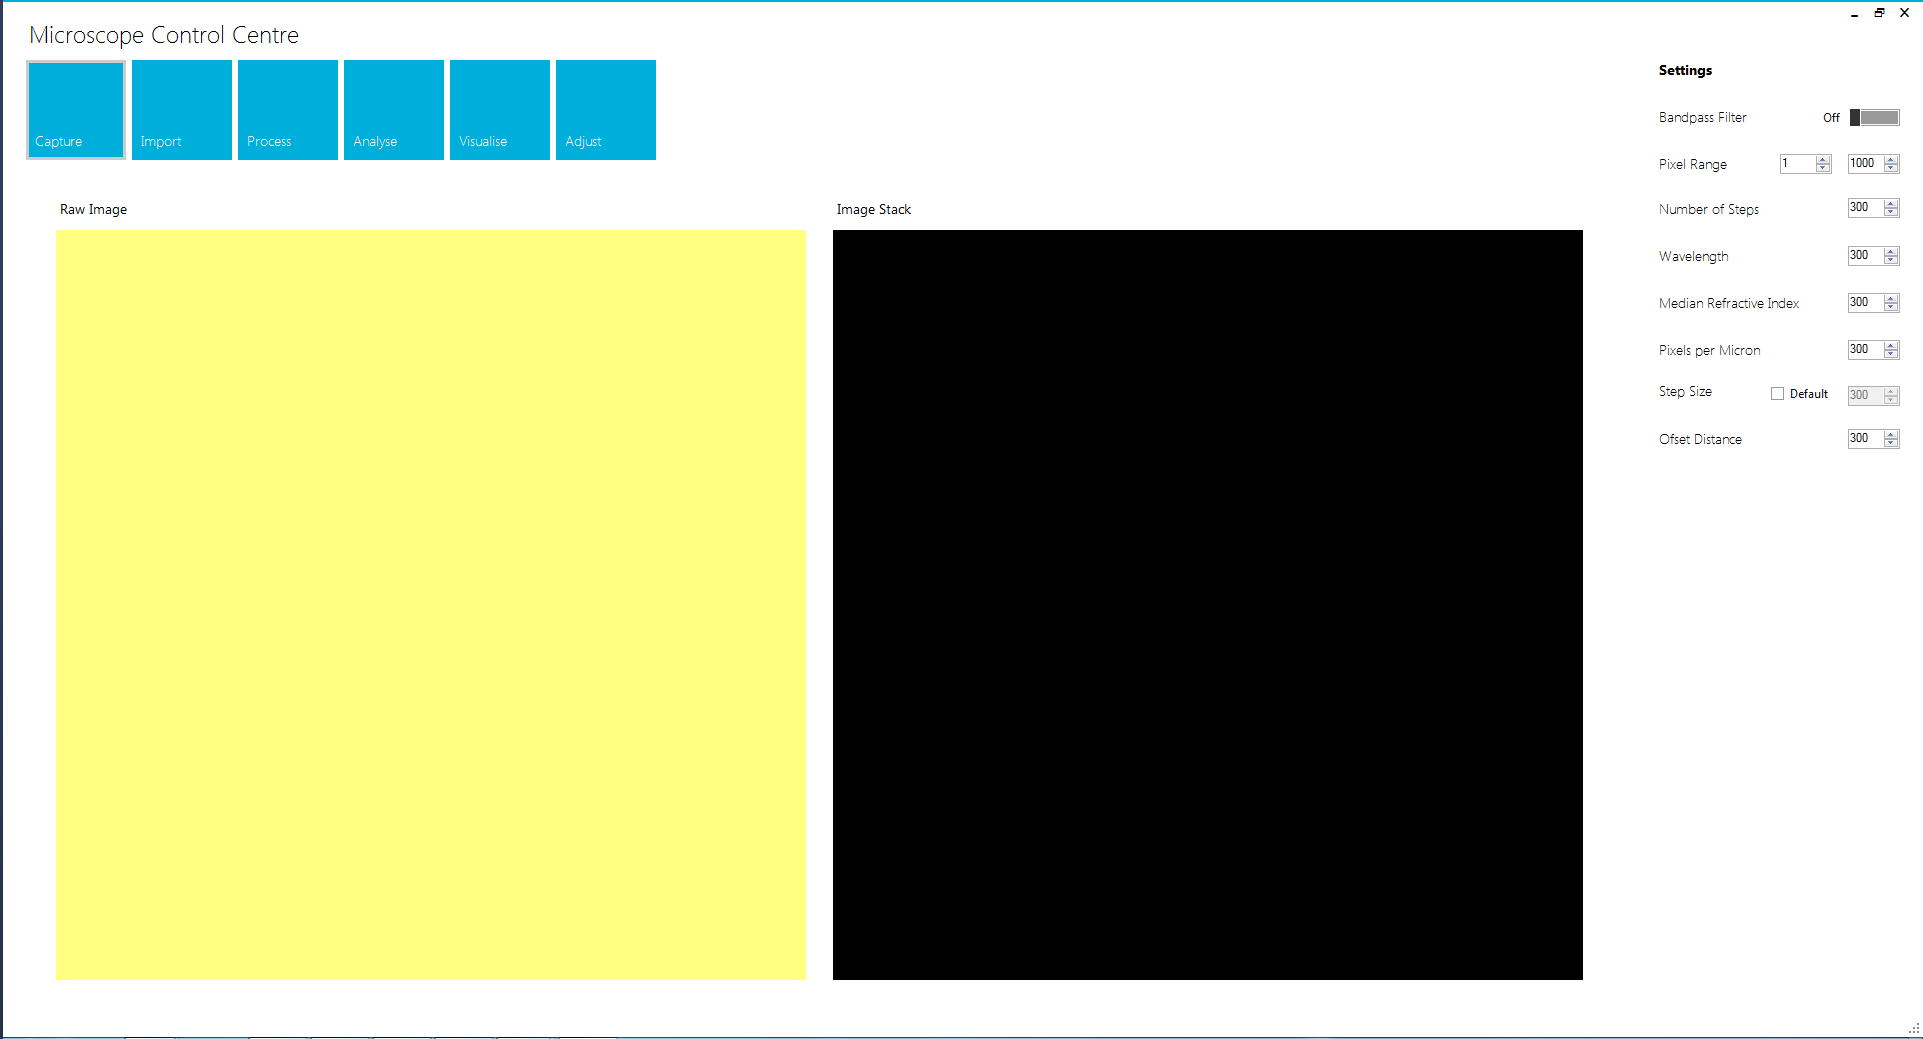
- Figure 4: The Microscope Control Application.

Once we encountered the aforementioned problem, we did not finish editing the application, so, as it stands, we have provided all the right pieces... not necessarily in the right places. In lieu of a functioning control application, we instead used a combination of an image capturing program and an image averaging program. Both are outlined below.
Before the Hologram
Our Control Application was a non-starter for accumulating data. Fortunately, it is possible to operate a Raspberry Pi with mouse, keyboard and monitor. We took advantage of this and used a kernel of code to take 50 images at a time. (It is somewhat self-explanatory that it is called "Take 50 Images" on the Downloads page.)
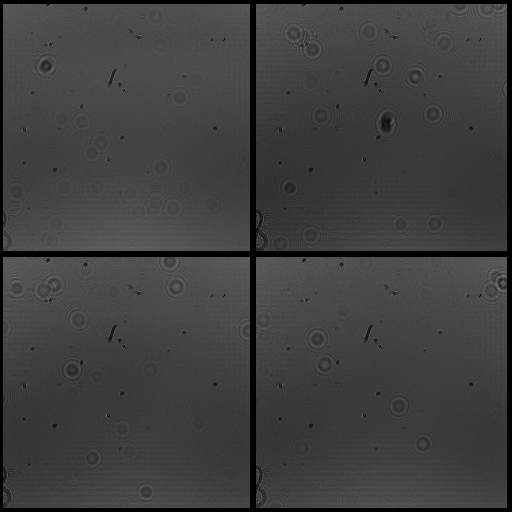
- Figure 5: Some of the pictures that were taken using the Raspberry Pi in one instance of the Take 50 Images code.

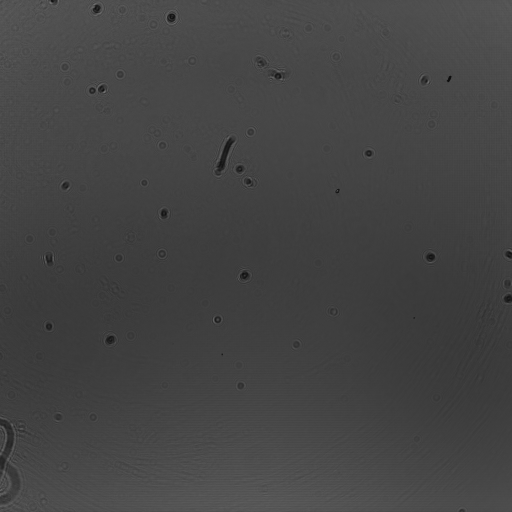
- Figure 6: An example of a background picture for a hologram, created by averaging the pixel values of the images in figure 5.

We also wrote another kernel, which we have called "Create Background Image" on the Downloads page. This takes a pixel by pixel average of a number of images. We used it to create the background images to use when making our holograms. Its effect is shown in figure 6, which is an average of 50 images, some of which are shown in figure 5. The black outline in figure 5 shows where the edge of each image is. The averaged image has no diffraction patterns on it, which means, if it is removed from the foreground image, only the diffraction patterns remain. This allows the holography code to work.
References
- [1]: L. Wilson, Biophysical Imaging and Spectrometry, as available on 31st October 2017 at sites.google.com/a/york.ac.uk/bis_lab/downloads