Difference between revisions of "Team:HFLS H2Z Hangzhou/Model"
Matt Gerrard (Talk | contribs) |
Matt Gerrard (Talk | contribs) |
||
| Line 101: | Line 101: | ||
We use the following symbols to represent the variables included in our model.<br><br> | We use the following symbols to represent the variables included in our model.<br><br> | ||
| − | <table> | + | <table class="frameless"> |
<thead></thead> | <thead></thead> | ||
| Line 201: | Line 201: | ||
<br> | <br> | ||
| − | <table> | + | <table class="frameless"> |
<thead></thead> | <thead></thead> | ||
| Line 275: | Line 275: | ||
} | } | ||
</style> | </style> | ||
| − | <table class="ref-table"> | + | <table class="frameless ref-table"> |
<tbody> | <tbody> | ||
<tr> | <tr> | ||
Revision as of 07:35, 29 October 2017
Template loop detected: Template:HFLS H2Z Hangzhou<!DOCTYPE html>
Modeling
Overview
In the modeling part, we basically made two models. One is for predicting time required for nitrite decomposition by our enzyme, which could be used when applying our product to the industrial production. The second model is the mechanism of our software.
Quick Menu
Time Prediction
Software
1 Abstract
As stated in the project breif, our ultimate goal is to reduce the time needed for $\ce{NO2-}$ to decompose. Therefore, the prediction of the time needed to reduce $\ce{NO2-}$ to a healthy level is a crucial part to apply our project to industrial production. We built three models for each of our enzymes based on enzyme kinetics to reach our final target.2 Model
2.1 Variables
We use the following symbols to represent the variables included in our model.| $C_s$ | Concentration of substrate($\ce{NO2–}$ in this case) |
| $C_p$ | Concentration of productCeConcentration of enzyme |
| $V_{max}$ | Maximum rate of reaction |
| $K_m$ | Michaelis-Menten constant |
| $K_c$ | A trivial constant in a solution for the differential equation |
| $K_{cat}$ | Turnover number |
| $c_n$ | Trivial constant |
2.2 Model for the Relation between ∆t and Cs
The rate of reaction of a enzymatic reaction can be modelled by the well-known Michaelis-Mentenequation, which is stated as $$ v = \frac{dC_p}{dt} = - \frac{dC_s}{dt} = \frac{V_{max} C_s}{K_m + C_s} $$ What we need to get to reach our goal is to find a function of $ C_s = f(t) $, so that we can predict the time spent, $ \Delta t $, by substituting the initial concentration $ C_{0} $ and the target concentration $ C_{t} $ to get the time difference.Therefore, by separating the variables in two sides of the equation and integrating both sides, we can get one solution set to this differential equation. $$ - \frac{dC_s}{dt} = \frac{V_{max} C_s}{K_m + C_s} $$ $$ - \frac{K_m + C_s}{V_{max} C_s} dC_s = dt $$ $$ - \int \frac{K_m + C_s}{V_{max} C_s} dC_s = \int dt $$ $$ - \int \frac{K_m}{V_{max}} \frac{1}{C_s} + \frac{1}{V_{max}} dC_s = t + c_1 $$ $$ - \frac{K_m}{V_{max}} ln(C_s) - \frac{1}{V_{max}} C_s + c_2 = t + c_1 $$ $$ - \frac{K_m}{V_{max}} ln(C_s) - \frac{1}{V_{max}} C_s + (c_2 - c_1) = t $$ Let $ K_{c} = c_2 - c_1 $, we get our final solution $$ t = - \frac{K_m}{V_{max}} ln(C_s) - \frac{1}{V_{max}} C_s + K_{c} $$ Where $ K_m $ and $ V_{max} $ can be found through our experiments stated below.
So to use the model, we simply need to substitute $ C_s = C_0 $, $ t = 0 $ to the solution, and get $$ K_c = \frac{K_m}{V_{max}} ln(C_0) + \frac{1}{V_{max}} C_0 $$ And substitute $ K_c $ back, we get $$ \Delta t = t - 0 = \frac{K_m}{V_{max}} (ln(C_0) - ln(C_s)) + \frac{1}{V_{max}} (C_0 - C_s) $$ $$ \Delta t = \frac{K_m}{V_{max}} (ln(C_0 / C_s)) + \frac{1}{V_{max}} (C_0 - C_s) $$ And $ C_s $ is our target concentration of substrate($\ce{NO2-}$) Because $ V_{max} $ and enzyme concentration $ C_e $ are related by the turnover number $ K_{cat} $ $$ V_{max} = K_{cat} C_e $$ We can rewrite the equation as $$ \Delta t = \frac{K_m}{K_{cat} C_e} (ln(C_0 / C_s)) + \frac{1}{K_{cat} C_e} (C_0 - C_s) $$ $$ \Delta t = \frac{K_m (ln(C_0 / C_s)) + (C_0 - C_s)}{K_{cat} C_e} $$
2.3 Determine the Parameters
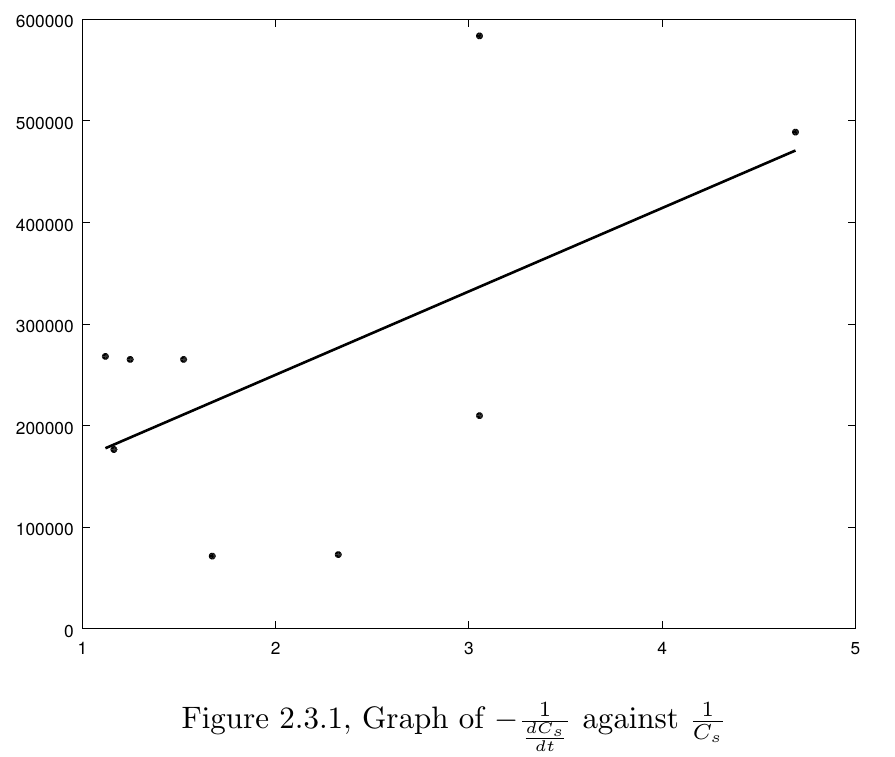
The last step completing this model is to determine $ K_m $ and $ V_{max} $ in this model. We used the Lineweaver-Burk plot to find the two constants.By taking the reciprocals of two sides the Michaelis-Menten equation, we can get a linear relation between $ \frac{1}{v} $ and $ \frac{1}{C_s} $, which then can be used to determine the parameters $ K_m $ and $ V_{max} $. $$ - \frac{1}{\frac{dC_s}{dt}} = \frac{K_m + C_s}{V_{max} C_s} $$ $$ - \frac{1}{\frac{dC_s}{dt}} = \frac{K_m}{V_{max}} \frac{1}{C_s} + \frac{1}{V_{max}} $$ So by linear regression of our experiment data($ - \frac{1}{\frac{dC_s}{dt}} $ against $ \frac{1}{C_s} $), we computed the parameters(Figure 2.3.1).
 The regression results are
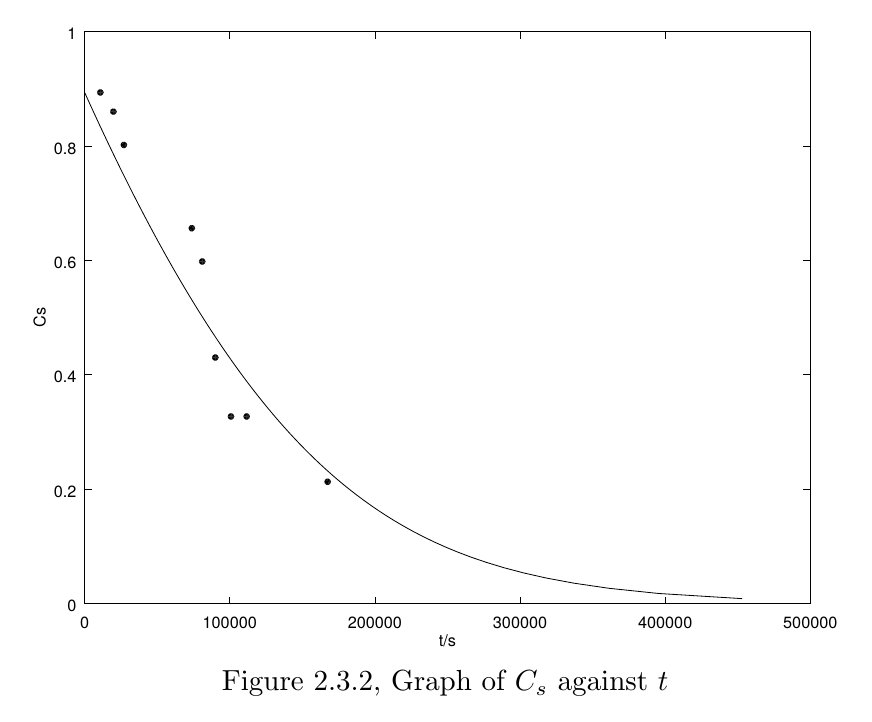
| $K_m$ | 0.95489 $ mmol\ dm^{-3} $ |
| $V_{max}$ | 1.1637e-05 $ mmol\ dm^{-3}\ s^{-1} $ |
Substituting back the parameters, we get the $ C_s $-$ t $ graph(the dots are our data from the experiments)
2.4 Model simulation in MATLAB
%%%%%%%%%%%%% data %%%%%%%%%%%%%

A = [ 0.408 0.393 0.367 0.302 0.276 0.201 0.155 0.155 0.104 ];
t = [ 3 5.5 7.5 20.5 22.5 25 28 31 46.5 ]; % in hours

% parameters of the standard curve(absorbance against concentration of NaNO2 in mg/L)
std_k = 0.647659;
std_b = 0.00872129;

%%%%%%%%%%%%% model %%%%%%%%%%%%%

% convert hr to sec
t = t .* (60 * 60);

% times 100 because solution is diluted
C = (A .- std_b) ./ std_k ./ (23 + 14 + 32) .* 100;
C0 = C(1);

v = -gradient(C) ./ gradient(t);
ln = @(x) log(x) ./ log(e);

poly = polyfit(1 ./ C, 1 ./ v, 1);

km = poly(1) / poly(2) % in mmol/L
vmax = 1 / poly(2) % in mmol/L/s

% model equation
m1 = @(cs) (km .* (ln(C0 ./ cs)) .+ (C0 .- cs)) ./ vmax;

plot(t, C, '.k'); hold;
plot(m1(linspace(0, C0, 100)), linspace(0, C0, 100), 'k');

ylabel('Cs');
xlabel('t/s');
2.5 Further Improvement
Although we can get the basic relation between concentration of $\ce{NO2-}$ and time, there are still some factors we haven't considered. Firstly, the relation between enzyme concentration and cell concentration is still not clear. So in a real situation, where the bacteria are put into the pickle mixutre, the increase in the concentration of our enzyme is not included in our model. We hope that our future improvement of the model will allow us to more effectively predict the time required in a real production situation.3 Reference
| [1] | J K Kristjansson and T C Hollocher, "First practical assay for soluble nitrous oxide reductase of denitrifying bacteria and a partial kinetic characterization". J. Biol. Chem. 1980, 255:704-707. |
| [2] | Lineweaver, H; Burk, D. (1934). "The determination of enzyme dissociation constants". Journal of the American Chemical Society. 56 (3): 658–666. doi:10.1021/ja01318a036. |
| [3] | Michaelis, L.; Menten, M.L. (1913). "Die Kinetik der Invertinwirkung". Biochem Z. 49: 333–369 (recent translation, and an older partial translation) |