| (176 intermediate revisions by 5 users not shown) | |||
| Line 1: | Line 1: | ||
| + | {{Austin_UTexas}} | ||
| + | |||
<html> | <html> | ||
| − | |||
<head> | <head> | ||
| − | |||
<style> | <style> | ||
| − | + | body { | |
| − | + | background-color: #282828 | |
| − | + | ||
| − | + | ||
| − | + | ||
| − | + | ||
| − | + | ||
| − | + | ||
| − | + | ||
} | } | ||
| − | |||
| + | </style> | ||
</head> | </head> | ||
| + | <div class="column full_size"> | ||
| + | <div style="background-color: lightcyan;padding:14px; font-family: verdana"> | ||
| − | < | + | <br> |
| − | + | <div class="clear"></div> | |
| − | <div class=" | + | |
| − | + | ||
| − | + | ||
| − | + | ||
| − | </div | + | |
| − | + | ||
| − | + | ||
| − | + | ||
| − | + | ||
| − | + | ||
| − | + | ||
| − | + | ||
| − | + | ||
| − | + | ||
| − | + | ||
| − | + | ||
| + | <style> | ||
| + | div.naviSection { | ||
| + | } | ||
| + | button.accordion { | ||
| + | background-color: #eee; | ||
| + | color: #444; | ||
| + | cursor: pointer; | ||
| + | padding: 18px; | ||
| + | width: 100%; | ||
| + | border: none; | ||
| + | text-align: justify; | ||
| + | outline: none; | ||
| + | font-size: 15px; | ||
| + | transition: 0.4s; | ||
| + | } | ||
| − | + | button.accordion.active, button.accordion:hover { | |
| − | + | background-color: #ccc; | |
| − | + | } | |
| − | + | ||
| − | + | ||
| − | + | ||
| − | + | ||
| − | + | ||
| − | + | div.panel { | |
| − | + | padding: 0 18px; | |
| + | display: none; | ||
| + | background-color: gray; | ||
| + | } | ||
| + | body { | ||
| + | background-color: #282828 | ||
| − | + | } | |
| − | + | </style> | |
| − | + | ||
| − | </ | + | |
| + | <div class = "column_full_size_inner"> | ||
| + | <h2 style="font-family: verdana; font-size: 45px; text-align: center; color: rgb(0, 184, 230)">Results</h2> | ||
| + | <div class="clear"></div> | ||
| − | |||
| − | |||
| − | |||
| − | |||
| − | |||
| − | |||
| − | |||
| − | |||
| − | </ | + | <div class="clear"></div> |
| + | <div class="column full_size"> | ||
| + | <p style="font-family: verdana">Although bacteria can naturally synthesize GABA, we wanted to <b>increase expression of the <i>gadB</i> gene and subsequently GABA production in order to give our intended probiotic, <i>Lactobacillus plantarum</i>, a more potent medicinal quality</b>, with the idea that this GABA-overproducing probiotic can then be consumed by patients with bowel disorders, hypertension or anxiety (1). Overexpression of the <i>gadB</i> gene will be accomplished by placing it under the control of either the P8 or P32 constitutive promoters from <i>Lactococcus lactis</i> (2). | ||
| − | < | + | <p style="font-family: verdana">To make our GABA-producing probiotic, we ultimately needed to assemble a GABA overexpression cassette plasmid. The intention is that bacteria containing this GABA overexpression cassette plasmid should produce high levels of GABA. In order to assemble this plasmid, we decided to utilize the Golden Gate Assembly method. In short, Golden Gate Assembly is a relatively new cloning method that allows for the creation of a multi-part DNA assembly (i.e. cassette plasmid) in a single reaction through the use of DNA parts containing specific, predefined suffixes and prefixes with recognition sites for Type IIs restriction enzymes (e.g. BsmBI and BsaI). The specificity of these suffixes and prefixes provides directionality of the desired DNA parts during the assembly process. For our purposes, we used the MoClo Yeast Tool Kit developed by John Dueber (3).</p> |
| − | < | + | |
| − | + | <p style="font-family: verdana">We decided to first assemble and test our Golden Gate plasmids in <i>E. coli</i>, which was chosen due to the ease in which we could genetically manipulate it. We then wanted to use these Golden Gate plasmids to genetically manipulate <i>L. plantarum</i>. This part of the project required us to assemble a Golden Gate compatible shuttle vector (that is replicable in both <i>E. coli</i> and <i>L. plantarum </i>) and transform <i>L. plantarum</i>. Our experimental results are detailed below. </p></div> | |
| − | + | ||
| − | + | <div class="clear"</div> | |
| − | + | ||
| − | < | + | <div id="navtop"></div> |
| − | + | <br> | |
| + | |||
| + | <strong><h2 style="font-family: verdana; font-size: 17px; text-align: center; color: rgb(0, 184, 230)">Click on one of the images below to learn more about our results!</h2></strong> | ||
| + | |||
| + | <div class="column sixth_size"> | ||
| + | <a href="#section1"><img src="https://static.igem.org/mediawiki/2017/5/5f/Gga-gfp.png" style="width:100%"><p>Part plasmid assembly </p></a> | ||
</div> | </div> | ||
| − | |||
| − | |||
| − | + | <div class="column sixth_size"> | |
| − | + | <a href="#section2"><img src="https://static.igem.org/mediawiki/2017/3/32/Gliw.png" style="width:100%"><p>Testing constitutive <i>Lactococcal</i> Promoters in <i>E. coli</i></p></a> | |
| − | + | </div> | |
| − | < | + | <div class="column fifth_size"> |
| − | + | <a href="#section3"><img src="https://static.igem.org/mediawiki/2017/archive/e/e7/20171101072448%21GABAFinal.png" style="width:100%"> <p> Testing <i>gadB</i> Overexpression in <i>E. | |
| − | < | + | coli</i></p></a> |
| − | + | </div> | |
| − | + | ||
| − | + | ||
| − | + | ||
| − | + | ||
| − | + | ||
| − | + | ||
| − | + | ||
| − | + | ||
| − | + | ||
| − | + | ||
| − | + | ||
| − | + | ||
| − | + | ||
| − | + | ||
| − | + | ||
| − | + | ||
| − | + | ||
| − | + | ||
| − | + | ||
| − | + | ||
| − | + | ||
| − | + | ||
| − | + | ||
| − | + | ||
| − | + | ||
| − | + | ||
| − | + | ||
| − | + | ||
| − | + | ||
| − | + | ||
| − | + | ||
| − | + | ||
| − | + | ||
| − | + | ||
| − | + | ||
| − | + | ||
| − | + | ||
| − | + | ||
| − | + | ||
| − | + | ||
| − | + | ||
| − | + | ||
| − | + | ||
| − | + | ||
| − | + | ||
| − | + | ||
| − | + | ||
| − | + | ||
| − | + | ||
| − | + | ||
| − | + | ||
| − | + | ||
| − | + | ||
| − | + | ||
| − | + | ||
| − | + | ||
| − | + | ||
| − | + | ||
| − | + | ||
| − | + | ||
| − | + | ||
| − | + | ||
| − | + | ||
| − | + | ||
| − | + | ||
| − | + | ||
| − | + | ||
| − | + | ||
| − | + | ||
| − | + | ||
| − | + | ||
| − | + | ||
| − | + | ||
| − | + | ||
| − | + | ||
| − | + | ||
| − | + | ||
| − | |||
| − | |||
| − | < | + | <div class="column sixth_size"> |
| − | + | <a href="#section4"><img src="https://static.igem.org/mediawiki/2017/4/42/Erm.png" style="width:100%"><p>Creating a Golden Gate compatible shuttle vector</p></a> | |
| − | < | + | </div> |
| − | + | ||
| − | + | ||
| − | + | ||
| − | + | ||
| − | + | ||
| − | + | ||
| − | + | ||
| − | + | ||
| − | + | ||
| − | + | ||
| − | + | ||
| − | + | ||
| − | + | ||
| − | + | ||
| − | + | ||
| − | + | ||
| − | + | ||
| − | + | ||
| − | + | ||
| − | + | ||
| − | + | ||
| − | + | ||
| − | + | ||
| − | + | ||
| − | + | ||
| − | + | ||
| − | + | ||
| − | + | ||
| − | + | ||
| − | + | ||
| + | <div class="column sixth_size"> | ||
| + | <a href="#section5"><img src="https://static.igem.org/mediawiki/2017/e/e5/Lacto-final.png" style="width:100%"><p><i>Lactobacillus plantarum</i> transformation</p></a> | ||
| + | </div> | ||
| − | |||
| − | |||
| + | <br> | ||
| − | |||
| − | |||
| − | |||
| − | |||
| − | |||
| − | |||
| − | |||
| − | |||
| − | |||
| − | |||
| − | |||
| − | |||
| − | |||
| − | |||
| − | |||
| − | |||
| − | |||
| − | |||
| − | |||
| − | |||
| − | |||
| − | |||
| − | |||
| − | |||
| − | |||
| − | |||
| − | |||
| − | |||
| − | |||
| − | |||
| − | |||
| − | |||
| − | |||
| − | < | + | <div class="clear"></div> |
| − | </ | + | |
| − | |||
| − | |||
| − | |||
| − | |||
| − | |||
| − | |||
| − | |||
| − | |||
| − | |||
| − | |||
| − | |||
| − | |||
| − | |||
| − | |||
| − | |||
| − | |||
| − | |||
| − | |||
| − | |||
| − | |||
| − | |||
| − | |||
| − | |||
| − | |||
| − | |||
| − | |||
| − | |||
| − | |||
| − | |||
| − | |||
| − | |||
| − | |||
| − | |||
| − | |||
| − | |||
| − | |||
| − | |||
| − | |||
| − | |||
| − | |||
| − | |||
| − | |||
| − | |||
| − | + | <br> | |
| − | + | ||
| + | <div class="naviSection" id="section1"> | ||
| + | |||
| + | <br> | ||
| + | <br> | ||
| + | <br> | ||
| + | <br> | ||
| + | <br> | ||
| + | |||
| + | <h2 style="font-family: verdana; font-size: 30px; text-align: center">Part plasmid assembly</h2> | ||
| + | |||
| + | <br> | ||
| + | |||
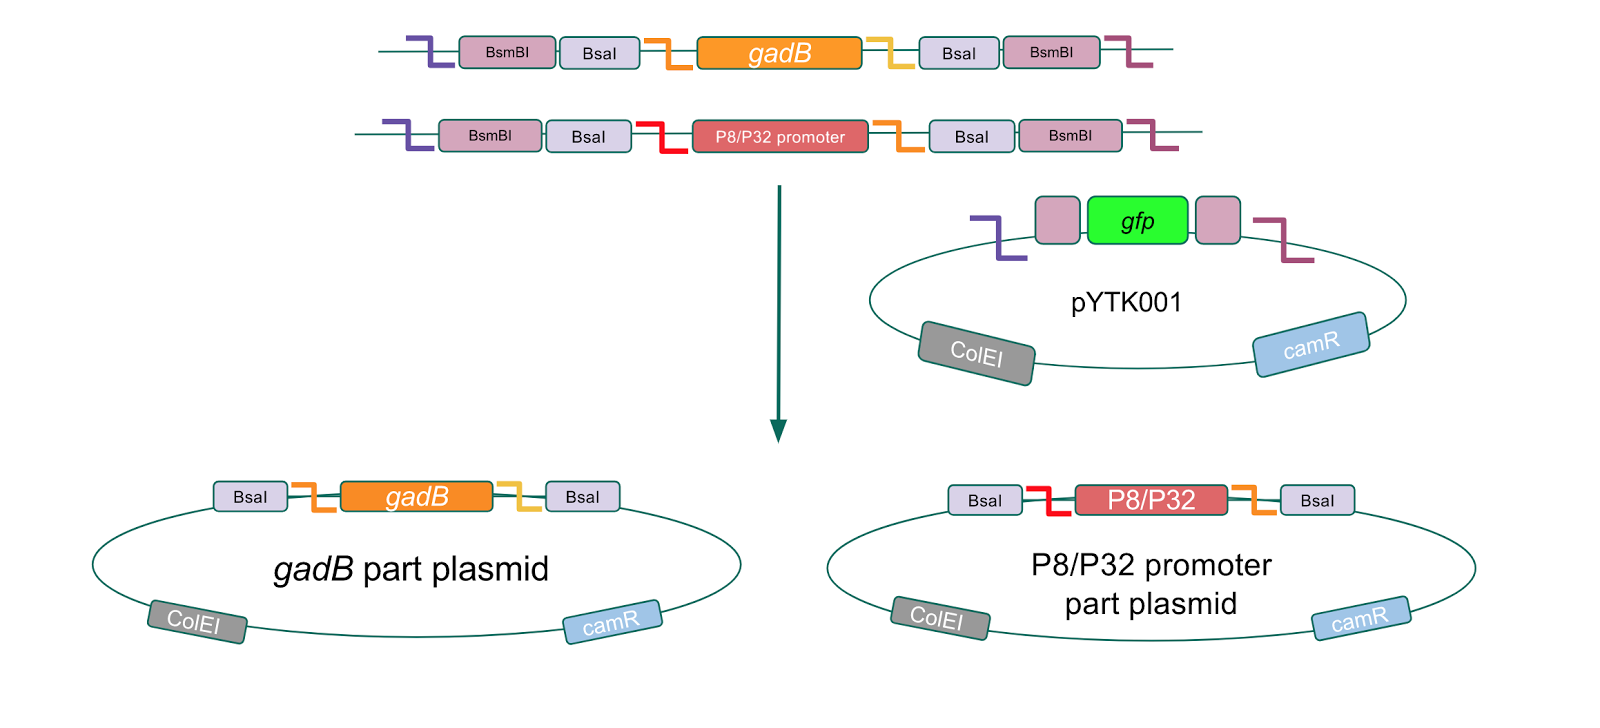
| + | <p style="font-family: verdana">The first part of our Golden Gate assembly workflow was part assembly, in which the <i>gadB</i> gene and the P8/P32 promoters were individually cloned into the entry vector pYTK001 <b>(Fig. 1)</b>. The <i>gadB</i> gene and P8/P32 promoter sequences contain flanking BsmBI sites that produce overhangs compatible with those cut by BsmBI in the entry vector pYTK001. Thus, BsmBI cloning should result in part plasmids containing the <i>gadB</i> gene and P8/P32 promoters set within the pYTK001 backbone. </p> | ||
| + | |||
| + | <br> | ||
| + | |||
| + | </html> | ||
| + | [[File:T--Austin_UTexas--gadBAndPromoterPartPlasmids.jpg|thumb|center|800px|<b>Figure 1.</b> <i>gadB</i> gene and P8/P32 promoter part assembly process. Golden Gate compatible <i>gadB</i> and P8/P32 promoter sequences are cloned into the pYTK001 entry vector via BsmBI assembly.]] | ||
| + | <html> | ||
| + | |||
| + | <br> | ||
| + | |||
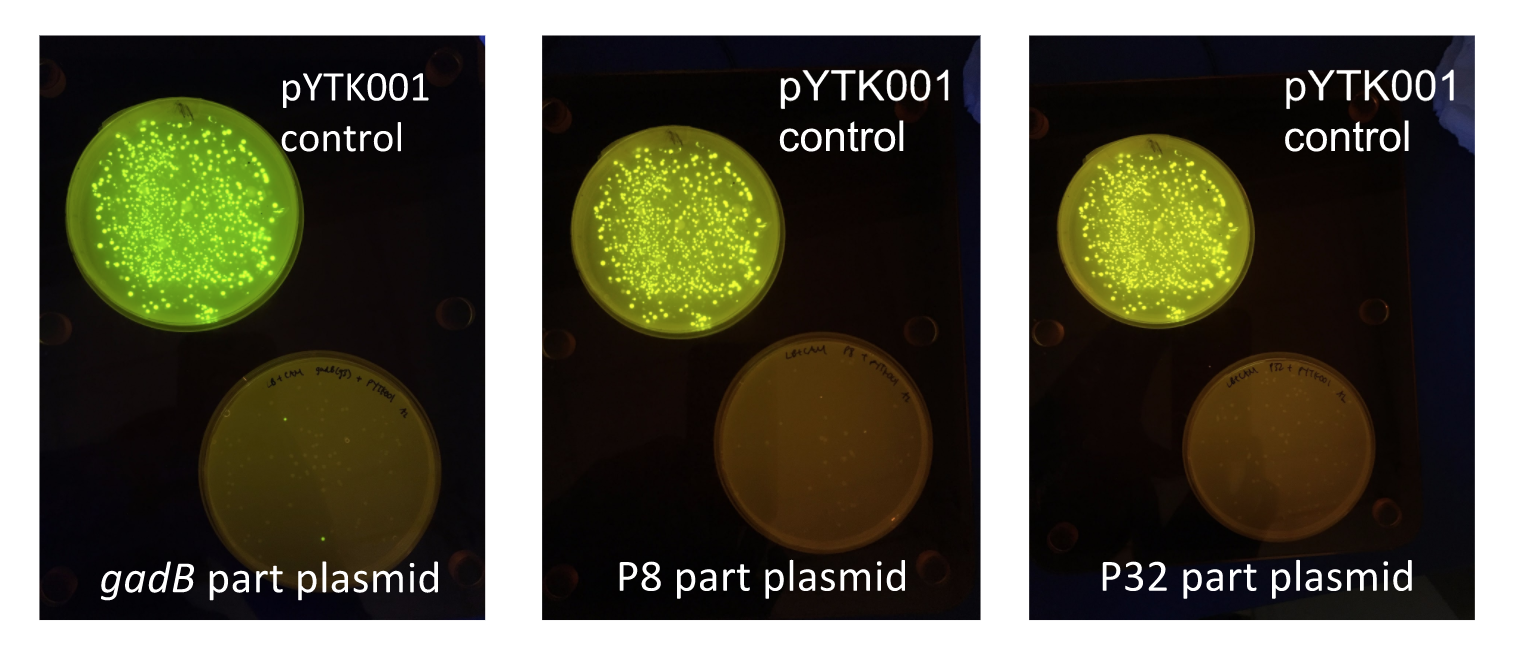
| + | <p style="font-family: verdana">Additionally, the BsmBI sites and overhangs in pYTK001 are flanking a <i>gfp</i> reporter gene. During the part assembly process, our DNA sequences of interest replaced this <i>gfp</i> reporter gene. This provided a phenotypic screen that allowed us to visually see which transformant colonies were negative and potentially positive. <b>Under UV illumination, positive colonies containing our intended part plasmid assembly did not exhibit fluorescence under the UV illumination, while negative colonies did (Fig. 2)</b>. The non-fluorescent colonies on the part plasmid transformation plates were miniprepped and subsequently sequence verified. Other part plasmids used in subsequent cassette assemblies were directly obtained from UT's Golden Gate Part Repository.</p> | ||
| + | |||
| + | <br> | ||
| + | |||
| + | </html> | ||
| + | [[File:T--Austin_UTexas--PartPlasmidTransformations.jpg|thumb|center|700px|<b>Figure 2.</b> <i>gadB gene</i> and P8/P32 promoter part plasmid <i>E. coli</i> transformations, compared to control transformations with pYTK001. Under UV illumination, transformants containing the correctly assembled part plasmids were non-fluorescent while negative transformants appeared fluorescent like colonies on the control plates.]] | ||
| + | <html> | ||
| + | |||
| + | <br> | ||
| + | |||
| + | <a href="#navtop"><p>Back to Top</p></a> | ||
</div> | </div> | ||
| − | <div class=" | + | <div class="naviSection" id="section2"> |
| − | < | + | <br> |
| + | <br> | ||
| + | <br> | ||
| + | <h2 style="font-family: verdana; font-size: 30px; text-align: center">Testing constitutive <i>Lactococcal</i> promoters in <i>E. coli</i> </h2> | ||
| + | <p style="font-family: verdana"><b>After successfully creating the <i>gadB</i> gene and P8/P32 promoter part plasmids, the functionality of these part plasmids were then assessed by assembling them into cassette plasmids.</b></p> | ||
| + | |||
| + | <br> | ||
| + | |||
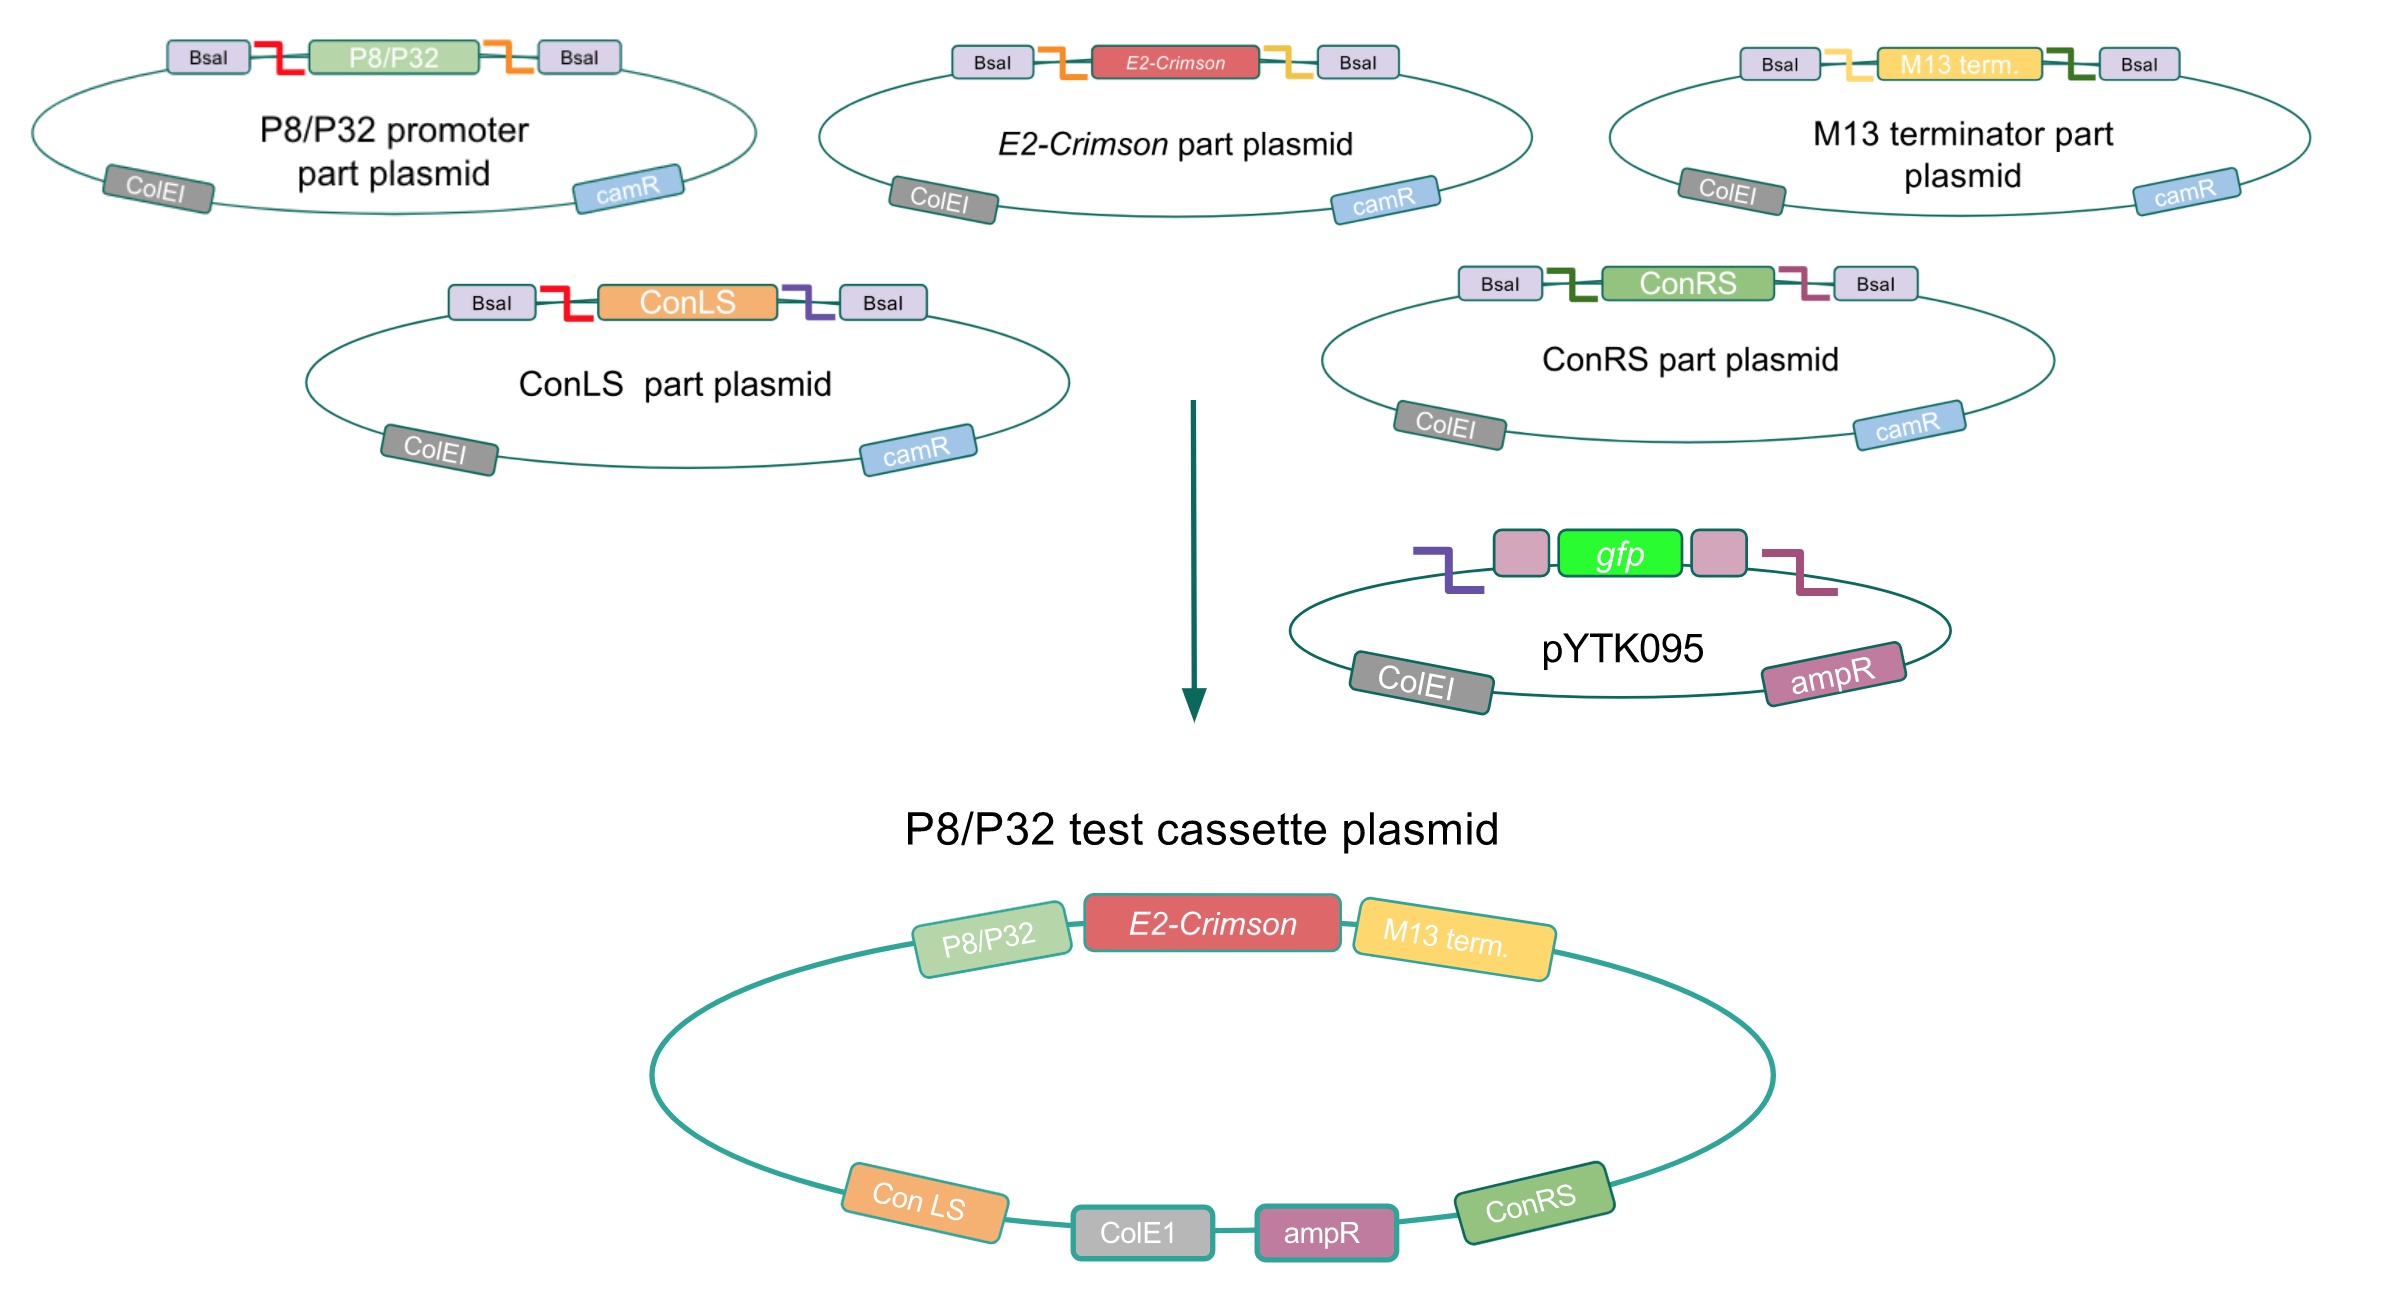
| + | <p style="font-family: verdana">Although the functionality of the <i>Lactococcal lactis</i> P8 and P32 constitutive promoters has been well characterized in Gram-positive bacteria such as <i>Lactobacillus</i>, we wanted to test if these promoters could function well within <i>E. coli</i>. To do this, we created test cassette plasmids containing the <i>E2-Crimson</i> reporter gene (which encodes a red fluorescent protein) inserted downstream of either the P8 or P32 promoters using BsaI Golden Gate assembly. To create these test cassettes, we used the P8/P32 promoter part plasmids, the <i>E2-Crimson</i> part plasmid, an M13 terminator part plasmid, connector part plasmids, and the pYTK095 vector as the backbone <b>(Fig. 3).</b> <b>If the P8 and P32 promoters are functional in <i>E. coli</i>, we expected to observe red fluorescence in colonies transformed with our test cassette plasmids.</b></p> | ||
| + | |||
| + | <br> | ||
| + | |||
| + | </html> | ||
| + | [[File:T--Austin_UTexas--p8p32test.jpg|thumb|center|800px|<b>Figure 3.</b> Golden Gate assembly process of the P8 and P32 test cassette plasmids.]] | ||
| + | <html> | ||
| + | |||
| + | <br> | ||
| + | |||
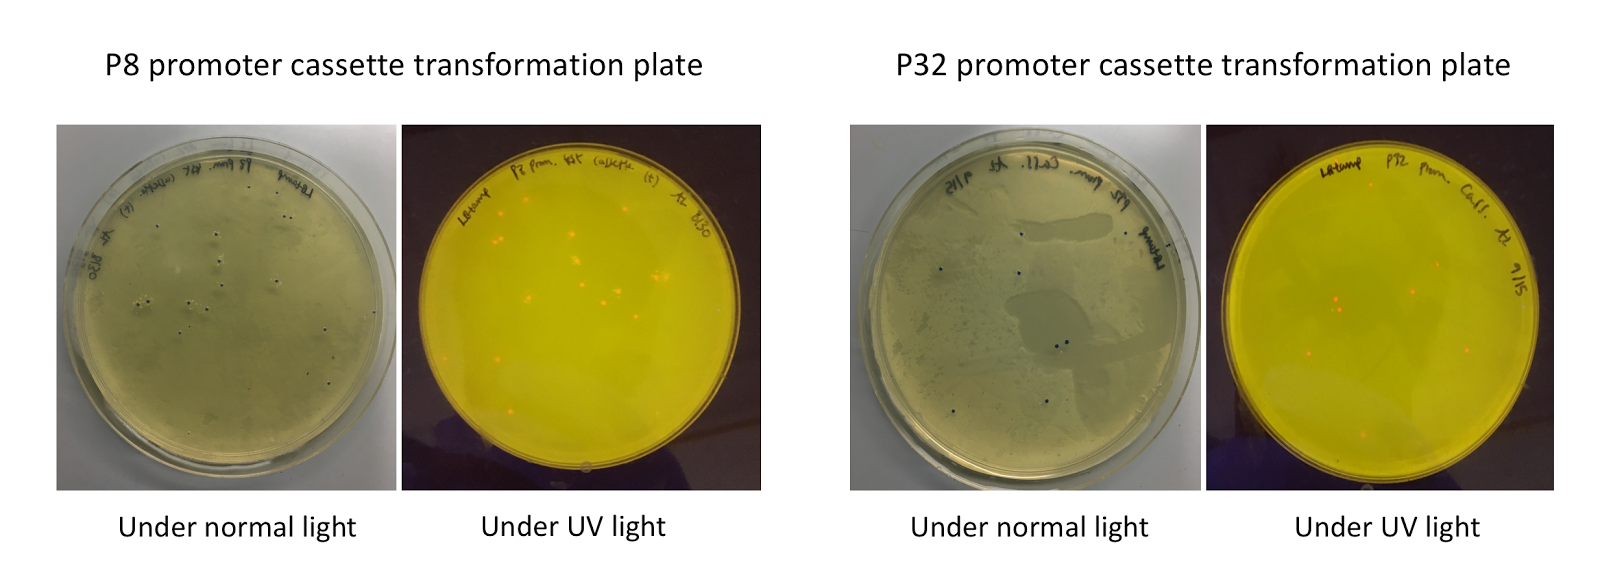
| + | <p style="font-family: verdana">Upon first look, <i>E. coli</i> colonies transformed with these assemblies appeared purple-blue in color. This phenotype was due to the expression of the red fluorescent protein. Further, we noticed that <i>E. coli</i> colonies transformed with these assemblies fluoresced red under UV light, indicating that <b>the P8 and P32 promoters are indeed expressing the <i>E2-Crimson</i> reporter gene and thus are functional in <i>E. coli</i> <b>(Fig. 4).</b> </b></p> | ||
| + | |||
| + | <br> | ||
| + | <br> | ||
| + | |||
| + | </html> | ||
| + | [[File:T--Austin_UTexas--P8P32trans.jpg|thumb|center|800px|<b>Figure 4.</b> P8/P32 test cassette plasmid transformation plates, under normal (faced up) and UV lights (faced down). Under normal lights, the colonies appeared purple-blue in color. Under UV illumination, the colonies fluoresced red.]] | ||
| + | <html> | ||
| + | |||
| + | <br> | ||
| − | + | <a href="#navtop"><p>Back to Top</p></a> | |
| − | + | ||
| − | + | ||
| − | + | ||
| − | + | ||
| − | < | + | |
| − | + | ||
</div> | </div> | ||
| − | |||
| − | |||
| − | + | <div class="naviSection" id="section3"> | |
| − | + | ||
| − | + | ||
| − | < | + | <br> |
| + | <br> | ||
| + | <br> | ||
| − | < | + | <h2 style="font-family: verdana; font-size: 30px; text-align: center">Testing <i>gadB</i> overexpression in <i>E. coli</i></h2> |
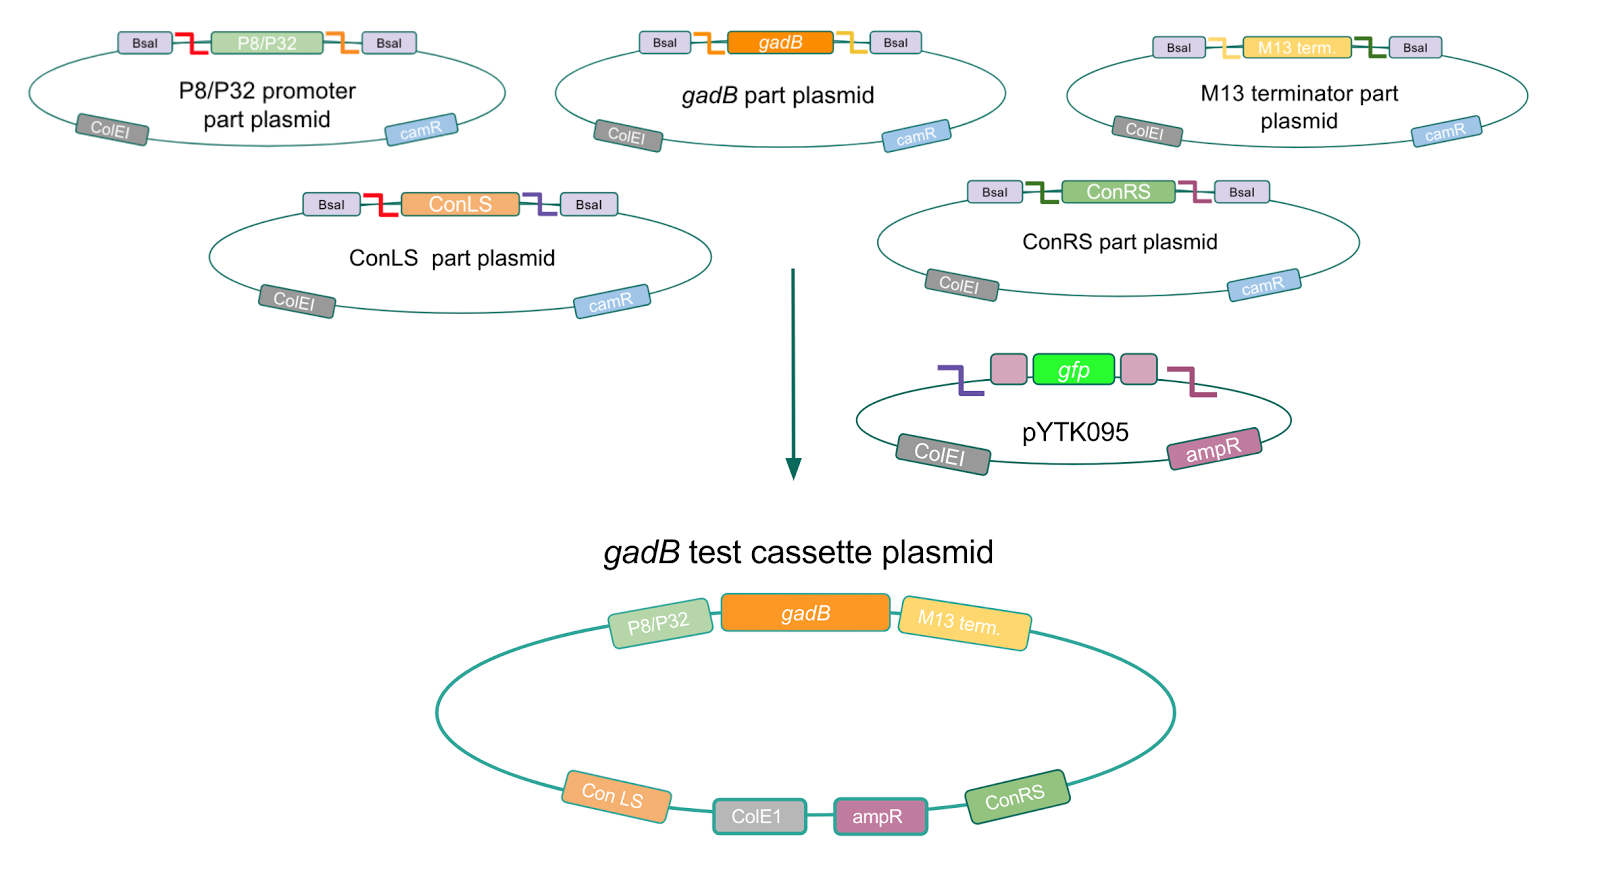
| − | < | + | <p style="font-family: verdana"><b>Using Golden Gate Assembly, we created cassette plasmids to test if the <i>gadB</i> gene could be overexpressed in <i>E. coli</i> via the P8 and P32 promoters. </b> These cassette plasmids contained the <i>gadB</i> gene inserted downstream of either the P8 or P32 promoters. To make our <i>gadB</i> test cassette plasmids, we used pYTK095 as our backbone and part plasmids containing the P8/P32 promoters, <i>gadB</i> gene, M13 terminator, and connector sequences <b>(Fig. 5).</b></p> |
| − | + | ||
| − | + | ||
| − | + | ||
| − | + | ||
| − | + | ||
| − | + | ||
| − | + | ||
| − | + | ||
| − | + | ||
| − | + | ||
| − | + | ||
| − | + | ||
| − | + | ||
| − | + | ||
| − | + | ||
| − | + | ||
| − | + | ||
| − | + | ||
| − | + | ||
| − | + | ||
| − | + | ||
| − | + | ||
| − | + | ||
| − | + | ||
| − | + | ||
| − | + | ||
| − | + | ||
| − | + | ||
| − | + | ||
| − | + | ||
| − | + | ||
| − | + | ||
| − | + | ||
| − | + | ||
| − | + | ||
| − | + | ||
| − | + | ||
| − | + | ||
| − | + | ||
| − | + | ||
| − | + | ||
| − | + | ||
| − | + | ||
| − | + | ||
| − | + | ||
| − | + | ||
| − | + | ||
| − | + | ||
| − | + | ||
| − | + | ||
| − | + | ||
| − | + | ||
| − | + | ||
| − | + | ||
| − | + | ||
| − | + | ||
| − | + | ||
| − | + | ||
| − | + | ||
| − | + | ||
| − | + | ||
| − | + | ||
| − | + | ||
| − | + | ||
| − | + | ||
| − | + | ||
| − | + | ||
| − | + | ||
| − | + | ||
| − | + | ||
| − | + | ||
| − | + | ||
| − | + | ||
| − | + | ||
| − | < | + | <br> |
| − | + | ||
| + | </html> | ||
| + | [[File:T--Austin_UTexas--gadBTestCassette.jpg|thumb|center|800px|<b>Figure 5.</b> Golden Gate assembly process of P8/<i>gadB</i> and P32/<i>gadB</i> test cassette plasmids.]] | ||
| + | <html> | ||
| − | |||
| − | < | + | <br> |
| − | < | + | <br> |
| − | + | ||
| − | + | ||
| − | + | ||
| − | + | ||
| − | + | ||
| − | + | ||
| − | + | ||
| − | + | ||
| − | + | ||
| − | + | ||
| − | + | ||
| − | + | ||
| − | + | ||
| − | + | ||
| − | + | ||
| − | + | ||
| − | + | ||
| − | + | ||
| − | + | ||
| − | + | ||
| − | + | ||
| − | + | ||
| − | + | ||
| − | + | ||
| − | + | ||
| − | + | ||
| − | + | ||
| − | + | ||
| − | + | ||
| − | + | ||
| − | + | ||
| − | + | ||
| − | + | ||
| − | + | ||
| − | + | ||
| − | + | ||
| − | + | ||
| − | + | ||
| − | + | ||
| − | + | ||
| − | + | ||
| − | + | ||
| − | + | ||
| − | + | ||
| − | + | ||
| − | + | ||
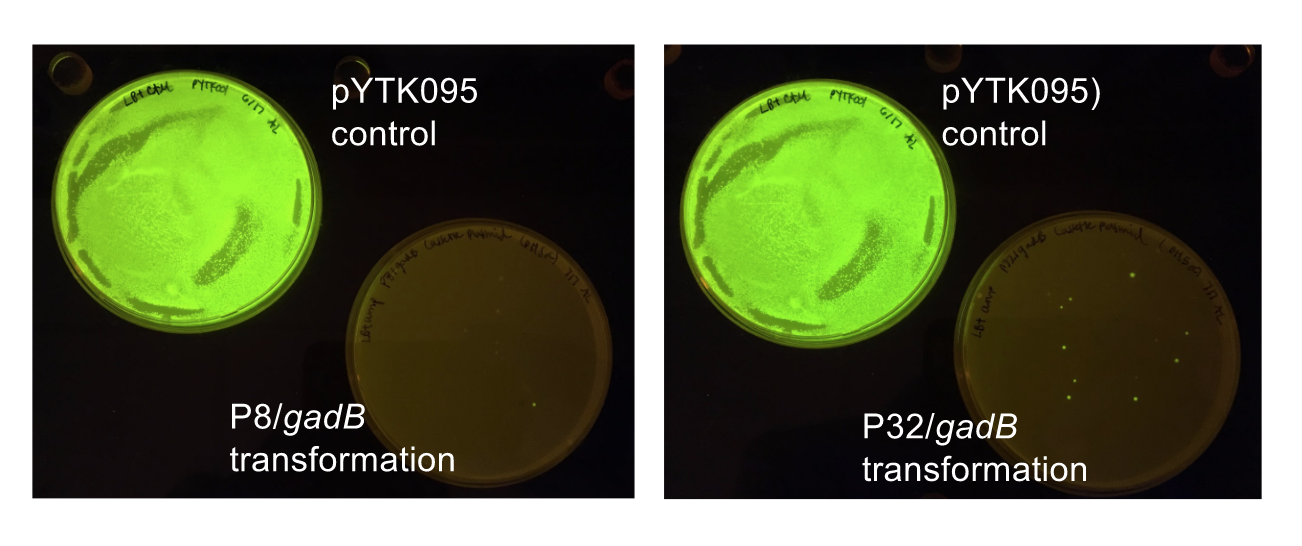
| − | < | + | <p style="font-family: verdana">Similar to the pYTK001 entry vector in part assembly, the pYTK095 backbone used for cassette assembly contained a <i>gfp</i> reporter gene that is replaced by sequences of interest. This allowed us to easily perform a phenotypic screen for positive colonies. <b>Non-fluorescent colonies may potentially have had the correct cassette assembly, while fluorescent colonies did not (Fig. 6).</b></p> |
| − | + | ||
| − | + | ||
| − | + | ||
| − | + | ||
| − | + | ||
| − | + | ||
| − | + | ||
| − | + | ||
| − | + | ||
| − | + | ||
| − | + | ||
| − | + | ||
| − | + | ||
| − | + | ||
| − | + | ||
| − | |||
| − | |||
| − | |||
| − | |||
| − | |||
| − | |||
| − | |||
| − | |||
| − | |||
| − | |||
| − | |||
| − | |||
| − | |||
| − | |||
| − | |||
| − | |||
| − | + | </html> | |
| − | + | [[File:Greenwhitescreen.png|thumb|center|800px|<b>Figure 6.</b> P8/<i>gadB</i> and P32/<i>gadB</i> cassette E. coli transformations alongside a pYTK095 control transformation under UV illumination. Potentially positive colonies containing the correct assemblies appeared non-fluorescent, while negative colonies appeared fluorescent. | |
| − | + | ]] | |
| − | + | <html> | |
| − | + | ||
| − | < | + | |
| − | < | + | |
| − | + | ||
| − | + | ||
| − | + | ||
| − | + | ||
| − | + | ||
| − | + | ||
| − | + | ||
| − | |||
| − | |||
| − | |||
| − | |||
| − | |||
| − | |||
| − | |||
| − | |||
| − | |||
| − | |||
| − | |||
| − | |||
| − | |||
| − | |||
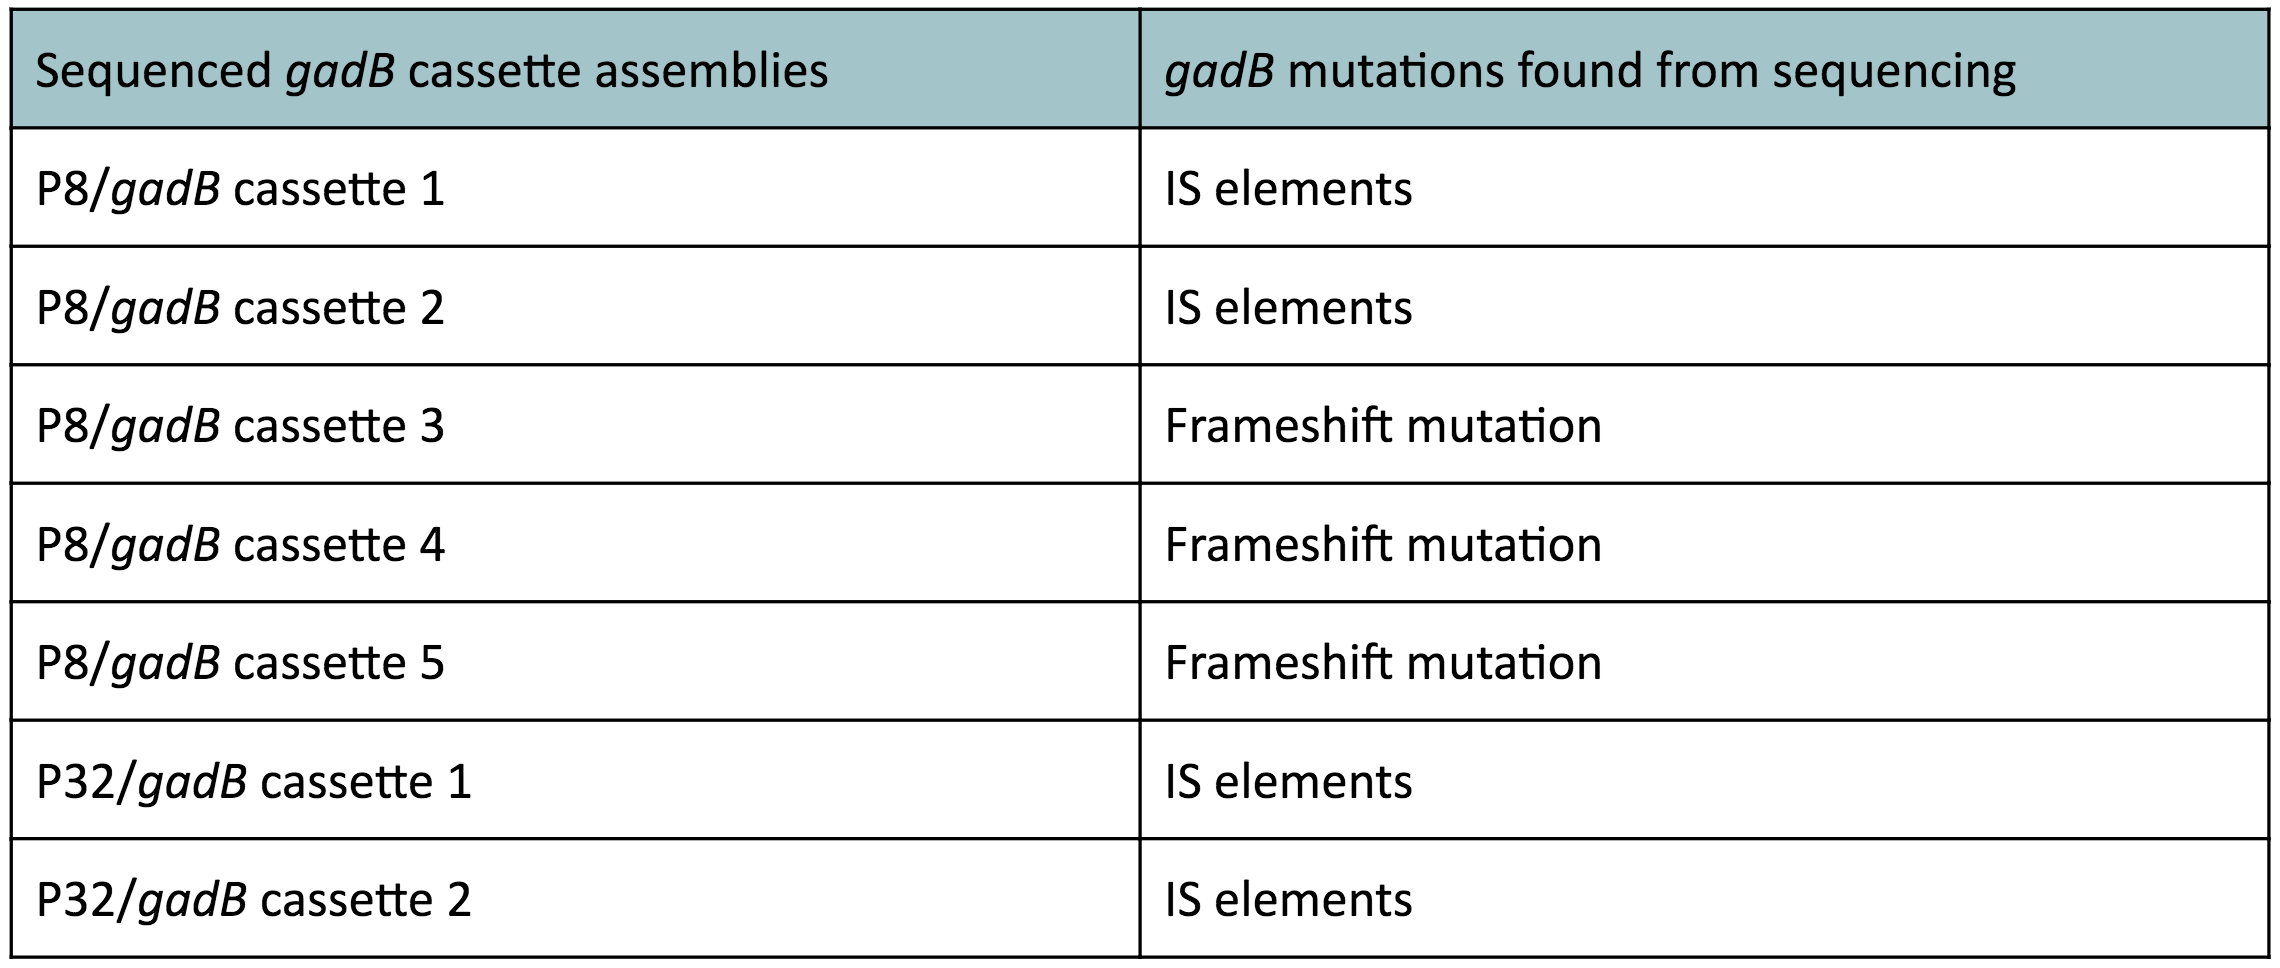
| − | < | + | <p style="font-family: verdana">The non-fluorescent colonies were then screened using colony PCR, and positive colonies were then miniprepped and sequenced. <b>The sequencing results indicated that there were several mutations within the <i>gadB</i> gene in the samples.</b> These mutations are recorded in <b>Table 1.</b></p> |
| − | + | ||
| − | + | ||
| − | + | ||
| − | + | ||
| − | + | ||
| − | + | ||
| − | + | ||
| − | + | ||
| − | + | ||
| − | + | ||
| − | + | ||
| − | + | ||
| − | + | ||
| − | |||
| − | |||
| − | |||
| − | |||
| − | |||
| − | |||
| − | |||
| − | + | </html> | |
| − | + | [[File:GadBmutations.jpg|thumb|center|600 px|<b>Table 1.</b> <i>gadB</i> mutations in sequenced P8/<i>gadB</i> and P32/<i>gadB</i> overexpression cassette plasmids. ]] | |
| − | + | <html> | |
| − | + | ||
| − | + | ||
| − | < | + | |
| − | </ | + | |
| − | + | ||
| − | + | ||
| − | + | ||
| − | < | + | |
| − | + | ||
| − | + | ||
| − | + | ||
| − | + | <br> | |
| − | + | ||
| − | + | ||
| − | + | ||
| − | + | ||
| − | + | ||
| − | + | ||
| − | |||
| − | |||
| − | |||
| − | |||
| − | |||
| − | |||
| − | |||
| − | + | <p style="font-family: verdana">Along with being one of the canonical amino acids utilized in protein synthesis, glutamate plays an important role as the main amino-group donor in the biosynthesis of nitrogen-containing compounds such as amino acids and nucleotides (4, 5). Thus, we hypothesized that <i>gadB</i> overexpression via the P8 and P32 constitutive promoters and the high-copy-number ColE1 origin induced a high metabolic load on the cells by shunting away glutamate from essential anabolic pathways. Additionally, having high <i>gadB</i> expression does not confer a selective advantage to the cells. We believed that transformants containing the mutationally inactivated <i>gadB</i> gene were favored in the population, as "breaking" the metabolically-taxing <i>gadB</i> gene gave these transformants a competitive advantage, allowing them to utilize glutamate sources towards growth. In contrast, transformants containing the functional <i>gadB</i> gene were selected against due to having a depletion of glutamate needed for important cellular processes. </p> | |
| − | + | ||
| − | + | ||
| − | + | ||
| − | + | ||
| − | + | ||
| − | + | ||
| − | + | <br> | |
| − | + | ||
| − | + | ||
| − | + | ||
| − | + | ||
| − | + | ||
| − | + | ||
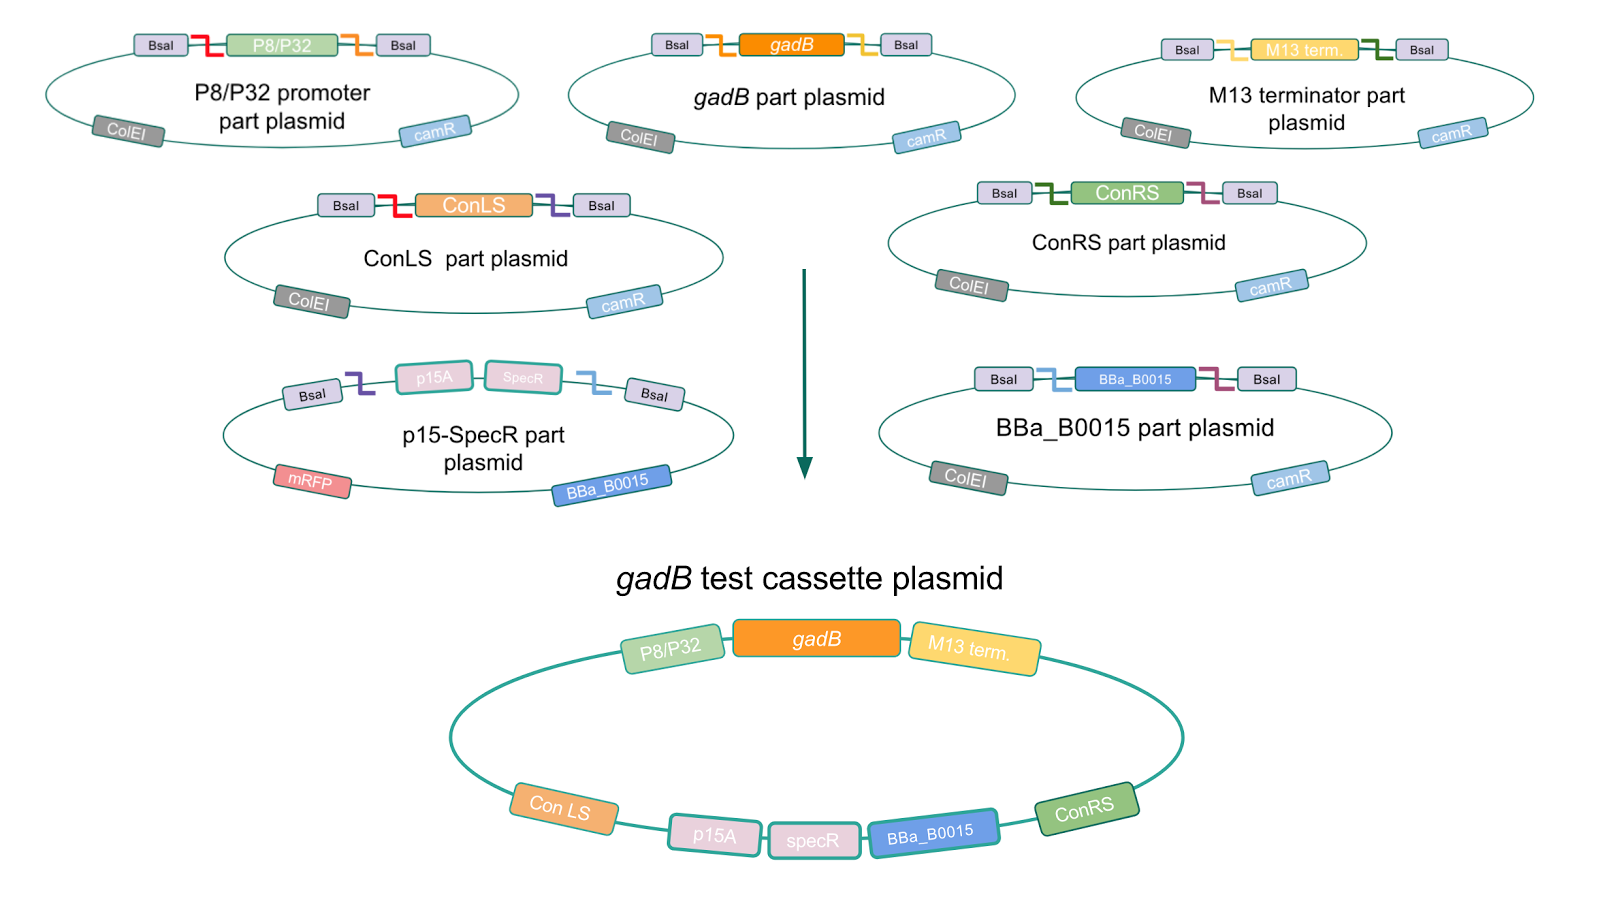
| − | + | <p style="font-family: verdana"><b>To troubleshoot this problem, we decided to use a backbone containing the low-copy number p15A origin for the cassette assembly (Fig. 7).</b></p> | |
| − | + | ||
| − | + | ||
| − | + | ||
| − | + | ||
| − | + | ||
| − | + | ||
| − | + | ||
| − | + | ||
| − | + | ||
| − | + | ||
| − | + | ||
| − | + | ||
| − | + | ||
| − | + | ||
| − | |||
| − | |||
| − | |||
| − | |||
| − | |||
| − | |||
| − | |||
| − | + | </html> | |
| − | + | [[File:T--Austin_UTexas--TestCassetteLowCopy.jpg|thumb|center|700px|<b>Figure 7.</b> Golden Gate assembly process of P8/<i>gadB</i> and P32/<i>gadB</i> test cassette plasmids using a backbone containing the low-copy number p15A origin.]] | |
| − | + | <html> | |
| − | + | ||
| − | + | ||
| − | + | ||
| − | + | ||
| − | |||
| − | |||
| − | |||
| − | |||
| − | |||
| − | |||
| − | |||
| − | |||
| − | |||
| − | < | + | <p style="font-family: verdana">Copy number reduction of our <i>gadB</i> overexpression cassette plasmids (accomplished by replacing the ColE1 origin with the p15A origin) was expected to decrease the overall amount of <i>gadB</i> expression, thereby decreasing the metabolic load imposed on the cells and the mutation rates observed in the <i>gadB</i> gene. <b>However, we also observed several mutations within the <i>gadB</i> gene in the potentially positive cassette plasmids sequenced.</b> The observed mutations are detailed in Table 2.</p> |
| − | < | + | </html> |
| − | < | + | [[File:GadBp15Amutations.jpg|thumb|center|700px|<b>Table 2.</b> <i>gadB</i> mutations in sequenced P8/<i>gadB</i>/p15A and P32/<i>gadB</i>/p15A overexpression cassette plasmids.]] |
| − | + | <html> | |
| − | + | ||
| − | + | ||
| − | + | ||
| − | + | ||
| − | + | ||
| − | + | ||
| − | + | ||
| − | + | ||
| − | + | ||
| − | + | <br> | |
| − | + | ||
| − | + | ||
| − | + | ||
| − | + | ||
| − | + | ||
| − | + | ||
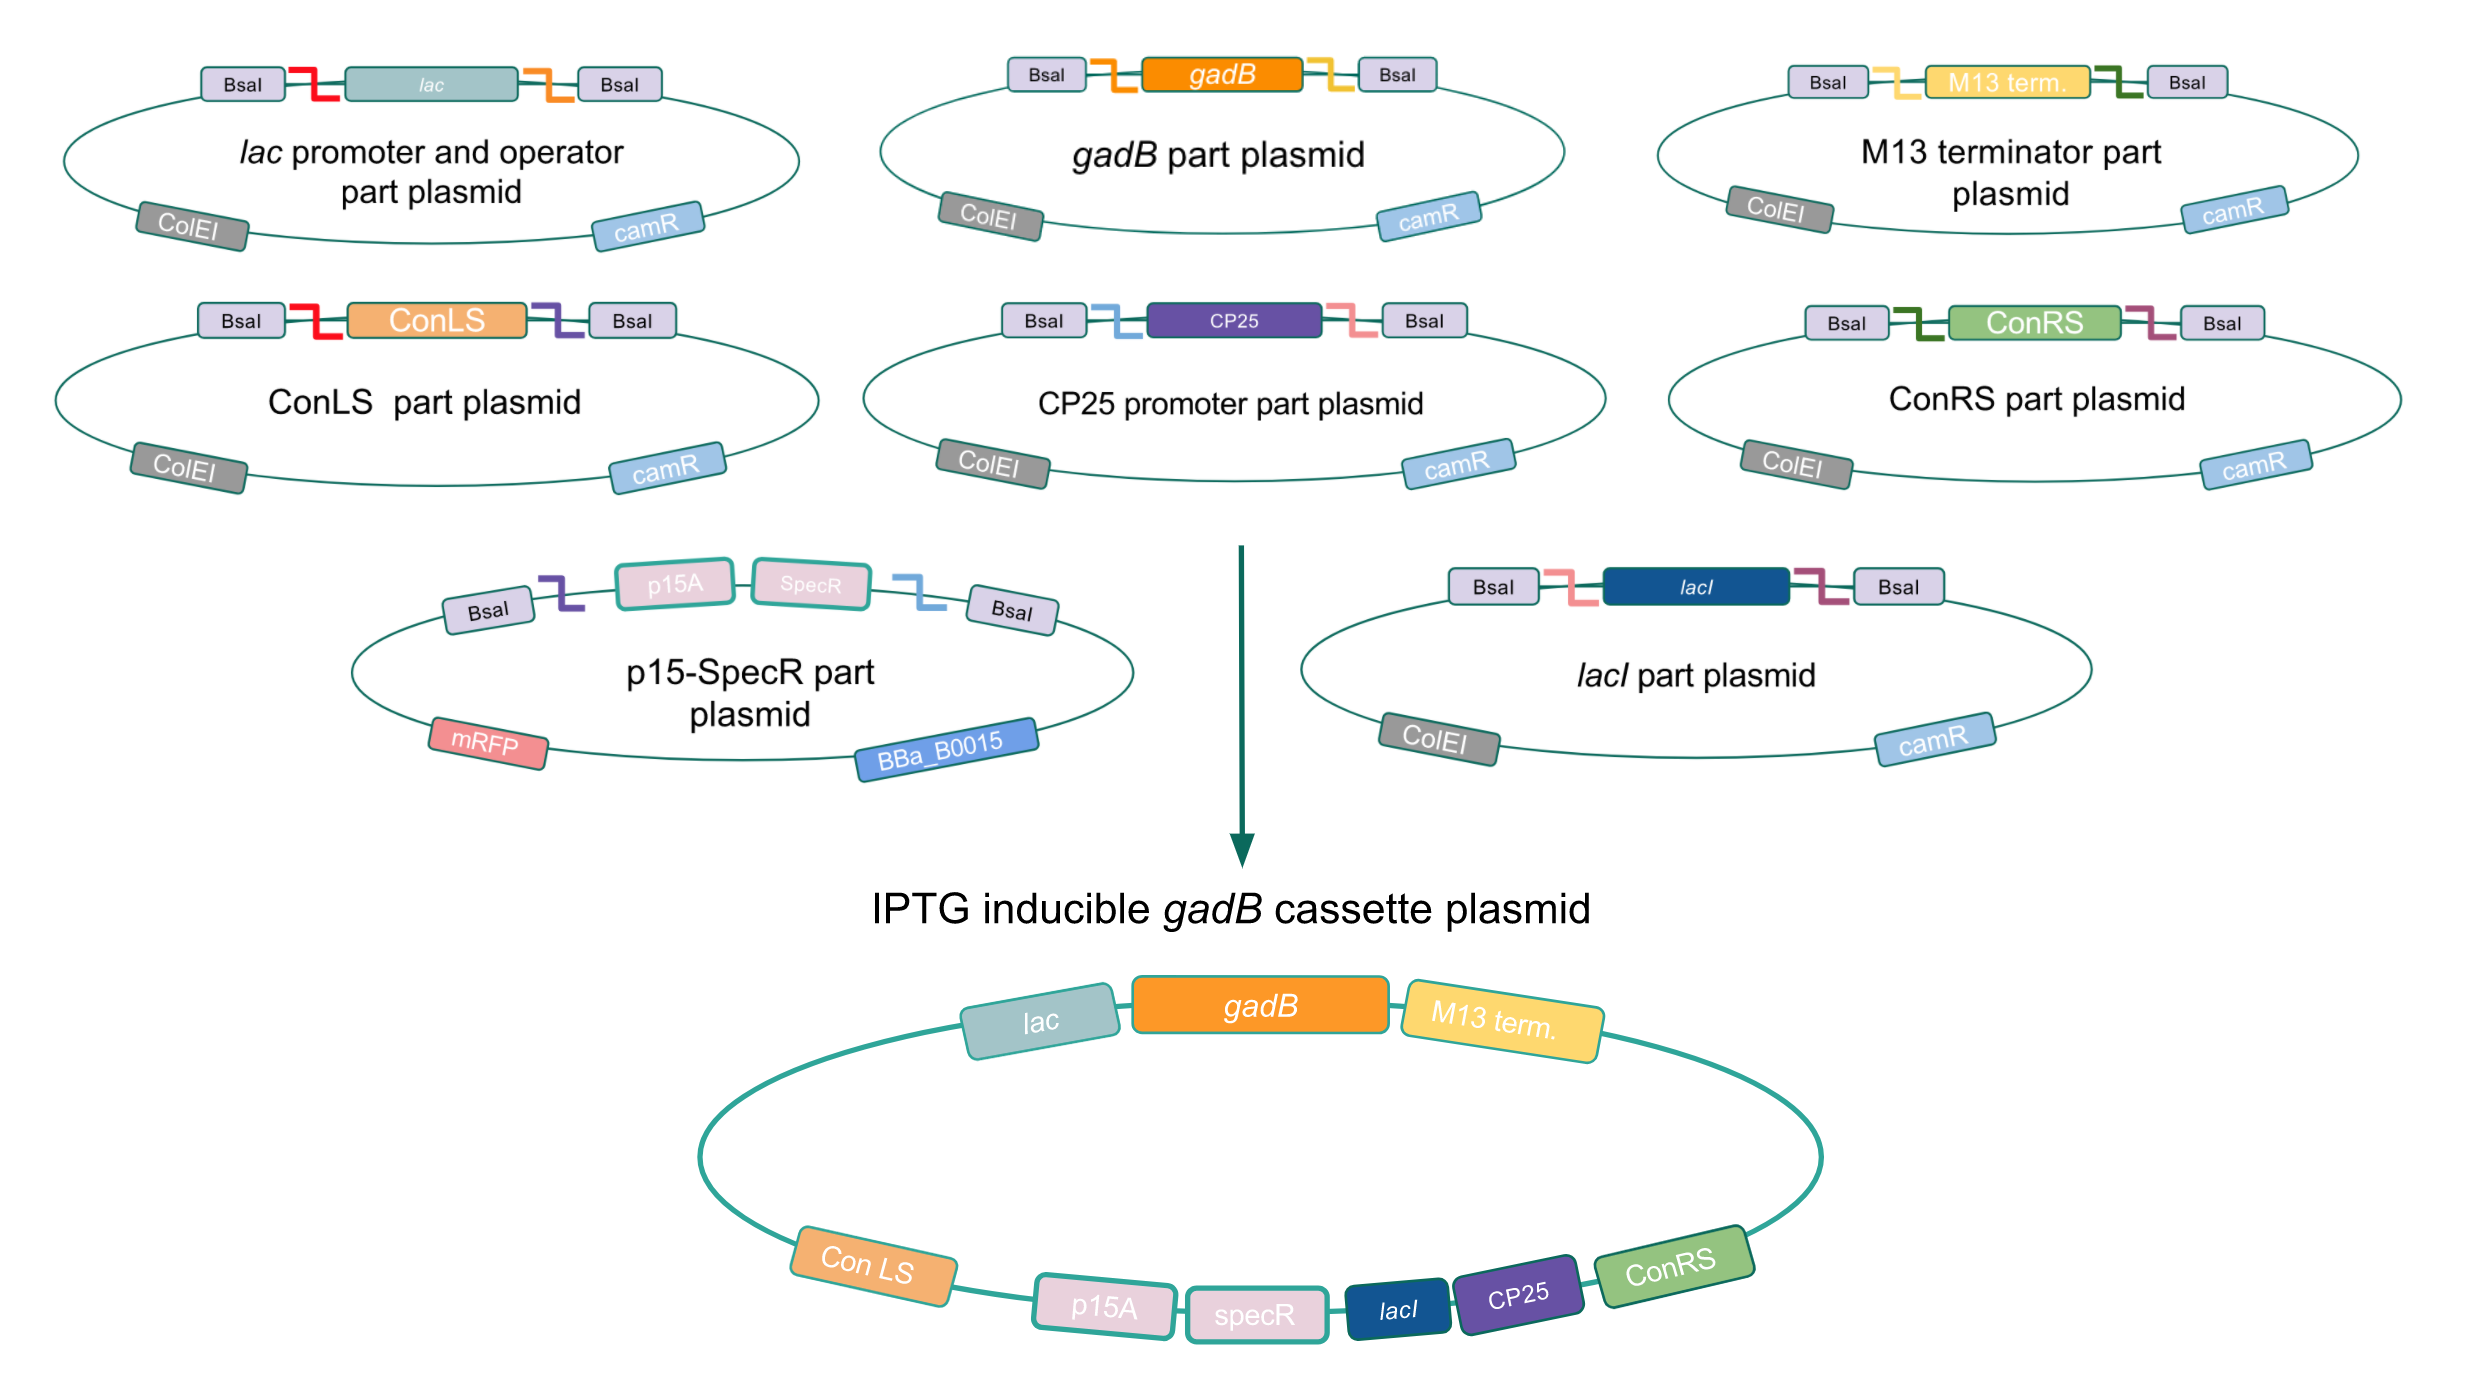
| − | + | <p style="font-family: verdana"><b>Given our experimental results and the fact that inducibly expressed genetic devices are more evolutionarily stable than constitutively expressed ones (6), we attempted to inducibly express the <i>gadB</i> gene using the regulatory elements of the <i>lac</i> operon to see if expression and maintenance of a stable <i>gadB</i> gene was possible in <i>E. coli</i></b>. Our IPTG-inducible <i>gadB</i> expression cassette plasmid was assembled using a <i>lac</i> promoter and operator part plasmid, the <i>gadB</i> gene part plasmid, the M13 terminator part plasmid, connector part plasmids, a CP25 promoter part plasmid, a <i>lacI</i> part plasmid, and the SpecR and p15A origin part plasmid <b>(Fig. 8)</b>. Under this assembled regulatory system, in the absence of IPTG (an analog of the allolactose inducer) the LacI repressor will bind to the <i>lac</i> operator region to block transcription of the <i>gadB</i> gene. When present, IPTG will act as an inducer and bind to the LacI repressor to decrease its binding affinity for the <i>lac</i> operator, thereby allowing for <i>gadB</i> expression. This IPTG-inducible system provides us with a mechanism of controlling <i>gadB</i> expression. <b>Positive colonies have been identified and sequence verification is currently underway.</b> </p> | |
| − | + | ||
| − | + | ||
| − | + | ||
| − | + | ||
| − | + | ||
| − | + | ||
| − | |||
| − | |||
| − | |||
| − | |||
| − | |||
| − | |||
| − | |||
| − | + | </html> | |
| − | + | [[File:T--Austin_UTexas--iptginduciblegadB.jpg|thumb|center|800px|<b>Figure 8.</b> Golden Gate assembly process of IPTG-inducible <i>gadB</i> expression cassette plasmid.]] | |
| − | + | <html> | |
| − | + | ||
| − | + | ||
| − | + | ||
| − | + | ||
| − | + | <a href="#navtop"><p>Back to Top</p></a> | |
| − | + | </div> | |
| − | + | <br> | |
| − | + | ||
| − | + | ||
| − | < | + | |
| − | + | ||
| − | + | ||
| − | + | ||
| − | + | ||
| − | + | ||
| − | + | ||
| − | + | ||
| + | <div class="naviSection" id="section4"> | ||
| + | <br> | ||
| + | <br> | ||
| + | <br> | ||
| − | + | <h2 style="font-family: verdana; font-size: 28px; text-align: center">Creating a Golden Gate compatible shuttle vector</h2> | |
| − | + | ||
| − | + | ||
| − | + | ||
| − | + | ||
| − | + | ||
| − | + | ||
| − | + | ||
| − | + | ||
| − | + | ||
| − | + | ||
| − | + | ||
| − | + | ||
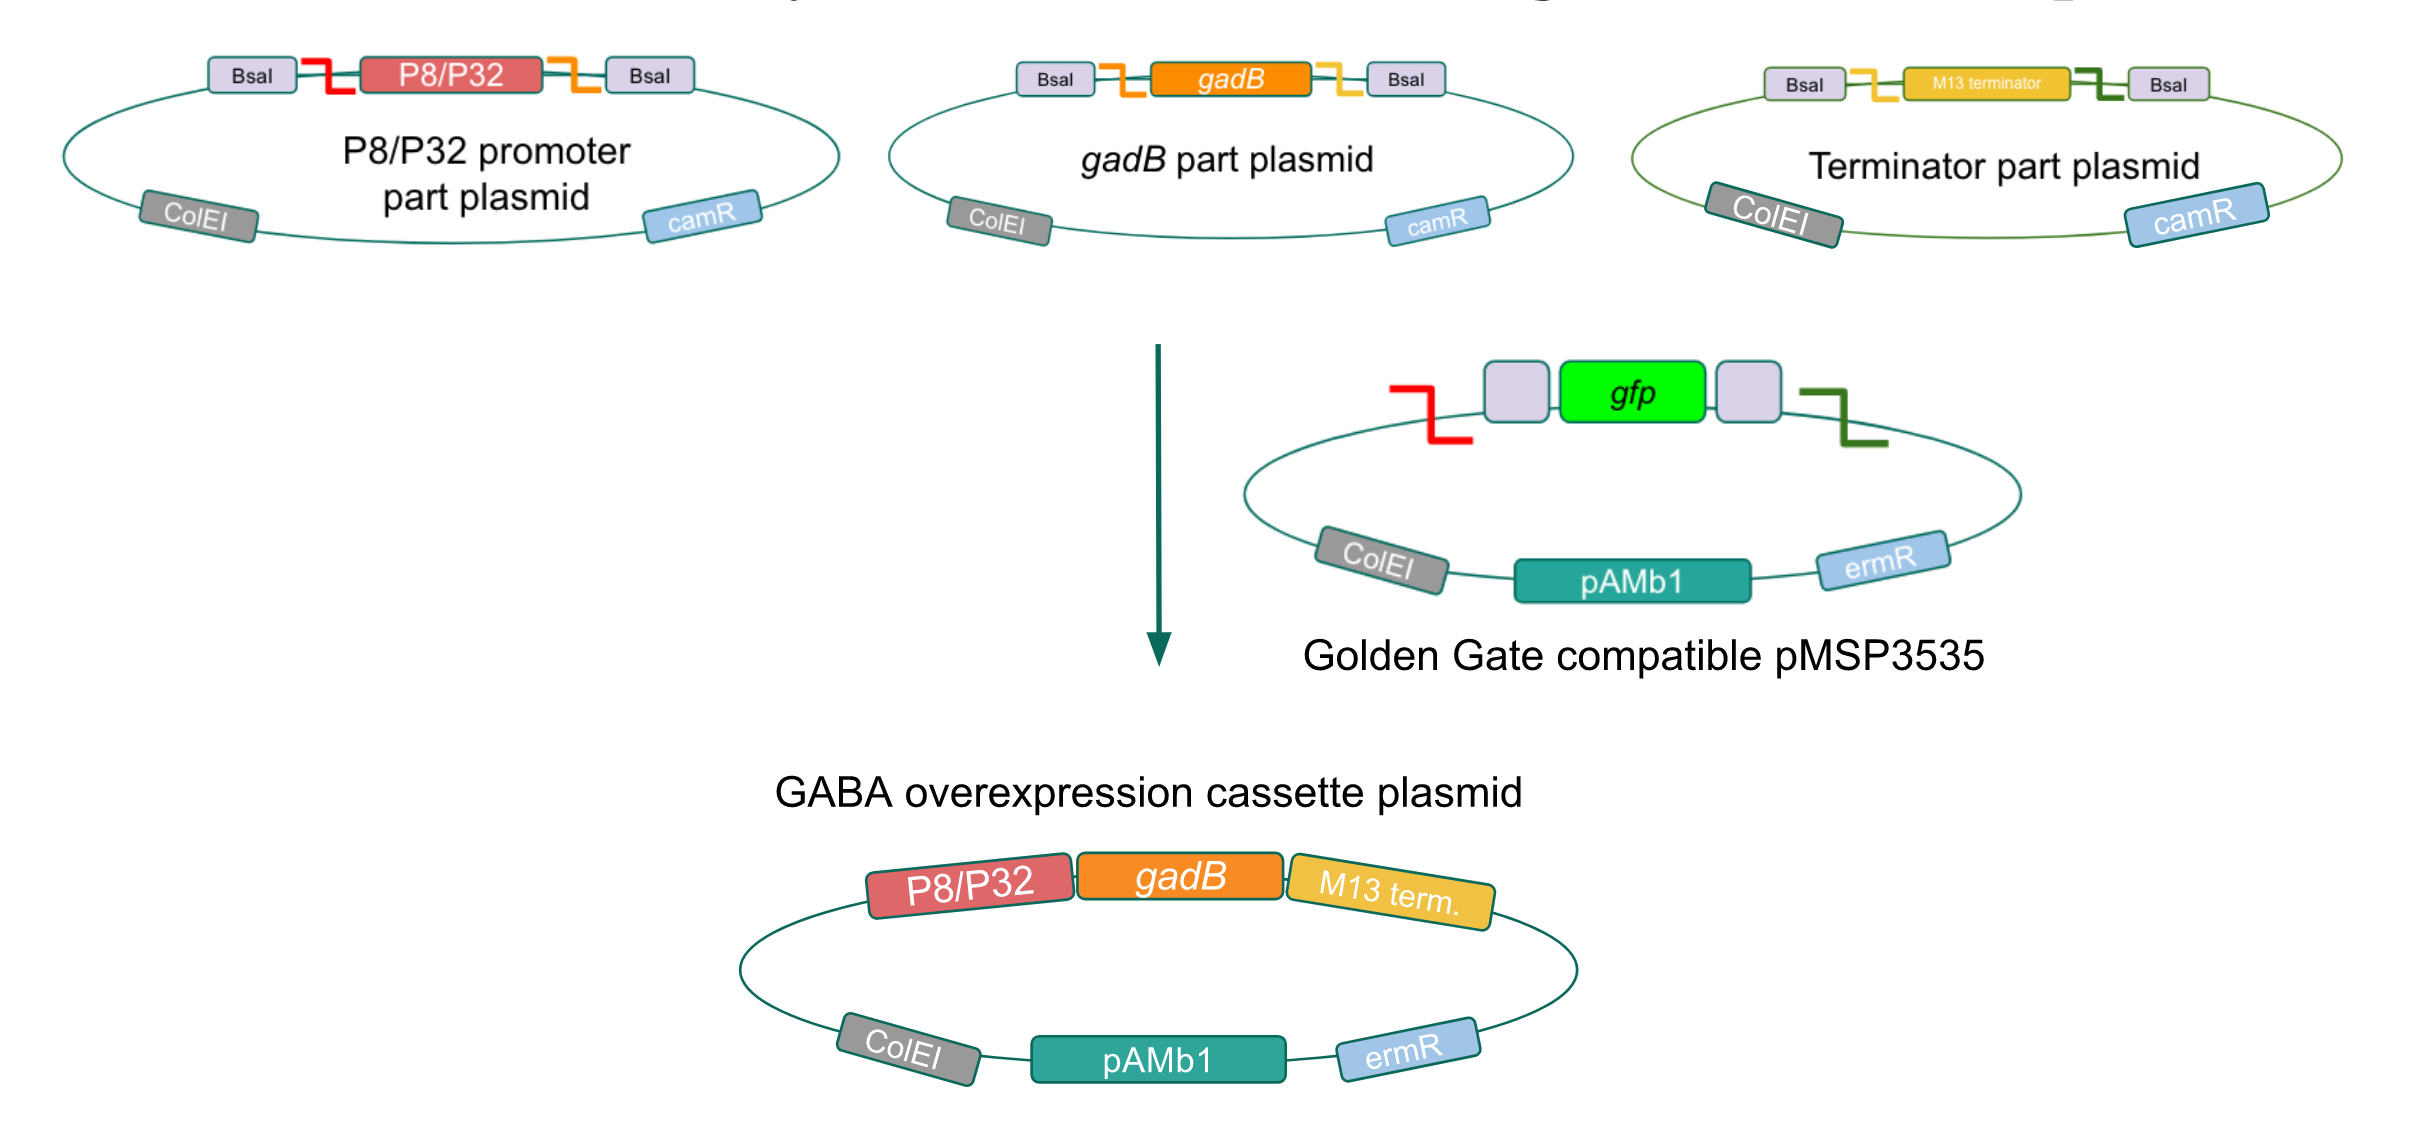
| − | + | <p style="font-family: verdana">We wanted to assemble our final GABA overexpression cassette plasmid using the shuttle vector pMSP3535 as the backbone <b>(Fig. 9).</b> To do this, we first needed to make pMSP3535 Golden Gate compatible (i.e. free of BsaI restriction sites and containing correct overhangs for cassette assembly). We chose to work with pMSP3535 as it contains both a ColE1 origin for replication in <i>E. coli</i> and a pAMb1 origin for replication in Gram-positive bacteria including <i>Lactobacillus</i> species (7), allowing us to easily transplant our cassette plasmid from <i>E. coli</i> to <i>Lactobacillus plantarum</i> once assembled. Additionally, the <strong>pMSP3535 vector contains the resistance gene for erythromycin, of which <i>Lactobacillus plantarum</i> is naturally susceptible (8).</strong></p> | |
| − | + | ||
| − | + | ||
| − | + | ||
| − | + | ||
| − | + | ||
| − | + | ||
| − | + | <br> | |
| − | + | ||
| − | + | ||
| − | + | ||
| − | + | ||
| − | + | ||
| − | + | ||
| − | + | </html> | |
| − | + | [[File:T--Austin_UTexas--Final_Cassette.jpg|thumb|center|800px|<b>Figure 9.</b> Golden Gate assembly of the GABA final overexpression cassette plasmid with the Golden Gate compatible pMSP3535 vector and the P8/P32 promoter, <i>gadB</i> gene, and M13 terminator part plasmids.]] | |
| − | + | <html> | |
| − | + | ||
| − | + | ||
| − | + | ||
| − | + | ||
| − | + | <br> | |
| − | + | ||
| − | + | ||
| − | + | ||
| − | + | ||
| − | + | ||
| − | + | ||
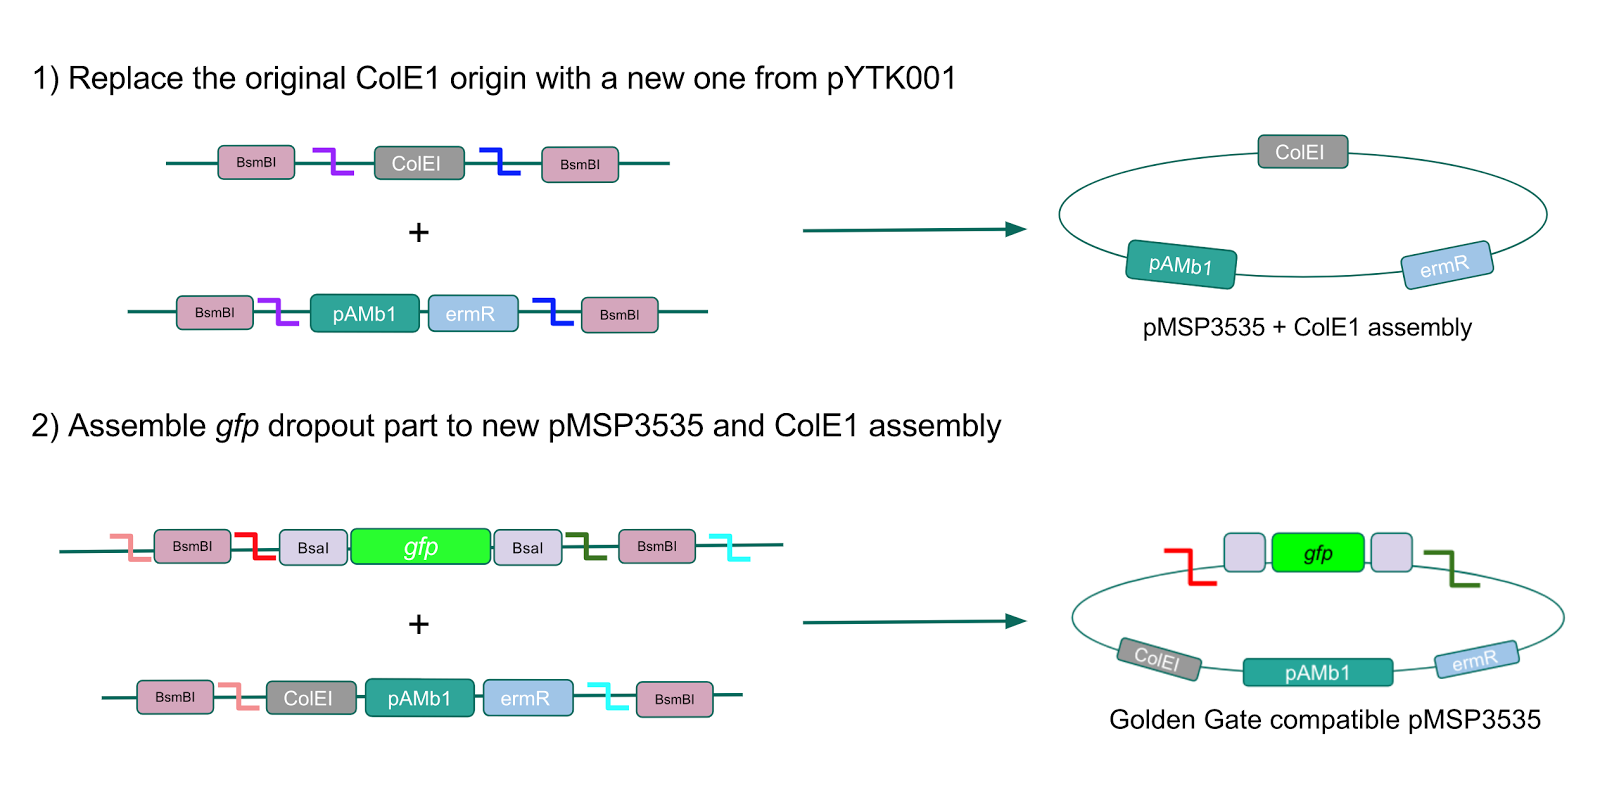
| − | + | <p style="font-family: verdana">The process of making the pMSP3535 vector Golden Gate compatible involved two steps: 1) assembling the pMSP3535 backbone (pAMb1 origin and erythromycin resistance gene) with a new ColE1 origin; 2) assembling a gfp dropout part to the assembly of the pMSP3535 backbone and the new ColE1 origin <b>(Fig. 10).</b></p> | |
| − | + | ||
| − | + | ||
| − | + | ||
| − | + | ||
| − | + | ||
| − | + | ||
| − | + | <br> | |
| − | + | ||
| − | + | ||
| − | + | ||
| − | + | ||
| − | + | ||
| − | + | ||
| − | </ | + | </html> |
| − | </ | + | [[File:T--Austin_UTexas--CreatingpMSP3535GGA.jpg|thumb|center|800px|<b>Figure 10.</b> Assembly workflow for creating the Golden Gate compatible pMSP3535 backbone. The first step involves replacing the ColE1 origin in the pMSP3535 backbone with a new ColE1 origin from pYTK001 to create a pMSP3535 + ColE1 assembly. The second step involves combining the pMSP3535 + ColE1 assembly with a <i>gfp</i> dropout to form the final Golden Gate compatible vector to be used to create our GABA overexpression plasmid.]] |
| + | <html> | ||
| + | <br> | ||
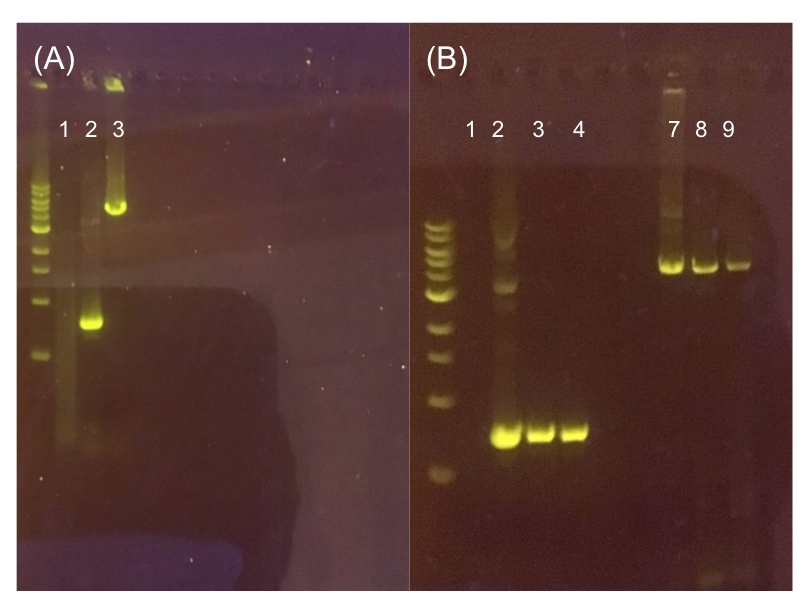
| − | < | + | <p style="font-family: verdana"><b>Since the original pMSP3535 vector contained two illegal BsaI sites within the ColE1 origin, we sought to replace this ColE1 origin with a BsaI-free one isolated from pYTK001.</b> This assembly process involved linearizing and adding BsmBI sites and compatible overhangs to the pMSP3535 backbone and the pYTK001 ColE1 origin via PCR. After the pMSP3535 backbone and ColE1 origin were successfully amplified by PCR <b>(Fig. 11a)</b>, they were joined together using BsmBI assembly. Diagnostic PCR was performed on pMSP3535 + ColE1 minipreps from <i>E. coli</i> transformants to screen for positive samples containing both the pMSP3535 backbone and the ColE1 inserts (Fig. 11b). <b>After confirming the presence of the pMSP3535 vector and ColE1 origin, we partially sequence-confirmed the two miniprep samples.</b></p> |
| − | < | + | <br> |
| − | + | ||
| − | + | ||
| − | + | ||
| − | + | ||
| − | + | ||
| − | + | ||
| − | + | ||
| − | + | ||
| − | + | ||
| − | + | ||
| − | + | ||
| − | + | </html> | |
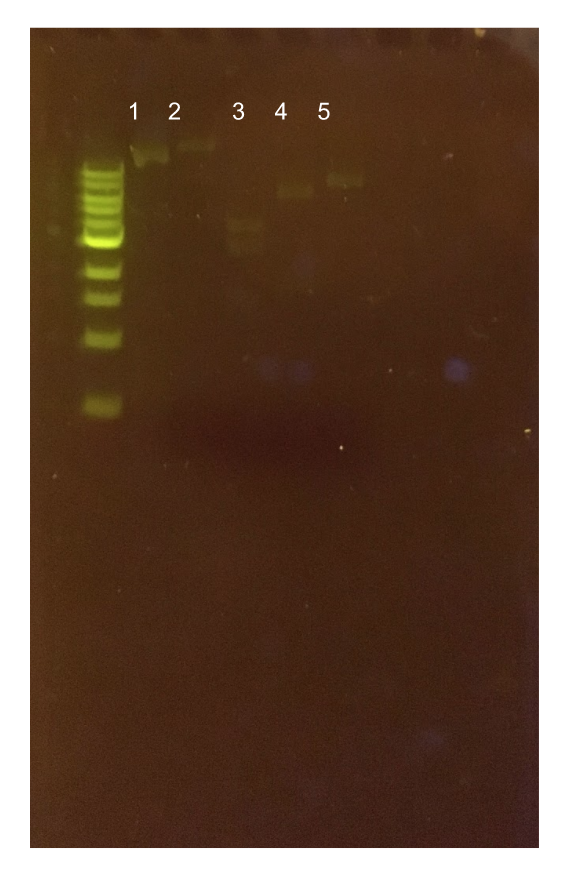
| − | + | [[File:T--Austin_UTexas--pMSP3535Gel.jpg|thumb|center|700px|Figure 11. (A) Agarose gel of successful PCR for the pMSP3535 backbone and the ColE1 origin. The ladder used is the 1KB NEB ladder. Lane 1 contains a negative PCR control. Lanes 2 and 3 contain the ColE1 origin (around 800 bp) and pMSP3535 backbone PCR products (around 4.3 kb). (B) Agarose gel of diagnostic PCR of miniprep samples from pMSP3535 + ColE1 transformants. Lane 1 contains a negative PCR control. Lane 2 contains a positive PCR control for the pMSP3535 backbone, while lanes 3 and 4 contain the pMSP3535 PCR from two miniprep samples. Lane 7 contains a positive PCR control for the ColE1 origin, while lanes 8 and 9 contain the ColE1 PCR from the same two miniprep samples. Evidently, the pMSP3535 backbone and ColE1 origin is present in both tested miniprep samples.]] | |
| − | + | <html> | |
| − | + | ||
| − | + | ||
| − | + | ||
| − | + | ||
| − | + | <br> | |
| − | + | ||
| − | + | ||
| − | + | ||
| − | + | ||
| − | + | ||
| − | + | ||
| − | + | <p style="font-family: verdana">To this pMSP3535 + ColE1 assembly, we wanted to add a <i>gfp</i> dropout part containing internal BsaI sites that will generate overhangs compatible with those in the P8/P32 promoter and M13 terminator part plasmids.</b> Additionally, the incorporation of this <i>gfp</i> dropout part will also allow us to visually screen for positive and negative transformants based on their fluorescence. BsmBI sites and compatible overhangs were added to the <i>gfp</i> dropout part by PCR amplifying it from pYTK047. We have been attempting to linearize and add BsmBI sites and overhangs to the positive pMSP3535 + ColE1 assemblies via PCR, with no success. However, results from diagnostic digests suggested that our assemblies may have contained extra, undesired DNA such as IS elements <b>(Fig. 12).</b> <b>Thus, as of right now, we are screening for more positive pMSP3535 + ColE1 transformants.</b> Once we have troubleshot this problem, the pMSP3535 + ColE1 and the <i>gfp</i> dropout PCR products will be joined through BsmBI assembly to form the final Golden Gate compatible pMSP3535 vector. </p> | |
| − | + | ||
| − | + | ||
| − | + | ||
| − | + | ||
| − | + | ||
| − | + | ||
| − | + | <br> | |
| − | + | ||
| − | + | ||
| − | + | ||
| − | + | ||
| − | + | ||
| − | + | ||
| − | + | </html> | |
| − | + | [[File:T--Austin_UTexas--pMSP3535ColE1Diag.jpg|thumb|center|450px|<b>Figure 12.</b> Agarose gel of pMSP3535 + ColE1 assembly diagnostic digests. The ladder used is the 1KB NEB ladder. Lane 1 contains the undigested plasmid assembly. Lane 2 contains the ClaI-digested plasmid with expected 400 bp and 4.6 kb bands. The actual band generated is apparently above 10 kb. Lane 3 contains the XmnI-digested plasmid with expected 200 bp, 1.5 kb, and 3.3 kb bands. The generated band sizes were 2.5 kb and 4 kb. Lane 4 contains the KpnI-digested assembly with an expected 5.1 kb band. The generated band size was 6 kb. Lane 5 contains the Bg1II-digested assembly with an expected 5.1 kb band. The generated band size was 8 kb.]] | |
| − | + | <html> | |
| − | + | ||
| − | + | ||
| − | + | ||
| − | + | ||
| − | < | + | <br> |
| − | + | ||
| − | < | + | <h4 style="font-family: verdana"; font-size: 28px; text-align: center">Assessing erythromycin susceptibility of <i>E. coli</i></h4> |
| − | < | + | <br> |
| − | + | ||
| − | + | ||
| − | + | ||
| − | + | ||
| − | + | ||
| − | + | ||
| − | + | ||
| − | + | ||
| − | + | ||
| − | + | ||
| − | + | ||
| − | + | <p style="font-family: verdana">Because we are creating our Golden Gate compatible pMSP3535 shuttle vector in <i>E. coli</i>, we wanted to determine the natural susceptibility of <i>E. coli</i> to erythromycin as the minimum concentration to use has not been established clearly in the literature. Thus, we performed an erythromycin minimum inhibitory concentration test in liquid LB media <b>(Fig. 13).</b> After one-day incubation, we observed that <i>E. coli</i> was resistant up to around 150 µg/mL of erythromycin. <b>From this experiment, we have determined that the optimal erythromycin concentration for selecting against <i>E. coli</i> in liquid culture is around 200-250 µg/mL.</b></p> | |
| − | + | ||
| − | + | ||
| − | + | ||
| − | + | ||
| − | + | ||
| − | + | ||
| − | + | <br> | |
| − | + | ||
| − | + | ||
| − | + | ||
| − | + | ||
| − | + | ||
| − | + | ||
| − | + | </html> | |
| − | + | [[File:T--Austin_UTexas--erymic.jpg|thumb|center|800px|<b>Figure 13.</b> Erythromycin minimum inhibitory concentration tests for <i>E. coli</i> in liquid media. From left to right: 0 µg/mL, 50 µg/mL, 100 µg/mL, 150 µg/mL, 200 µg/mL, 250 µg/mL, 300 µg/mL, 350 µg/mL, and 400 µg/mL.]] | |
| − | + | <html> | |
| − | + | ||
| − | + | ||
| − | + | ||
| − | + | ||
| − | + | <a href="#navtop"><p>Back to Top</p></a> | |
| − | + | </div> | |
| − | + | ||
| − | + | ||
| − | + | ||
| − | + | ||
| − | + | ||
| − | < | + | <br> |
| − | + | ||
| − | < | + | <div class="naviSection" id="section5"> |
| + | <br> | ||
| + | <br> | ||
| + | <br> | ||
| + | <div style="background-color: lightcyan;padding:14px;"> | ||
| + | <h2 style="font-family: verdana; font-size: 30px; text-align: center"><i>Lactobacillus plantarum</i> transformation</h2> | ||
| − | < | + | <br> |
| − | + | ||
| − | + | ||
| − | + | ||
| − | + | ||
| − | + | ||
| − | + | ||
| − | + | ||
| − | + | ||
| − | + | ||
| − | + | ||
| − | + | ||
| − | + | <p style="font-family: verdana"> In order to grow <i>Lactobacillus plantarum</i>, we used MRS broth in a CO<sub>2</sub> incubator without shaking. After characterizing the growth of the bacteria, we aimed to transform it with pMSP3535. We first attempted several protocols, including Landete 2014 (11) and Speer 2012 (12). However, we found success using a variation of the Welker protocol (13). After preparing the necessary solutions, we followed the Welker protocol with some minor differences, including inoculation of bacterial stocks in 10 mL of MRS broth rather than 25mL; utilizing a CO<sub>2</sub> incubator without shaking; subculturing cells in 0.9M NaCl rather than glycine, transforming with 100 ng of plasmid DNA instead of the 200 ng that the protocol recommends, and electroporating with a resistance of 3kV and 600Ω. For more information about the protocols including broth recipe and transformation procedure, click <a href="https://2017.igem.org/Team:Austin_UTexas/Protocols">here!</a></p> | |
| − | + | ||
| − | + | ||
| − | + | ||
| − | + | ||
| − | + | ||
| − | + | ||
| − | + | <br> | |
| − | + | ||
| − | + | ||
| − | + | ||
| − | + | ||
| − | + | ||
| − | + | ||
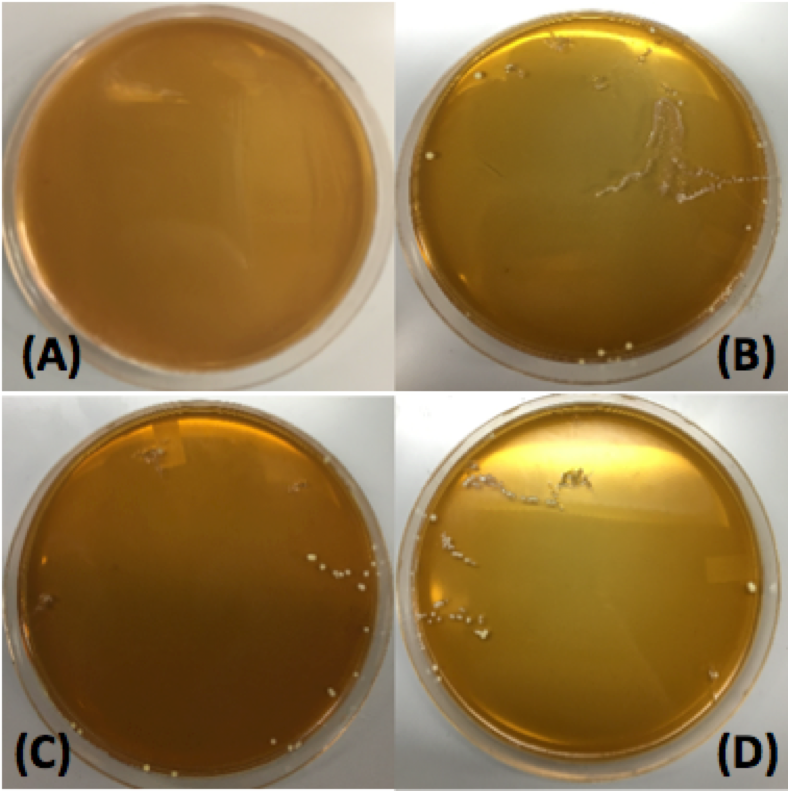
| + | <p style="font-family: verdana"> Our first plasmid we chose to transform <i> Lactobacillus plantarum </i> with was pMSP3535. This plasmid expresses erythromycin resistance and contains the pAMB1 origin. | ||
| + | After cells were electroporated, they recovered overnight in the appropriate recovery media. They were plated on MRS agar plates supplemented with 10 μg/mL erythromycin and left to grow for 2 days. The results of our transformation can be seen in <b>Figure 14</b>.</p> | ||
| − | + | <br> | |
| − | + | ||
| − | + | ||
| − | + | ||
| − | + | ||
| − | + | ||
| − | + | ||
| − | </ | + | </html> |
| − | </ | + | [[File:Orglacto.png|thumb|center|450px|<strong>Figure 14.</strong> Transformations of <i>Lactobacillus plantarum</i> with pMSP3535. Plate A corresponds to the negative control: electroporated cells at 3kV and 600 Ω with no plasmid DNA. Plate B corresponds to cells with 100 ng of pMSP3535 plasmid DNA electroporated at 2kV and 400 Ω. Plate cells were electroporated at 2.5kV and 400 Ω with 100 ng of pMSP3535 plasmid DNA. Plate D corresponds to the cells electroporated at 3kV and 600 Ω with 100 ng of pMSP3535.]] |
| + | <html> | ||
| − | < | + | <br> |
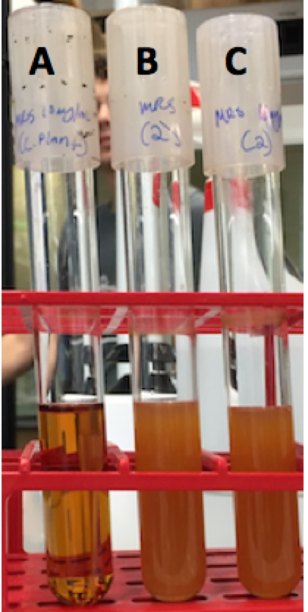
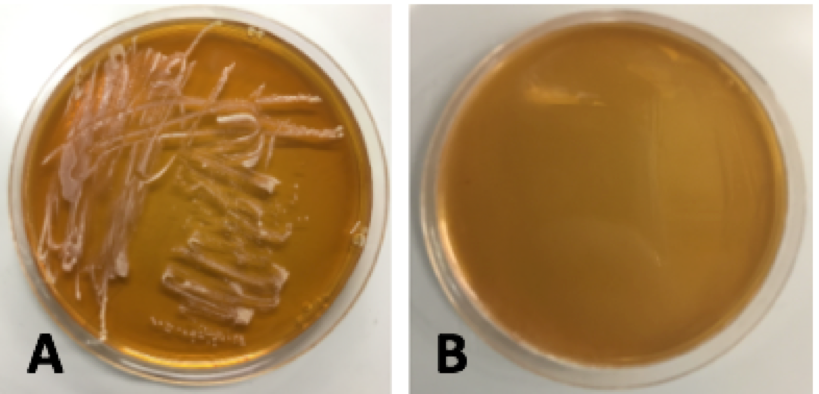
| − | < | + | <p style="font-family: verdana">Colonies from each transformation plate were grown up in MRS broth supplemented with 10 μg/mL erythromycin. The next day, they were streaked on 10μg/mL erythromycin MRS agar plates to verify resistance to erythromycin. The overnight cultures and re-streaks are shown in <b>Figure 15</b> and <b>Figure 16</b> respectively.</p> |
| − | + | ||
| − | + | ||
| − | + | ||
| − | + | ||
| − | + | ||
| − | + | ||
| − | + | ||
| − | + | ||
| − | + | ||
| − | + | ||
| − | + | ||
| − | + | <strong><p style="font-family: verdana"> Genomic and plasmid sequence verification is underway.</p></strong> | |
| − | + | ||
| − | + | ||
| − | + | ||
| − | + | ||
| − | + | ||
| − | + | ||
| − | + | <br> | |
| − | + | ||
| − | + | ||
| − | + | ||
| − | + | ||
| − | + | ||
| − | + | ||
| + | </html> | ||
| + | [[File:Tubes.png|thumb|center|350px|'''<b>Figure 15.</b>'''Overnight cultures of transformed<i>Lactobacillus plantarum</i> were grown in erythromycin. Tube A is the negative control: untransformed <i> Lactobacillus plantarum</i> in MRS broth supplemented with 10μg/mL erythromycin. Tube B was our positive control: transformed <i> Lactobacillus plantarum</i> in MRS broth. Tube C is the experimental cells: transformed <i>Lactobacillus plantarum</i> grown in MRS broth supplemented in 10μg/mL erythromycin.'']] | ||
| + | <html> | ||
| + | |||
| + | <br> | ||
| + | |||
| + | </html> | ||
| + | [[File:Restreaks.png|thumb|center|350px|'''<b>Figure 16.</b>''' This figure displays a transformed <i>Lactobacillus plantarum</i> re-streak plated on MRS agar supplemented with 10μg/mL erythromycin beside a negative control. Plate A corresponds to untransformed <i>L. plantarum</i> on the selective media and Plate B corresponds to the transformed bacteria on selective media.'']] | ||
| + | <html> | ||
| + | |||
| + | <br> | ||
| + | |||
| + | <h2 style="font-family: verdana; font-size: 30px; text-align: center">References</h2> | ||
| + | |||
| + | <br> | ||
| − | + | <ol style="font-size:13px; font-family: verdana"> | |
| − | + | <li>Yunes, R. A et al. GABA production and structure of <i>gadB</i>/<i>gadC</i> genes in <i>Lactobacillus</i> and <i>Bifidobacterium</i> strains from human microbiota. <i>Anaerobe</i>. 42: 197-204 (2016).</li> | |
| − | + | ||
| − | + | <li>Zhu, D. et al. Isolation of strong constitutive promoters from <i>Lactococcus lactis</i> subsp. Lactis N8. <i>FEMS Microbiol Lett</i>. 363(16): pii: fnv107 (2015). </li> | |
| − | + | ||
| − | + | <li>Lee, M. E. et al. A Highly Characterized Yeast Toolkit for Modular, Multipart Assembly. <i>ACS Synth. Biol</i>. 4(9): 975-86 (2015). </li> | |
| − | + | ||
| − | </ | + | <li>Commichau, F. M., et al. Glutamate metabolism in <i>Bacillus subtilis</i>: Gene Expression and Enzyme Activities Evolved To Avoid Futile Cycles and to allow Rapid Responses to Perturbations of the System. <i>AMS</i>. 190(10): 3557-64 (2008).</li> |
| − | </ | + | |
| + | <li>Sarkar, P.K. and Nout, M.J.R. (Eds.) 2014. Handbook of Indigenous Foods Involving Alkaline Fermentation. CRC Press/Taylor & Francis Group, p. 629.</il> | ||
| − | < | + | <li>Sleight, S. C. et al. Designing and engineering evolutionary robust genetic circuits. Journal of Biological Engineering. (4):12 (2010).</il> |
| + | |||
| + | <li>Pérez-Arellano, I. et al. Construction of Compatible Wide-Host-Range Shuttle Vectors for Lactic Acid Bacteria and <i>Escherichia coli</i>. Plasmid. 46(2): 106-16 (2001).</li> | ||
| + | |||
| + | <li>Flórez A. B. et al. Susceptibility of <i>Lactobacillus plantarum</i> Strains to Six Antibiotics and Definition of New Susceptibility–Resistance Cutoff Values. <i>Microbial Drug Resistance</i>. 12(4): 252-56 (2007).</li> | ||
| − | < | + | <li> Cox, C. P., & Briggs, M. (1954). Experiments On Growth Media For <i>Lactobacilli</i>. Journal of Applied Bacteriology, 17(1), 18-26. doi:10.1111/j.1365-2672.1954.tb02019.x</li> |
| − | < | + | |
| − | + | ||
| − | + | ||
| − | + | ||
| − | + | ||
| − | + | ||
| − | + | ||
| − | + | ||
| − | + | ||
| − | + | ||
| − | + | ||
| − | + | <li>Man, J. C., Rogosa, M., & Sharpe, M. E. (1960). A Medium For The Cultivation Of <i>Lactobacilli</i>. Journal of Applied Bacteriology, 23(1), 130-135. doi:10.1111/j.1365-2672.1960.tb00188.x</li> | |
| − | + | ||
| − | + | ||
| − | + | ||
| − | + | ||
| − | + | ||
| − | + | ||
| − | + | <li>Speer, M., & Richard, T. (n.d.).<i> Lactobacillus</i> transformation (Speer 2012). Retrieved May 15, 2017, from https://openwetware.org/wiki/Lactobacillus_transformation_(Speer_2012)</li> | |
| − | + | ||
| − | + | ||
| − | + | ||
| − | + | ||
| − | + | ||
| − | + | ||
| + | <li>Landete, J. M., Arqués, J. L., Peirotén, Á, Langa, S., & Medina, M. (2014). An improved method for the electrotransformation of lactic acid bacteria: A comparative survey. Journal of Microbiological Methods, 105, 130-133. doi:10.1016/j.mimet.2014.07.022</li> | ||
| − | + | <li>Dennis L. Welker, Joanne E. Hughes, James L. Steele, Jeff R. Broadbent; High-efficiency electrotransformation of <i>Lactobacillus casei</i>, FEMS Microbiology Letters, Volume 362, Issue 2, 1 January 2015, Pages 1–6, https://doi.org/10.1093/femsle/fnu033</li> | |
| − | + | ||
| − | + | ||
| − | + | ||
| − | + | ||
| − | + | ||
| − | + | ||
| − | |||
| − | |||
| − | |||
| − | |||
| − | |||
| − | |||
| − | |||
| − | + | <li>Murphy, M. G., & Condon, S. (1984). Comparison of aerobic and anaerobic growth of <i>Lactobacillus plantarum</i> in a glucose medium. Archives of Microbiology, 138(1), 49-53. </li> | |
| − | + | ||
| − | + | ||
| − | + | ||
| − | + | ||
| − | + | ||
| − | + | ||
| − | |||
| − | |||
| − | |||
| − | |||
| − | |||
| − | |||
| − | |||
| − | + | <li>GABA 3D ball-and-stick model, viewed 1 November 2017, by Jynto, from <a href="https://commons.wikimedia.org/wiki/File:GABA_3D_ball.png#file">Wikimedia Commons.</a></li> | |
| − | + | ||
| − | + | ||
| − | + | ||
| − | + | ||
| − | + | ||
| − | + | ||
| − | |||
| − | |||
| − | + | </ol> | |
| − | + | <a href="#navtop"><p>Back to Top</p></a> | |
</div> | </div> | ||
| − | |||
| − | |||
| − | |||
</html> | </html> | ||
Latest revision as of 07:00, 21 November 2017
Results
Although bacteria can naturally synthesize GABA, we wanted to increase expression of the gadB gene and subsequently GABA production in order to give our intended probiotic, Lactobacillus plantarum, a more potent medicinal quality, with the idea that this GABA-overproducing probiotic can then be consumed by patients with bowel disorders, hypertension or anxiety (1). Overexpression of the gadB gene will be accomplished by placing it under the control of either the P8 or P32 constitutive promoters from Lactococcus lactis (2).
To make our GABA-producing probiotic, we ultimately needed to assemble a GABA overexpression cassette plasmid. The intention is that bacteria containing this GABA overexpression cassette plasmid should produce high levels of GABA. In order to assemble this plasmid, we decided to utilize the Golden Gate Assembly method. In short, Golden Gate Assembly is a relatively new cloning method that allows for the creation of a multi-part DNA assembly (i.e. cassette plasmid) in a single reaction through the use of DNA parts containing specific, predefined suffixes and prefixes with recognition sites for Type IIs restriction enzymes (e.g. BsmBI and BsaI). The specificity of these suffixes and prefixes provides directionality of the desired DNA parts during the assembly process. For our purposes, we used the MoClo Yeast Tool Kit developed by John Dueber (3).
We decided to first assemble and test our Golden Gate plasmids in E. coli, which was chosen due to the ease in which we could genetically manipulate it. We then wanted to use these Golden Gate plasmids to genetically manipulate L. plantarum. This part of the project required us to assemble a Golden Gate compatible shuttle vector (that is replicable in both E. coli and L. plantarum ) and transform L. plantarum. Our experimental results are detailed below.


