Team:Heidelberg/Validation
Evolution of \(\beta\)-Lactamases
Motivation
The deep neural network DeeProtein represents the heart of our AiGEM software suite. DeeProtein was trained on about 8 million sequences of the UniProt database to grasp the complex sequence to function relation in proteins. It is able to categorize a sequence multimodal into 886 classes of gene-ontology (GO) terms of the molecular function GO graph. As gene ontology terms are labels for protein functionality, we hypothesize that it is possible to assert protein activity based on the learned representation of the sequence to function relation in DeeProtein. To back this claim we set out for a comprehensive validation of the DeeProtein classification score. We applied GAIA, interfaced with a DeeProtein variant specifically trained on \(\beta\)-lactamases, to predict a set of \(\beta\)-lactamase sequences matching the following criterion: The set should contain a broad range of variants with higher and lower DeeProtein classification scores compared to the wildtype.As a measure for enzyme activity we state the minimal inhibitory concentration (MIC) of carbenicillin for each candidate in the set. We demonstrate a correlation between the MIC of carbenicillin and the average DeeProtein classification score of the screened candidates. Further we improve the performance of our deep neural network by incorporating the generated wet-lab data into our training process.
Experimental Design - Software
Definition of Mutationsites
In order to facilitate the cloning process in the wetlab and as a consequence of our limited ressource we defined patches on the \(\beta\)-lactamase sequence to introduce mutations to. The patches were defined after manual assertion of the structure in pyMOL under the premisse of a borad residue spectrum. Thus we selected patches forming the pocket, as well as central structural elements of the \(\beta\)-lactamase enzyme.
GAIA preferences and Variant selection
We ran GAIA separately for each mutative window for up to 1000 generations in a single mutation mode: The rate of mutation was limited to one amino acid substitution per generation with one initial mutation. Additionally, we ran GAIA in double mutation mode over the combined frames for the same number of generations.For each generation, the top five suggested candidates were saved and added to the pool of suggested sequences. Subsequently, we selected a subset of the proposed sequence pool for wet lab validation under the premise of covering a broad activity spectrum. Thus, we selected variants scoring higher than the wildtype and mutants scoring lower than the wildtype. A table displaying the scores for each mutation is depicted at the end of the page.
Experimental Design - Wet-lab
Construct Design
To create a plasmid that is compatible with other biobrick parts, we decided to clone the ß-lactamase cassette into the pSB1C3 backbone. The ampicillin resistance gene was obtained from pSB1A3 and was introduced into the biobrick backbone via Golden Gate cloning. The BsaI restriction site, which is located inside the ß-lactamase coding sequence was previously removed to facilitate easy and fast cloning. The second antibiotic resistance cassette, derived by the pSB1C3 backbone is important, because it enabled us to select for the correct constructs, even when the ß-lactamase gene was not active or activity heavily reduced. The mutations, we cloned were located within six different windows. Cloning of these variants were performed by Golden Gate. The different parts of the plasmid were PCR amplified and the mutations were placed in primer extensions. Subsequently, the mutated plasmid was assembled with Golden Gate cloning. In this way, we generated single, double and triple mutants of the gene.Determination of the Minimal Inhibitory Concentration
The activity of an antibiotic resistance can be determined via the minimal inhibitory concentration (MIC). The MIC is the minimum concentration is the concentration, at which the growth of an microorganism, in our case E. coli can survive. At mic50, for instance, the growth of a culture is slowed down by fifty percent. Typical methods to determine MICs are broth or agar dilutions. The principle is as simple as effective. The microorganism is cultured in liquid medium or on plates with different concentrations of the inhibiting agentIn our case, we want to evaluate differences in the activity of a well characterized protein. Consequently, such an dilution method is ideal. It is easy to setup, very robust and gives exactly the information that is needed for the characterization.
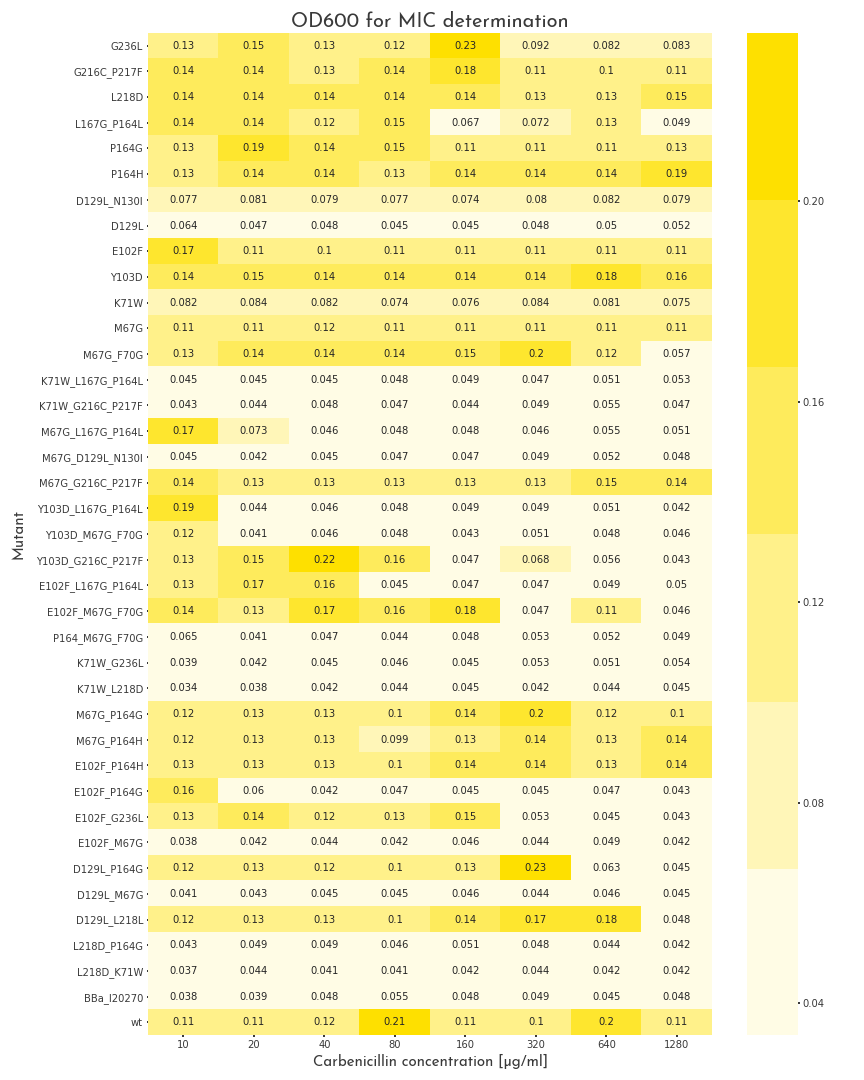
To start the assay, colonies were picked into LB medium with 100 µg/ml chloramphenicol, but without carbenicillin and were grown to the stationary phase for 20 h. Then, deep well plates with 500 µl LB broth per well were prepared. The medium was supplemented with 100 µg/ml chloramphenicol and for each mutant, eight wells with different carbenicillin concentrations, ranging from 10-1280 µg/ml were prepared. Each well was inoculated with 2 µl of the proculture. The new cultures were incubated another 8 h. Finally, the OD600 of each well was measured. By this measure we were able to assert the growth ability of each variant.
Results
Results - Wet-lab
The MIC of 37 cloned variants, a positive control with the wildtype ß-lactamase and a negative control, without an ampicillin resistance were tested within a carbenicillin concentration range between 10 µg/ml and 1280 µg/ml. When the OD600 was measured, a value of 0.08 was set as cutoff between bacteria that were resistant to a specific concentration and those that were not. The negative control could not grow under all conditions. Thus the lowest tested concentration of 10 µg/ml was already above the MIC of E. coli. 13 of the 37 tested variants did not show any significant ß-lactamase activity and did not grow at any carbenicillin concentration. As expected, the majority, eleven of thirteen, were double and triple mutants, whereas only two single mutants lead to the destruction of enzyme activity. Interestingly, these two single mutations, D129L and K71W appear in 10 of the 13 catalytically dead mutants, which underlines their meaning for enzyme activity. Furthermore, it is noteworthy, that one double mutant, D129L, L218D has a MIC above 640 µg/ml. This suggests that L218D can somehow compensate for the negative effect of D129L.Several variants, 12, had their MIC in the range that was tested in our assay. We proved that it is possible to gradually influence enzyme activity with help of our software. Another 11 mutants, as well as the wildtype ß-lactamase could grow under all conditions. Interestingly, only half of the variants with high ß-lactamase activity (6 of 12), were single mutants, whereas the remaining five variants had two or three mutations. Within this set of mutations, M67G and P164G/H are very prominent. These exchanges don’t have drastic effects on the enzyme activity. However these mutations appear also in variants with weak or no activity.
As a result, we decided to perform a second test for these candidates with higher antibiotic concentrations. The three highest carbenicillin concentrations of the first data set were included and the range was extended to a maximum concentration of 19.2 mg/ml. While several candidates turned out to have a weaker activity than the wildtype protein, five of them showed improved properties. The two best candidates could even grow at 19.2 mg/ml. The variants were contained one point mutation each, E102F and M67G. These most benefitial mutations, appear in many of our better candidates as well, which underlines there functionality.

Results - Software
We calculated a MIC-score from the measured data points for all candidates, by first applying a threshold on the measured relative \(OD_{600}\) at 0.08. As the \(OD_{600}\) was measured in a plate reader it can only be seen as relative measure of growth. Thus, we consider any \(OD_{600}\) below 0.08 as inhibited (0) and higher ODs as growing (1). From the thresholded values, we then calculated the MIC-score as the number of consecutive observed data points until the first carbenicillin concentration where the \(OD_{600}\) fell below 0.08. Next, the DeeProtein scores were averaged among the respective MIC-score intervals and the mean DeeProtein score was plotted against the MIC of carbenicillin for all double mutants. The average DeeProtein score correlates with the MIC with an correlation coefficient of 0.6 as displayed in fig 4.
Discussion
In course of the \(\beta\)-lactamase subproject we set the DeeProtein classification score in correlation to the MIC as a measure for enzyme activity. As we obtained a positive correlation, we further demonstrate, that by application of the AiGEM software suite it is possible to gradually modulate enzyme activity in \(\beta\)-Lactamases.Based on the mutations suggested by GAIA for postitive and negative evolution, we generated a set of mutants spanning the whole spectrum of activity. We obtained catalytically dead candidates as well as many proteins with intermediate activity. Most importantly however we also obtained a set of five improved variants, some of them exceeding the wildtype MIC by far. As our experimental results are in correspondence to the averaged DeeProtein classification scores for each MIC-score bin, we state that the scores of the underlying DeeProtein model can be applied as a measure for activity in single and double mutants. However, as all variants were correctly classified as \(\beta\)-lactamases, the assigned scores were all situated in a short intervall. In order to address this issue we incorporated the collected data from the single and double mutations into out training set, forming an integrative cycle of software application, wetlab data collection and software improvement.
The overall set of mutants revealed four different amino acid substitutions that seem to have drastic effects on protein function. D129L and K71W lead to a complete loss of activity. Also in combination with other mutations, no or only weak activity could be detected. M67G and E102F instead, were very prominent in the improved \(beta\)-lactamase subset. The negative effect of K71W can easily be explained. A lysine in the enzymatic pocket is replaced by a tryptophane, disrupting both pocket shape and polarity. In addition the much larger tryptophane inhibits proper access of the substrates. The D129L substitution in contrast, entails an increase of hydrophobicity in that area, potentially leading to the loss of a hydrogen bond. GAIA scored candidates, containing one of these two mutants with the lower scores, underlining its potential to classify protein function.
Reprogrammation of \(\beta\)-Glucuronidase
Motivation
The main objective of the AiGEM software suite is the improvement of directed evolution experiments. As the protein space is tremendous in size and impossible to assert with brute force or random walk methods, a directed evolution tool needs to reduce the combinatory complexity of the protein space. Using DeeProtein, we learned the complex relation between protein sequence and protein function, thus the properties of the thin manifold of functional protein sequences. To harness this learned representation in a generative approach we developed our directed evolution tool GAIA (Genetically Artificially Intelligent Algorithm). GAIA deploys the pre-trained DeeProtein models as scoring function, to assert the class probability of a certain protein function distribution during the evolution process. We hypothesize that by maximization of the class probability of the goal protein function through introduction of amino acid substitutions on the entry sequence its function gets shifted towards the goal term.To demonstrate the capabilities of GAIA we set out to reprogram the E. Coli \(\beta\)-glucuronidase (GUS) towards \(\beta\)-galactosidase (GAL) activity in silico. Sequences were predicted by GAIA and subsequently the enzyme kinetics were asserted in the wet-lab.
Experimental Setup - Software
We prepared our experiments by performing equilibration molecular dynamics simulations on the wildtype and a known variantEquilibration Molecular Dynamics Simulations
In order to assert the effects of the introduced mutations on the \(\beta\)-glucuronidase structure, we performed equilibration molecular dynamics (MD) simulations on the wild-type and the mutated variant introduced by matsumura et al.The apo structure was protonated at pH 6.5 using the modeller class of the openMM library, then the protein was solvated in a cubic box of 10nm with the tip3p water model. The system was then equiibrated for charge with sodium and chloride ions.

Table 1: Calculated RMSD-values after equilibration for the wildtype \(\beta\)-glucuronidase and the Matsumura variant.
As the RMSD-values are comparable there is no devastating effect of the mutations suggested by Matsumura
| Structure | RMSD (Angstroem) |
|---|---|
| Wildtype (3lpg) | 1.412 |
| Matsumura mutant | 1.728 |
Definition of Mutationsites
To facilitate the cloning process in the wetlab and accelerate the production, we limited the mutagnesis on the glucuronidase sequence to three patches (Fig. 6). The defined patches are located around the active site with fragement A and C partly forming the enzymatic pocket. All positions mutated by Matsumura are contained in the defined patches.
Variant Selection
As our resources were limited, it was not feasible for us to synthesize all variants suggested by GAIA. Thus we had to carefully select the variants to be asserted in the wet lab. Matsumura et al.For the sequence prediction we ran GAIA over 2000 generations and constrained the mutation sites to the determined sequence areas. The number of mutations per sequence was limited to 10 with an initial mutation rate of 10. The mutation rate had a linear decay of 1 mutation every 300 generations, to facilitate conversion and backmutations were allowed throughout the whole run.
Next, the predicted variants were manually curated and investigated for steric conflicts. The single amino acid substitutions were selected with respect to the overall mutation frequencies in these postitions.
The resulting set of variants is listed in tab 2.
Table 2: Set of synthesized GUS variants.
We synthesized a set of 7 GUS variants. In order to be able to compare the power of in silico evolution by GAIA the set comprises single amino acid mutations on the positions reported by Matsumura et al
| Variant | Fragment |
|---|---|
| D508V | B |
| D508G | B |
| T509L | B |
| T509A | B |
| K568G | C |
| N556S | C |
| V355M, F357D, N358L, G364L, D508L, T509A, F551G, D553F, F554E, G565L |
A+B+C |
Position 509
A plot of the calculated mutation frequencies at position 509 is depicted in Fig. 7. For position 509 GAIA suggests the insertion of hydrophobic residues. This is in correspondence to the amino acid exchange in position 509 reported by Matsumura et al
Experimental Design - Wet-lab
Cloning of different GUS Variants
An expression plasmid of the wiltype GUS was obtained from AddGene. In this plasmid, GUS is provided under a lac-promoter and a His-tag is attached to the C-terminus of the protein. First, the wildtype GAL was cloned into the same plasmid. Second, different mutants of the glucuronidase were created. With this method, seven different mutants were generated.Expression and Purification
After cloning, one colony of each transformation was inoculated as preculture overnight at 37°C and 220 rpm. The main cultures were inoculated with the respective volume of the overnight cultures to a final density of 0.01 at the starting point. The inducer IPTG was added after cultures reached an OD600nm of 0.6 - 0.8 and were afterwards incubated for 20 hours at 25°C, 220 rpm. Cells were centrifuged and lysed as described in the protocol. Lysates were subjected to the Ni-NTA cartridge and affinity purified throughout several washing steps. Purified proteins were obtained after elution with 500 mM Imidazole solution followed by dialysis. The protein concentration was determind using both, the photospectrometer and a Bradford assay.Activity Assay
To determine the activity of the different mutants, an assay with p-nitrophenyl-galactopyranoside (PNPG) as substrate was set up. PNPG is a perfect substrate for GAL. The enzyme hydrolyzes the p-nitophenyl group from the galactopyranosid. The yellow color of the product can be measured at 420 nm. The enzyme was added to different concentrations of the substrate, ranging from 0.047 mM to 3 mM final conentration and the reaction was followed over time for 45 minutes at 21 °C.With the data, generated from this assay, the kinetic parameters according to Michaelis Menten were calculated via nonlinear regression.
Results
Results - Wet-lab
When the enzymes were cloned and purified, kinetic Assays were performed to reveal their activity. We tested the mutants, as well as both wildtype enzymes, GUS and GAL as controls. As expected GUS showed no enzyme activity at all (Fig. 8, 11). No significant product formation could be measured. Among the inactive proteins were two mutants, which were previously published by Matsumura et al.Table 4: Kinetic Key Values of wildtype GAL (GAL_wt) and the best GUS mutant T509L
| Protein | \(K_{M} [mM]\) | \(K_{cat}[\frac{1}{s}]\) | \(K_{M}/K_{cat}[\frac{1}/{M \cdot min}]\) |
|---|---|---|---|
| Gal_wt | 0.3466 | 49.38 | 8.5E6 |
| GUS_T509L | 0.1834 | 25.02 | 8.1E6 |


Discussion
With help of our AiGEM software suite we successfully reprogrammed a \(\beta\)-glucuronidase (GUS) variant towards \(\beta\)-galactosidase (GAL) activity. We ran equilibration molecular dynamics simulations on the wildtype and the variants reported by Matsumura et al.The sequences suggested by GAIA were subsequently curated manually in order to select single substitution variants. The selection was based on the mutation frequencies over all 2000 generations and an additional assertion of steric conflicts in PyMOL.
The single amino acid substitution T509L was suggested by GAIA with the highest frequency in that position (see Fig. 7) and selected based on the substitution frequency. The mutant T509L displayed a significantly higher activity compared to all other asserted variants, including the variant T509A reported by Matsumura
We asserted the kinects of the T509L variant in a colorimetric assay and compared it to the wildtype GAL and GUS. The mutant had a \(K_{cat}\) of \(25.02 \frac{1}{s}\) and a \(K_{M}\) of \(0.1834 mM\). This is not only significantly higher than the tested wildtype GUS, which lacked any activity, but also close to the activity of the wildtype GAL. We thus state that with the help of the AiGEM software suite, we were able to reprogram a \(\beta\) glucuronidase towards decent \(\beta\) galactosidase function fully in silico.
Under our experimental conditions none of the variants reported by Matsumura displayed any significant activity. The reasons for this oberservation could lay in the different experimental conditions, differing in buffer, temperature and substrate concentration. Further Matsumura reported a maximum increase of activity of 2 log-scales compared to the wildtype for all their single amino acid substitutions. However such a slight increase in activity is immeasurable under our experimental conditions.
We demonstrated the capabilities of the AiGEM software suite in real world application in functionality transfer by fully in silico evolution of \(\beta\)-glucuronidases. However this very specific functionality transfer between closely related enzymes is only the first step on the path towards a universal in silico evolution tool. We began taking next steps by incorporating the data collected in the wetlab in the training set for our model. For a comprehensive, universal approach however much more data is needed. With automated directed evolution experiments becoming more easily applicable and more common, we hope this shortage in data will be overcome in close future.
Appendix
Table 1: Selected single and double mutants proposed by GAIA. Of the pool of proposed \(\beta\)-lactamase sequences we selected 9 single and 16 double mutations for wet-lab validation.
| Mutation | Fragment | Classification_score |
| G236L | F | 0.56584185 |
| G216C_P217F | E | 0.56683183 |
| L218D | E | 0.56554008 |
| L167G_P164L | D | 0.56678349 |
| P164G | D | 0.56673431 |
| P164H | D | 0.56748658 |
| D129L_N130I | C | 0.56734717 |
| D129L | C | 0.56697899 |
| E102F | B | 0.56683093 |
| Y103D | B | 0.56666845 |
| K71W | A | 0.56605697 |
| M67G | A | 0.56762165 |
| M67G_F70G | A | 0.56777865 |
| K71W_G236L | A+F | 0.56503928 |
| M67G_P164G | A+D | 0.5675621 |
| M67G_P164H | A+D | 0.56818455 |
| E102F_P164H | B+D | 0.56749099 |
| E102F_P164G | B+D | 0.56676418 |
| E102F_G236L | B+F | 0.5658384 |
| E102F_M67G | B+A | 0.56763196 |
| D129L_P164G | C+D | 0.56688529 |
| D129L_M67G | C+A | 0.56781197 |
| D129L_L218L | C+E | 0.56570756 |
| L218D_P164G | E+D | 0.56537378 |
| L218D_K71W | E+A | 0.56467879 |
| WT | None | 0.56685823 |
| WT | None | 0.56685823 |