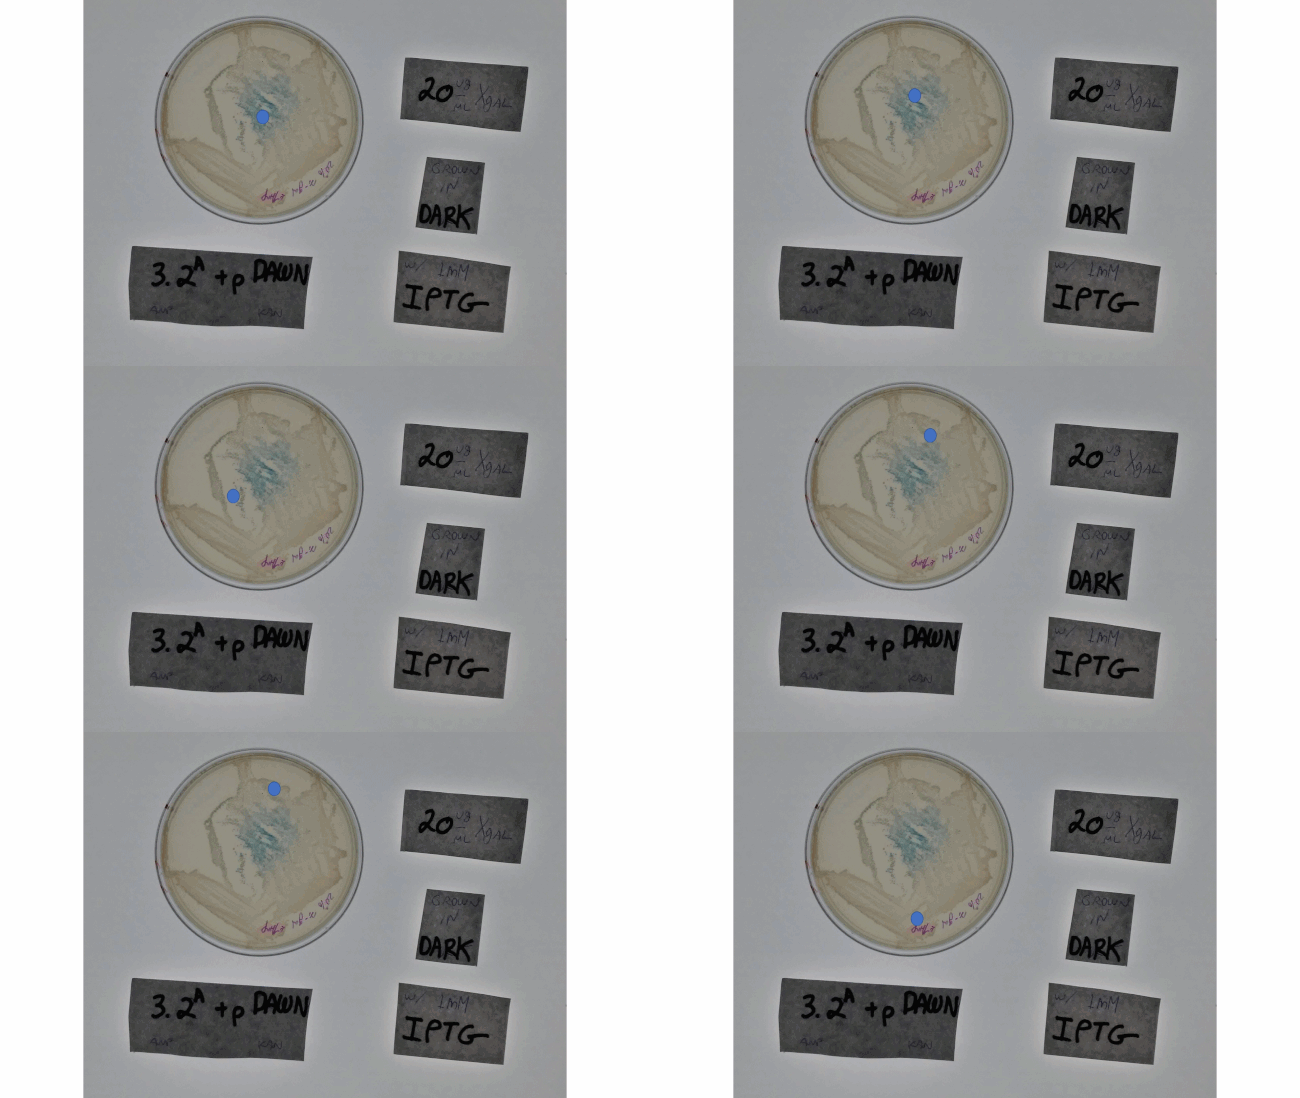
Figure1
(Figure1)Shows the plating of K2268005 grown in the dark where the blue indicator shows the direction of plating. The center had the highest expression of LacZ suggesting that rate of cell growth is the highest at the center and rate of cell growth towards the edge of the plate is lower. The cell was induced with 1mM of IPTG in 20 ɥg/ɥl of X-gal.
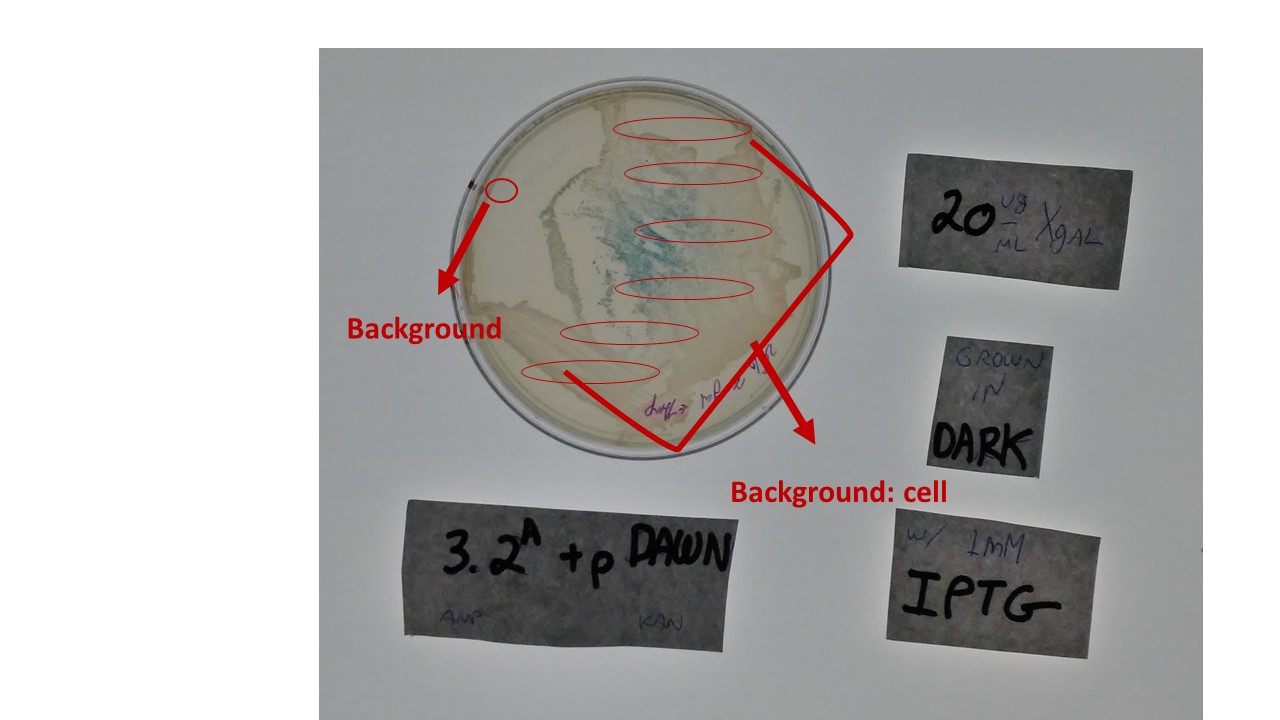
Figure2
(Figure2)Shows the ImageJ analysis for the average expression level. Each “cell” is a ratio of blue to gray and expression level was found by taking the ratio of the background to the cell.
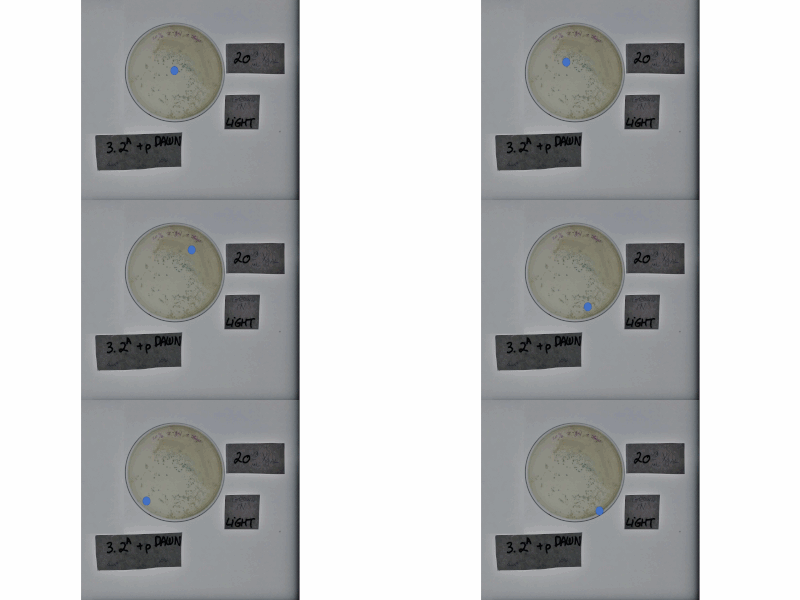
Figure3
(Figure3)Shows the plating of K2268005 grown in the light where the blue indicator shows the direction of plating. The center had the highest expression of LacZ suggesting that rate of cell growth is the highest at the center and rate of cell growth towards the edge of the plate is lower. The cell was induced with 1mM of IPTG in 20 ɥg/ɥl of X-gal.
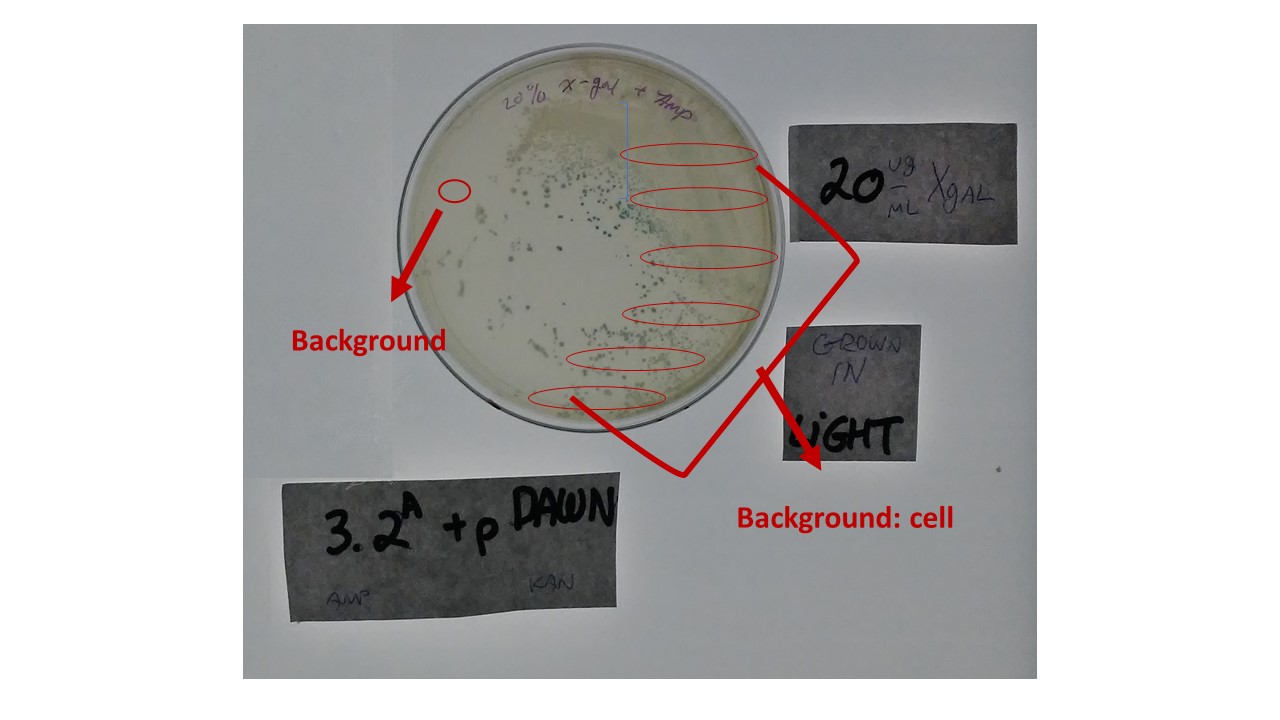
Figure4
(Figure4)Shows the ImageJ analysis for the average expression level. Each “cell” is a ratio of blue to gray and expression level was found by taking the ratio of the background to the cell.
Figure5
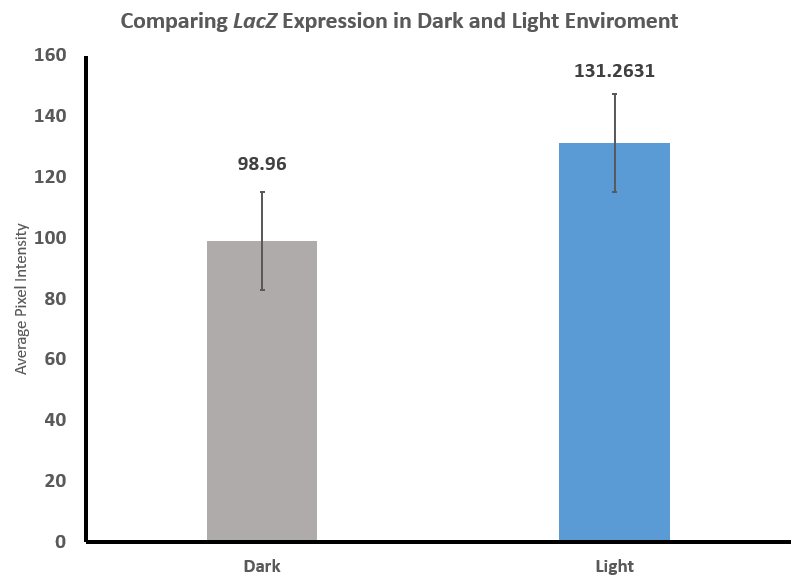
(Figure5)Shows that there is a significant difference in expression level between K2268005 grown in light and K2268005 grown in dark with significantly higher expression in K2268005 grown in light, p<.001. Data analysis was done by comparing the mean expression level of figure 2 and figure 4 with GraphPad Software.
Figure6
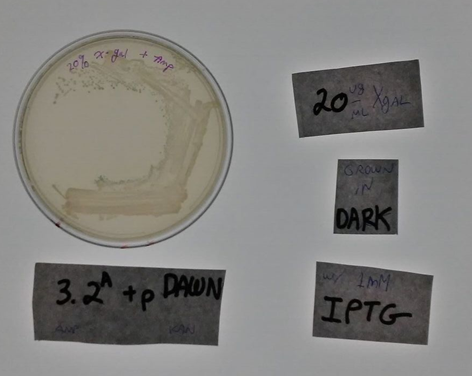
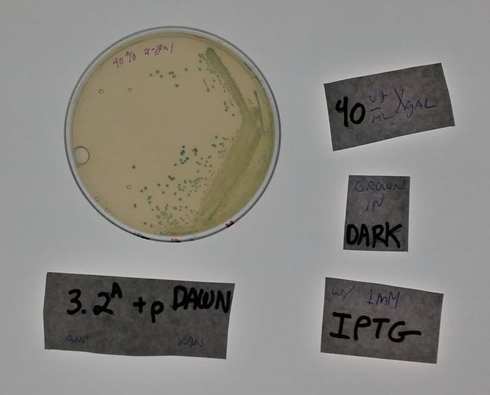
(figure 6) shows that increasing x-gal from 20 ɥg/ɥl to 40 ɥg/ɥl showed a noticeable increase in LacZ expression for K2268005. Increased expression level shows that LacI inhibition is not strong and that LacZ expression is coming from the plasmid backbone of J04550.


