Team:Grenoble-Alpes/LabBook
LabBook
 Facing back to the Etendard glacier, in between the peaks of Maurienne and the ones of Oisan.
 Credits: Estelle Vincent


STEP 1 : TARGET PREPARATION
The first rate-limiting step in the detection of Vibrio Cholerae is the extraction of its DNA. To this aim, the bacteria has been deeply studied, as well as the current DNA extraction techniques.
1. Vibrio Cholerae
1.1 Classification & Generalities
| Domain | Bacteria |
|---|---|
| Phylum | Proteobacteria |
| Class | Gammaproteobacteria |
| Order | Vibrionales |
| Family | Vibrionacea |
| Genus | Vibrio |
| Species | Vibrio cholerae |
V.Cholerae is a thin gram-negative proteobacterium that has a flagellum which gives it mobility [2]. This bacteria is responsible of cholera disease, causing severe contagious epidemia. This bacteria use to grow in basic conditions (Optimal growth pH : 9) [1] with 1-3% NaCl in liquid or solid mediums [3].
1.2 Growth in laboratory
Aeroanerobic bacteria grown on conventional media. Optimum growth in medium with 1 to 3% NaCl pH 9, in liquid media (Colonies in 3-4 h at the surface) or in solid media (colonies in 8-10 hours). The bacterium can also grow on bile salt media. According to these characteristics, alkaline peptone water pH 8.6 3% NaCl can be used as an enrichment medium as well as an alkaline agar pH 9. Colonies are 2 to 3 mm in diameter and are smooth, Flat and transparent. [3]
1.3 Tanks and contamination
Main V.Cholerae tanks are humans and dirty water, it seems that global warming is creating favorable conditions to this bacillus [4]. Even if there are many kinds of this bacteria, only 2 serogroups are directly responsible of Cholera: O1 and O139.
Human transmission is linked to inappropriate access to clear water. This bacteria can survive more than 15 days in water. Contaminations are also possible with contaminated food like vegetables or fishes, The infectious dose is between 106 and 1011 vibrios ingested [5]. The infectious dose depends on gastric acidity (the lower the acidity, the fewer vibrios required to cause infection)[6]
1.4 Physiopathology & Virulence
Cholera is a very virulent disease that can cause severe acute watery diarrhea. The bacillus can be found in patient’s stools for 1 to 10 days after infection (106 to 108 bacillus/mL [3], [5]) and is disposed of in the environment where it can potentially infect other people. An untreated choleric person would produce 10 - 20 liters of diarrhea a day [7]. The cholera toxin (CTX) is an oligomeric complex made up of six protein subunits responsible to the symptoms. Once inside the cell, the A1 subunit is freed to bind with a human partner protein : Arf6 [8]. This bound exposes its active site, allowing it to ribosylate the Gs alpha subunit of G protein. This results in constant cAMP production, which leads to the secretion of water, sodium, potassium, and bicarbonate into the lumen of the small intestine and rapid dehydration.
A healthy human feces contains 1012 bacterias per grams, more than 400 different species can be found [3]. V.Cholera is more in patient’s feces than other bacterias [3] [9].
The gene encoding the cholera toxin was introduced into V.Cholerae by horizontal gene transfer. Virulent strains of V.Cholerae carry a variant of a bacteriophage called CTXφ[10].

Figure 1: Infection of Vibrio cholera by the CTX bacteriophage
2. DNA Extraction
In order to obtain the target, the vibrio DNA must be extracted.
2.1 Laboratory extraction
Nowadays, DNA preparations are widely used because of their easy using. A lot of suppliers proposes kits (NEB, QIAGEN…). Kits allow to extract 50 ug to 10 mg of DNA thanks to different protocols/materials (Miniprep, Midiprep, Maxiprep, Megaprep and Gigaprep [11]) and different kind of polynucleotides can be extracted: Plasmidic DNA, RNA or even genomic DNA for instance. Protocols can also be more or less fast, depending on the the supplier’s technology.
2.2 Paper-based technology
A famous field of research consists in paper-based extraction technology. It permits low-costs diagnosis. The point is that these technologies permit easier way to perform sample preparation. For example, it is possible to make an automated DNA extraction from the human whole blood in only 7 minutes [12].
Some scientists also developed an automated way to proceed DNA extraction : it combined magnetic beads, paper, stepper actuators and a micro-computer called Arduino. [13]
Thanks to that technology and using 96 well plates, it is possible to target the apicoplast genome for malaria diagnosis [14].
2.3 Isothermal amplification - LAMP
Loop mediated isothermal amplification (LAMP) is an isothermal technique for the amplification of DNA [15] widely used in point-of care diagnosis because it is cheap and simple[16] [17]. The sensitivity can reach 92% [17] making it a serious technology for malaria diagnosis.
Combined with paper-based technologies, it is possible to develop low-coast paperfluidic molecular diagnostic chip that can extract, amplify and detect DNA from clinical samples in less than 1 hour even in resource-limited settings [18].
3. Vibrio Cholerae extraction
3.1 Vibrio Cholerae sensitivity
To lyse bacteria, several disinfection solutions were prepared, such as 2-5% phenol ; 1% sodium hypochlorite ; 4% formaldehyde ; 2% glutaraldehyde ; 70% ethanol ; 70% propanol ; peracetic acid To 2%, to the hydrogen peroxide to 3-6% and to the iodine to 0.16% [19]. As mentioned before, V.cholerae is not supposed to survive in acid mediums [6]. Another possibility to kill it is to create a thermal shock (0°C)[20]
3.2 Lysis buffer
After many intern discussions, DNA amplifications were dropped because the bacteria is overexpressed in the sample. Lysis buffer is used to extract DNA from bacterias. It contains Urea 4M and DNAse inhibitors. Urea 4M allows a lysis efficiency of 90% in less than 10 minutes [21], which is fast and interesting given the fact that V.cholerae is overrepresented in patient’s faeces [3] [5].
3.3 Protocols and Results
Late exponential phase cells of V.Cholera will be harvested and resuspended in 20 mL of 4 M-urea with DNAse inhibitors. The following step is an incubation of 10 min at 24°C, by which time more than 90% lysis occurs. The only difference is that we extracted the DNA from E.Coli instead of V.Cholerae for security measures.
The following protocols (Table 2) has been done in laboratory in order to check if the centrifugation can be removed during the DNA extraction. Two different elution buffers are compared.
| Test A Silica column + TE elution buffer | Test B Silica column + elution with distilled water |
|---|---|
| Insert 20uL of PK in a 1,5mL eppendorf | Insert 20uL of PK in a 1,5mL eppendorf |
| Add 200 uL of sample + 200 uL of PBS 1X | Add 200 uL of sample + 200 uL of PBS 1X |
| Add 200 uL of AL buffer + shake for 15 sec | Add 200 uL of AL buffer + shake for 15 sec |
| Incubate for 20 min at RT | Incubate for 20 min at RT |
| Add 200 uL of 96% ethanol + shake for 15 sec | Add 200 uL of 96% ethanol + shake for 15 sec |
| Drop the mix in the column Elute (using the piston) → Discard the eluant | Drop the mix in the column Elute (using the piston) → Discard the eluant |
| Add 500 uL of AW1 buffer Elute (using the piston) → Discard the eluant | Add 500 uL of AW1 buffer Elute (using the piston) → Discard the eluant |
| Add 500 uL of AW2 buffer Elute (using the piston) → Discard the eluant | Add 500 uL of AW2 buffer Elute (using the piston) → Discard the eluant |
| Add 200 uL of TE buffer | Add 200 uL of distilled water |
| Incubate 1 min Elute (using the piston) | Incubate 1 min Elute (using the piston) |
The use of the piston is the most important step. Indeed, it enables to replace the centrifugation and also to reduce the extraction time. The piston needs to have exactly the same diameter than the column. It is inserted in the column and pushed to exert a pressure on the mix, allowing the liquid to pass through the silica.

Figure 2: Explanatory scheme of the use of the piston during the experience
NanoDrop measures have been done, giving the following results :
| Test A | Test B |
|---|---|
| 28.8 | 19 |
Finally, extracting genomic DNA without centrifugation is possible. The concentration is higher when the elution is done with the TE buffer. This concentration range allows the pursuit of the experience.
3.4 Preparation of the target
The next step is the cutting of the Vibrio DNA by Alu I: one hour at 37°C in CutSmart Buffer. Then a denaturation is done at 73°C. The target now ready to be detected and the next step, the detector activation, can occur.
References
[1] http://www.biologiemarine.com/micro/nutrition.htm
[2] http://www.futura-sciences.com/sante/definitions/medecine-vibrio-cholerae-7812/
[3] http://www.ftlpo.net/dossiers/2005/diarrhees/diarrhees.pdf
[4] http://www.who.int/mediacentre/factsheets/fs107/fr/
[5] http://www.microbes-edu.org/etudiant/vibrio.html
[6] http://www.phac-aspc.gc.ca/lab-bio/res/psds-ftss/vibrio-cholerae-fra.php
[7] http://www.thelancet.com/journals/lancet/article/PIIS0140-6736(03)15328-7/fulltext
[8] http://science.sciencemag.org/content/309/5737/1093
[9] https://www.ncbi.nlm.nih.gov/pubmed/11092860
[10] https://books.google.fr/books?id=NC0JBAAAQBAJ&dq=changement+de+flore+intestinale+cholera&hl=fr
[11] http://onlinelibrary.wiley.com/doi/10.1002/bit.26282/full
[12] https://www.ncbi.nlm.nih.gov/pubmed/25070548
[13] https://www.ncbi.nlm.nih.gov/pubmed/26409535
[14] https://www.ncbi.nlm.nih.gov/pubmed/26450599
[15] https://www.ncbi.nlm.nih.gov/pmc/articles/PMC102748/
[16] https://www.caister.com/water-microbiology
[17] https://www.ncbi.nlm.nih.gov/pubmed/26450599
[18] https://www.ncbi.nlm.nih.gov/pubmed/26785636
[19] https://www.amazon.com/Laboratory-acquired-Infections-4Ed-Incidence-Prevention/dp/0750640235
[20] http://www.microbiologyresearch.org/docserver/fulltext/micro/87/1/mic-87-1-163.pdfexpires=1503824537&id=id&accname=guest&checksum=0ACED7A018B281DB4D4A44C1D91ED38F
[21] http://mic.microbiologyresearch.org/content/journal/micro/10.1099/00221287-130-8-2027
STEP 2 : CONSTRUCTION OF THE PLASMID DETECTOR
1. Design of the detector in silico
1.1 The target
The bioinformatic work aimed to find a specific Vibrio cholerae sequence to detect. First, it was necessary to study Vibrio cholerae (Vc) pathogenicity. The known epidemic strains [1] O1 (GeneBank : KF664566.1) and O139 (AF302794.1) sequences available on PubMed have been deeply studied. Importantly, Vc’s pathogenicity is premised on the integration of a bacteriophage sequence - bacteriophage CTX - in Vc’s genome [2]. Indeed, the integrated sequence contains genes for toxins, responsible for symptoms of cholera disease. Based on the actual knowledge [3], the target has been chosen inside CTX’s genome, and more precisely within the non-pathogenic genes of CTX (i.e. genes with roles in the reproduction or in the metabolism of the bacteriophage). One requirement was to detect something specific to the bacteriophage CTX. After a blast of all CTX’s genes, genes with low similarity to other organisms have been retained. Then the target had to be quite small (less than 100 bp) as well as being cut with a single enzyme (ideally blunt end). Finally, the target was found in RstA gene (1080bp, implicated in CTX DNA integration and replication [3]), between nucleotide 726 and nucleotide 765.
A.

B.

C.

Figure 1: Choice of a target specific to bacteriophage CTX. A. Blast of RstA gene. B. Sequence of the chosen target: 39bp sequence in RstA gene of bacteriophage CTX. C. Blast of the sequence target.
1.2 The probe
Two versions of the probe has been designed. The first (Version 1) permits a cloning with a single restriction enzyme EcoRI (Figure 2).

Figure 2: Designed probe, first version, aiming to receive the target by perfect complementarity. In purple: EcoR1 sites, necessary for probe insertion in the backbone; in orange: Nb.btsI and Nt.bspQ1 sites; in blue: BmtI and BglII sites.
The insertion strategy was changed afterall in order to facilitate the cloning.
The probe has been imagined based on the genius system of Cork Ireland 2015 team and all the data furnished by New England Biolabs (NEB) website. It is flanked with two EcoRI sites at each end for its insertion in a plasmid backbone. It also contains :

Figure 3: Scheme of the results of the digestions necessary to activate the probe to receive the target. N= whatever nucleotide.
1.3 The plasmid backbone
The plasmid carrying the detector probe has to meet at least the following conditions:
2. Construction of the detector in practice

Figure 4: Schematic overview of the construction of the DNA detector. The system has been inspired by iGEM Cork Ireland 2015 BaseHunter.
2.1 Tests for the choice of the plasmid backbone
2.1.1 Screening of DNA Distribution kit 2017
So, among all the biobricks proposed in iGEM 2017 kit, plasmids were screened in the following precise criteria.

Figure 5: Scheme of the “all-in-one” biobrick, delimited by 4 specific enzymes
2.1.2 Biobrick candidates & tests
A serie of biobricks with constitutive and inducible promoters was selected. Even though LacI induction appeared to be a better choice in regards to its well-documentation, biobricks were tested with either constitutive promoter or LacI inducible promoter.
| BBa_K608014 | BBa_K608017 | BBa_J04450 | BBa_K801100 |
|---|---|---|---|
| Constitutive promoter | Constitutive promoter | Inducible promoter (IPTG) | Inducible promoter (IPTG) |
For the constitutive promoters, biobricks designed by iGEM Freiburg 2011 were chosen. Based on their research, BBa_K608017 and BBa_K608014 seemed to be the most appropriate parts in our case because of their high level of fluorescence. Concerning the inducible ones, BBa_J04450 was selected for its consequent documentation and BBa_K801100 chosen randomly among the list of biobricks producing RFP.

Figure 6: Bacterial Pellets of DH5ɑ transformed with BBa_K801100 and incubated with 7 different IPTG concentrations: 0, 0.13, 0.25, 0.5, 1, 2 and 4 mM. Red fluorescence is observable as soon as there is some IPTG under natural light (top) and UV light (bottom)
These results drove the choice to biobricks having IPTG inducible promoters for mRFP1: BBa_J04450 and BBa_K801100, for which emission of red fluorescence is quite fast and strong.
- one EcoR1 site, to insert the probe
- no BglII and BmtI restriction sites, necessary for the activation of the probe
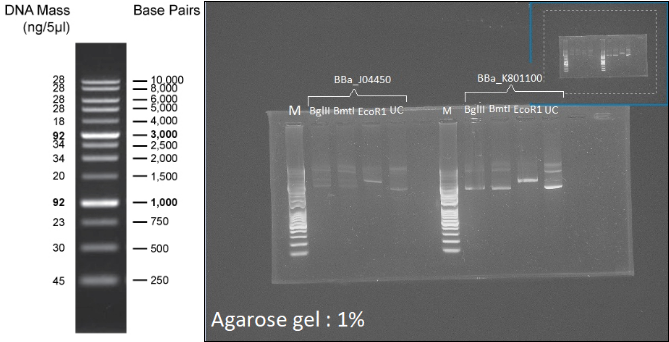
Figure 7: Left: 1kb Plus DNA Ladder. Right: Digestion profile of BBa_J04450 and BBa_K801100 with BmtI, BglII and EcoR1. UC=uncut.
In both cases, no digestion with BglII and BmtI is observable (3 forms, like the uncut well), and one cut is visible with EcoR1 (1 band:linearization), so the two plasmids can be used as backbone for the probe.
Experiment has been designed the following way: 2 cultures of DH5ɑ transformed with J04450 and 2 cultures transformed with K801100, one with 1mM IPTG, the other not. Bacteria grew overday at 37°C under agitation.
The bacterial count and the mean fluorescence intensity have been measured in parallel by flow cytometry every 20 minutes for 5 hours, with 15µL sample of each culture.

Figure 8: Evolution of the ratio mRFP1 fluorescence intensity, in J04450 and K801100 transformed DH5a.
This experiment highlighs the role of IPTG, at least from 180 minutes after induction. IPTG appeared to be important in the detection because it triggers a shorter rise of the fluorescence.
Beside, no notable difference is observed between the fluorescence of J04450 and K801100 (neither in the intensity neither in the time of production).
2.1.3 Appropriate backbone: BBa_J04450
Finally, BBa_J04450 was chosen as original backbone.
This iGEM part enables users to produce the reporter mRFP1, a fluorophore which is an engineered mutant of red fluorescent protein from Discosoma striata. Its reporter is LacI sensitive and can be induced with IPTG.

Figure 9: Map of BBa_J04450, furnished by iGEM parts website
2.2 Insertion of the probe
Our first detector was delivered by Integrated DNA Technologies (figure 10A).
The probe is amplified by PCR, digested with EcoR1 to remove the primers and delimit the probe with the proper sites, and finally inserted in J04450 plasmid.
All the following experiments have been made on this probe, inserted thanks to EcoR1 site.
Nevertheless, the official detector part sent to iGEM carries a second version of the probe (figure 10B), which has been inserted between EcoR1 and Xba1. The first reason is that insertion between two different restriction sites is much easier (the problem of self-ligation is avoided). Secondly, insertion between EcoR1 and Xba1 allows the compatibility with RFC10, the most used way of insertion inside biobrick.
Second probe functioning is supposed to be the same than first version though.
A

B

Figure 10: Sequence of the probe. A. Sequence of the first version of the probe provided by IDT. B. Sequence of the second version of the probe provided by Sigma&Aldrich. In yellow: primers for amplification; in purple: EcoR1 and XbaI sites respectively, necessary for probe insertion in the backbone; in orange: nicking enzymes sites Nb.btsI and Nt.bspQ1; in blue: BmtI and BglII sites.
2.2.1 First attempt: mass ratio
Cloning with an unique enzyme is quite difficult. Indeed, the vector tends to self-ligate, preventing then the insertion of the probe. To avoid self-ligation, the vector was dephosphorylated (“Rapid & dephos Ligation” kit from Roche industry). Then, the probe was inserted with a mass ratio insert:vector of 3:1, and ligate thanks to T4 DNA Ligase.
The product of the ligation was then transformed in competent DH5ɑ. The day after, the control plate (digested vector without insert) showed a notable number of colonies, suggesting a large number of self-ligated plasmids. 10 colonies have been randomly picked up and cultivated. Then the DNA was extracted and digested with EcoRI, in order to visualize those with the probe (expected at 96pb).

Figure 11: Left: 1kb Plus DNA Ladder. Right: Agarose gel 2% of the digested plasmids extracted from the bacteria transformed with the product of the first insertion. M=1 kb Opti DNA-Marker. N.D= Plasmid J04450 Non digested. Wells 1 to 10 = insert:vector mass ratio 3:1. P.ND = Probe non digested
None of the 10 colonies that were screened showed any insert. The vector J04450 probably closed on itself without the probe, before being transformed.
2.2.2 Second attempt: molar ratios
To increase the chances of success, different molar ratios insert:vector were tested: 1:1, 3:1 and 7:1. Each one of them was calculated thanks to NEBBioCalculator. The end of the protocol was the same than the first assay.

Figure 12: Left: 1kb Plus DNA Ladder. Right: Agarose gel 2% of the digested plasmids extracted from the bacteria transformed with the product of the second insertion. M=1 kb Opti DNA-Marker. Wells 1, 6 and 9= insert:vector molar ratio 1:1. Wells 12, 15 and 17:= ratio 3:1. Wells 21, 23 and 27= ratio 7:1. Pl ND = Plasmid J04450 non digested. P.D= Probe digested.
Yet, even with these new molar ratios insert:vector, same results were obtained: no probe was inserted because of the same self-ligation issue.
2.2.3 Third attempt and success: Multiple dephosphorylations
As the phosphatase efficiency was unsure, the next experiments were realized with a new phosphatase than the kit’s : a calf intestinal alkaline phosphatase (CIAP).
To ensure the plasmid to stop close on itself, 3 successive dephosphorylations of EcoRI digested plasmid J04450 were done.
For each dephosphorylation step, two transformations were made: one with digested plasmid X time dephosphorylated ; the other with the same that underwent a ligation step (without insert, just the enzyme).
The “3 times dephosphorylated” was satisfying because low number of colonies appeared on the plates with or without ligase comparing to plate with undigested plasmid, meaning the plasmid lose ability to close by itself.
Thus, the plasmid “3 times dephosphorylated” was used for the probe insertion. Again, different molar ratios were tested: 1:1, 3:1, 7:1 and 10:1, like in the second essay. A screening of 12 colonies was done to check if some had incorporated a plasmid with the probe.

Figure 13: Left: 1kb Plus DNA Ladder. Right: Agarose gel 2% of the digested plasmids extracted from the bacteria transformed with the product of the second insertion. M=1 kb Opti DNA-Marker. Wells A,B and C= molar ratio insert:vector 1:1. Wells D,E and F= ratio 3:1. Wells G,H and I= ratio 7:1. Wells J,K and L= ratio 10:1.
Wells B and C (molar ratio insert:vector of 1:1 for both) displayed the presence of the probe (96pb, red arrows) !
B and C transformed bacteria were cultivated to amplify the plasmid J04450+probe detector.
2.2.4 BBa_K2299000

Figure 14: Schematic overview of the construction of the DNA detector. The system has been inspired by iGEM Cork Ireland 2015 BaseHunter. Here is represented the second version of the probe, with EcoRI and XbaI insertion
The detector that has been sent to iGEM as the part BBa_K2299000 is the one containing the second version of the probe, i.e. the version inserted thanks to EcoR1 and Xba1 site. This insertion appeared to be much easier because self-ligation of the plasmid backbone could not happen anymore, and all the phosphorylation steps could be skip.
2.3 Detection of the target
2.3.1 Transformation test
The final detector being extracted, the probe had to be activated before detection.
Activation corresponds to a quadruple digestion of the probe: BmtI, BglII, Nb.bspQI and Nt.btsI successively. This step is essential to open a single-strand window in the detector probe, which is then able to welcome the target (see figure 4). If there is any non digested plasmid, it will be transformed and considered as false positive, reducing the specificity of the analysis.
Detector was digested 4 times and cleaned up (PureLink Quick PCR Purification Kit by Thermo Fisher Scientific) to remove the top strand of the probe. Efficiency of our detector was check with pure target.

Figure 15: Plates with colonies of DH5a transformed with detector plasmid+target. A-1= mass ratio detector:target 1:0, 4 colonies. B-1= ratio 1:1, 100 colonies. C-1= ratio 1:2, 200 colonies. A-2, B-2, C-2 are zooms of A-1, B-1 and C-1 plates.
Results lead to conclude that the detector is efficient. The number of colonies for plate without target (A) is 4, while more than 100 colonies are present when the target is added in excess (C), meaning the detector succeeded to bind the target, with a low number of false positive.
About those false positive colonies, the main hypothesis is that BmtI and BglII did not digest all the detector (J04450+probe). Maybe a use of high-fidelity (HF) enzymes would be profitable because they have the advantage to be exempt from star activities, giving freedom to let them digest longer.
2.3.2 Confirmation by sequencing
Since bacterial transformation does not display full indications of what really happened, sequencing was done to verify the binding of the single strain target to the detector. Two colonies of each previous plate (figure 15) were picked up and cultivated, to extract DNA, which is then sequenced thanks to a unique forward primer (VF2 - see figure 9) that binds close to the insertion site of the target.
A.
| Sequenced samples name | A | B | C | D | E | F |
|---|---|---|---|---|---|---|
| Original plate (mass ratio target:detector corresponding) | A (0:1) | B (1:1) | C (2:1) | |||
| Alignment | 100% with undigested probe | No alignment (neither with the target sequence nor the probe’s) | Alignment with the target sequence | |||
B.

C.

Figure 16: A. Name and origin of the sample sequenced and result of the alignments. B. Details of the alignment between sample A sequence (subject) and undigested probe sequence (query) C. Details of the alignment of sample E sequence (subject) with the target sequence (query).
Sequencing displays that the detector is definitely able to bind to the target (perfect alignment with the target sequence for samples D, E and F).
Two reasons explain the presence of false positive colonies (in plate A: no target). The first is the one that was expected, i.e. the probe was badly digested, explaining that it could not receive the target but was transformed and read anyway, because the detector was still circular (sample A). The second reason comes from the previous step: the probe insertion.
During the screening (Figure 13), two colonies have probably been mistakenly selected. One having the vector with the insert and the other corresponding to a vector without insert. (B and C samples)
2.3.3 Evaluation of sensitivity and specificity
An important aspect in diagnosis is the estimation of sensitivity and specificity. These two parameters estimate the capacity of a system to deliver a result with low false positive cases (positive result while the patient is not ill) and low false negative cases (negative result while the individual is actually sick).
A.

B.
| Detector amount (ng) | 100 | |||||
|---|---|---|---|---|---|---|
| Target amount (ng) | 0 | 6 | 13 | 25 | 50 | 100 |
| Number of colonies | 17 | 55 | ~190-200 | ~70 | ~300-400 | >400 |
Figure 17: A. Colonies appearing after transformation with detector+target with different mass ratio, observation under UV light. From left to right, transformed bacteria with mass ratio target:detector 0:100, 6:100, 13:100, 25:100, 50:100, 100:100. Bottom line is a zoom of the top one. B. Counting of colonies from photo A.
Sensitivity can be appreciated by the following observations :
no test with target showed a lower number of CFU than control with 0ng target. Hence, there is a notable difference in the number of colonies between the presence and the absence of the target.
notable difference is observed with a low DNA target quantity (6ng), which is promising in the kit’s conditions, since the extraction part is quite limiting in terms of quantity of DNA. The high amount of bacillus in patient stools is an advantage (106 to 108 bacillus/mL) and 6ng is a reachable amount.
To estimate specificity, i.e. the ability of the detector to identify the positive as such, the detector has been tested with “false target sequences”, more or less homologous to the original targets. To do so, an algorithm was made to give random sequences with 5%, 15%, 25% and 50% randomly modified pairs of nucleotides (length is kept at 39bp).

Figure 18: Algorithm of the “Generator of aleatory sequences”, used for the design of the false sequences more or less homologous to the target, for the testing of the specificity of the detector.
These 50%, 75%, 85%, 95% homologous sequences to the target were tested 7 times. Unfortunately, results were too heterogenous to bring any statistically relevant conclusions. Firstly about the heterogenous number of false positive colonies (there is a possibility that the detector was badly digested and was consequently transformed), secondly because of the number of colonies that was expected to be increasing, and that was not. Indeed, transformation includes a lot of steps with specific parameters, varying a little between each experiment and may explain the lack of reproducibility.
Conclusion
Inspired by the genius of Cork Ireland iGEM 2015 team who designed an amazing DNA detector for Human Papillomavirus, Grenoble 2017 team created a similar biological system to detect cholera’s pathogen and even inserted it inside an innovative portable and cheap kit. The specific target sequence is 39bp long and was found in RstA gene of bacteriophage CTX. The probe has been then designed according to the target sequence, and inserted into an appropriate plasmid backbone that was carrying a fluorescent reporter. This insertion was more complicated than expected: the main conclusions are (i) an insertion of sequence inside a plasmid vector through a unique restriction site requires at least three dephosphorylation steps to avoid self-ligation, (ii) the best ratio insert:vector in that case appeared to be a molar ratio 1:1 (see figure 13) and (iii) an insertion between two different restriction sites [p1] is much easier than one in a unique site. The detector was activated and tested then with the target, with successful results. The few false positives observed are suspected being due to a bad activation of the detector probe prior the contact with the target. Still, there is a notable difference of colonies number when the target is present or not. Evaluation of sensitivity and specificity was also attempted. Sensitivity (proportion of positives that are correctly identified as such) was tested through the counting of transformed bacteria. A notable difference between absence or presence of the target was observed as soon as 6ng of target were in contact with 100ng of detector. However, a sequencing of all colonies would have been more accurate, to insure that the counting was not taking into account false positives. Specificity (proportion of negatives identified as such) brought more issues: test consisted in the evaluation of the detector’s ability to recognize only the original target and not the false sequences more or less homologous. Unfortunately, results were too heterogeneous to draw any conclusions. Importantly, a statistical job would be done for each step of the detector construction. Indeed, it is important to highlight that most of the experiments have been done only once or twice because of the short time slot of the project. So, the detector was successfully built in this one-shot way, nevertheless the process has to be standardized as well as the characterization that has to be completed. Ideally, comparison with a gold standard would be done.
iGEM Grenoble team 2017 built a new biobrick (BBa_K2299000) for which the proof of concept for its ability to detect cholera’s pathogen DNA is working.
References
[1] L. Iyer, J.V. Ivelu and S.D. Puthucheary, Detection of virulence associated genes, haemolysin and protease amongst Vibrio cholerae isolated in Malaysia, Epidemiology & Infection, April 2000, 125, 27–34.
[2] B.M. Davis, K.E. Moyer, E.F. Boyd and M.K. Waldor, Phage Genes but Dysfunctional Phage Genomes, Journal of Bacteriology, Dec. 2000, p. 6992–6998 Vol. 182, No. 24
[3] B.M. David and M.K. Waldor, Filamentous phages linked to virulence of Vibrio Cholerae, Current Opinion in Microbiology, Feb 2003, 6(1):35-42
STEP 3 : DETECTOR AND BACTERIA'S CONSERVATION
SnapLab is designed to be used in countries where weather conditions are a real problem for the conservation of biological materials. Determining the best way for the conservation of the most important parts in the kit, namely the detector (plasmid) and the competent bacteria, was a challenge in the kit’s conditions. In order to transform bacteria with a plasmid, the former needs to be competent. Once the plasmid is inside the microorganism, it will multiply and if stimulated, express its genes. This is the reason why the main goal of all the protocols for competence and drying is to keep the bacteria alive, otherwise the gene expression will be impossible.
1. Conservation of the detector
DNA conservation is very important in different fields of biology. Luckily, this is a relatively stable molecule.
The goal was to find a solution for a long time conservation of the plasmid detector in keeping it functional and with the lowest loss possible. The bacterial strain used was TOP10 E. Coli, and transformations were made with the plasmid BBa_J04450. After DNA amplification and extraction, plasmid was concentrated at 827ng/μL.
Firstly, different concentrations of plasmid (1.5, 3 and 4,5μL) were tested for drying with 0, 2, 3, 4 and 5μL of glycerol 80% in a spectrophotometer cuvette. After 24h, plasmids with glycerol were not dried yet. Technique to dry DNA was changed then, because this one was very time consuming.
Three types of drying have been tested (see figure 1):
- 15 µl of plasmid dried overnight in a spectrophotometer cuvette at room temperature under fume hood
- 15 µl of plasmid dried overnight in an open petri dish under fume hood
- 15 µl of plasmid dried with a Speed Vac for 40 minutes
The different compartments were kept at 27 to 33°C for 35 days and on the 36th day, in order to verify the functionality of the plasmid, TOP10 transformation was done. The plasmid was suspended in 15μL of sterile water. A positive control bacterial transformation was also made with a plasmid that was conserved at -20°C which is the optimal temperature for DNA conservation.

Figure 1: Different types of drying (Spectrophotometer cuvette, Petri dish, Speed-Vac, Control)
The number of colonies obtained was comparable to the positive control. Some loss was shown, nevertheless the number of colonies was important.
Speed-Vac has been chosen as the main technique because this was the fastest way for DNA drying. As a conclusion, using this method, plasmid can be conserved for many weeks at temperatures close to those in real conditions.
2. Conservation of competent bacteria
Conserving competent bacteria is a big challenge in biology. The aim was to find the best way to conserve these bacteria with the minimal use of energy. As it was not possible to put a -80°C chamber in a detection kit, another solution had to be found.
Freeze-drying was chosen as a method for a long time conservation of our competent bacteria. The paper “Process for producing freeze-dried competent cells and use thereof in cloning” written by Efrat Barnea (Jerusalem), Yael Asscher (Mevaseret Zion), Castro Wattad (Jatt Village) and published in June 27th 2002 in United States Patent Application Publication was very helpful for the protocol elaboration.
Escherichia coli JM109 were made competent with CaCl2 100mM, MgCl2 100 mM and a cryoprotector agent added (sucrose at different concentrations, see details below).
The samples were freeze-dried during one night at -50°C and at 0,039mbar using a Labcon lyophilizator (Figure 2). Then they were kept at 0°C for 3 days, and at the 4th day a transformation was made. Positive control for transformation was done also with bacteria that had not been freeze-dried. As before, plasmid BBa_J04450 was used. Results of the experiment are shown figure 3.
In comparing the number of colonies obtained after and before the freeze-drying, conclusion was done that loss in competency was roughly 35%. Thus, the freeze-drying can be used as a way to avoid a -80°C chamber.

Figure 2: Labcon lyophilizator
Figure 3: Transformed JM109 with plasmid which contains RFP gene. On the left - freeze-dried bacteria conserved at 0°C for three days. On the right - positive control transformed JM109 conserved at -80°C.
How to prepare different sucrose concentrations?
In order to obtain different sucrose concentrations, serial dilutions were done.
Final volume of sucrose 100mM of 8mL was the starting point. Sucrose’s molecular mass is 342,3 g/mol. The final concentration expected was 0,1 g/L. Using the mathematical formula m=V*M*C, it was determined that 0,27g of sucrose was needed. So, 0,27g of sucrose was dissolved in 8ml of sterile water.
Serial dilutions are explained in the following table:
| Final concentration sucrose [mM] | 100 | 80 | 60 | 40 | 20 |
|---|---|---|---|---|---|
| Final volume [mL] | 8 | 7 | 6 | 6 | 5 |
| Sterile water [mL] | 8 | 1.4 | 1.5 | 2 | 2.5 |
| Quantity to be taken for the next concentration [mL] | 5.6 | 4.5 | 4 | 2.5 | - |
Solutions were stored at 4°C before utilization.
In order to test at what concentration of the cryoprotector the lyophilized bacteria are still active after resuspension, several bacterial transformations were done. Then fluorescence and number of colonies obtained were studied.
| Concentration of sucrose [mM] | Results bacterial transformation |
|---|---|
| 40 |  |
| 60 |  |
| 80 |  |
| 100 |  |
After comparing the results, conclusion was that using the cryoprotector at concentration of 100mM is the best solution.
Comparison and conclusion
Hanahan protocol (described in the article “Process for producing freeze-dried competent cells and use thereof in cloning”) was also compared with the one using sucrose at 100mM.

Figure 4: On the left – transformation with bacteria freeze-dried following the Hanahan protocol. On the right – transformation with bacteria freeze-dried following the protocol using sucrose previously described
Results of the two transformations lead to the conclusion that the protocol using sucrose as cryoprotector agent is more effective (more colonies were obtained). This is the reason why this protocol was chosen.