(Prototype team page) |
|||
| (24 intermediate revisions by 3 users not shown) | |||
| Line 1: | Line 1: | ||
| − | {{Kingsborough_NY}} | + | {{Template:Kingsborough_NY}} |
| − | + | ||
| + | <h1>Figure1</h1> | ||
| + | [[File:KBCC-MODEL2017-1.jpg|600px|center]] | ||
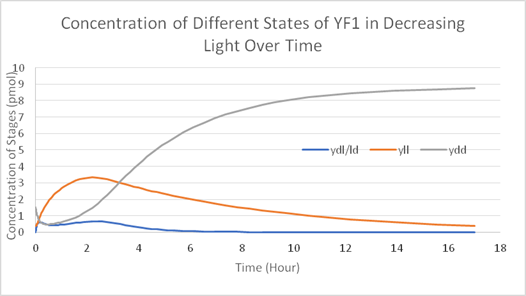
| + | <p>Using Matlab and Simbiology we modelled the stages of YF1 and like Wageningen 2016 iGEM team we modelled the YF1 light sensing protein as described by Möglich et al in the stages of Yll (light) Ydl/ld (transition) and Ydd (dark stage). We used the same mathematical formulas used in Wageningn 2016 iGEM team in describing the different stages of the light sensing protein however we set our parameter in terms of working from a rich light environment to no light. The model suggests that: | ||
| + | </p> | ||
| + | <p>1. The light sensing protein is not strict; all three stages of the YF1 light sensing protein can exist at the same time if some light is introduced. In fact, the light-sensing protein readily converts Ydd and Ydl/ld into Yll in the presence of any light.</p> | ||
| + | <p>2. Given long enough time in a dark environment (over the course of hours) Ydd expression will increase and all the other two stages will convert to Ydd.</P> | ||
| + | <p>3. A second level inhibitor is needed to account for the early possible exposure of light in the lab environment.</p> | ||
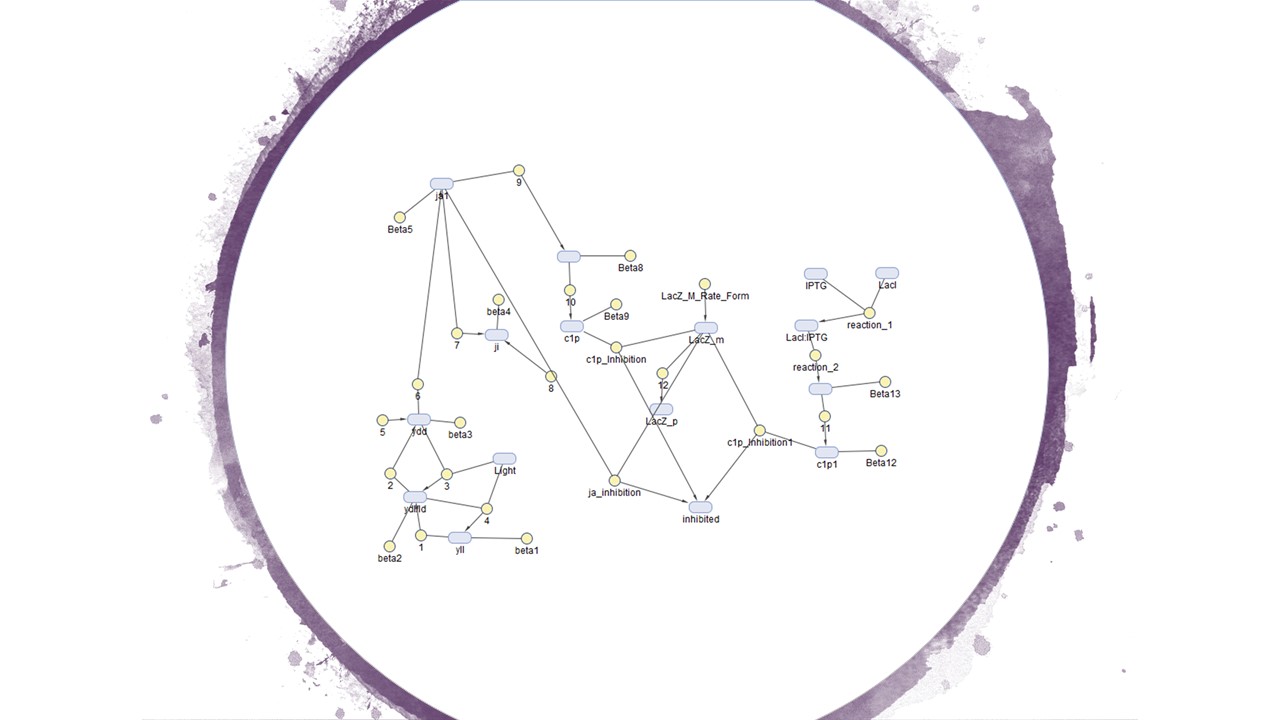
| + | <b>Figure 1 is the calculated model of and Figure 2 is how we designed our system in the Simbiology toolbox.</b> | ||
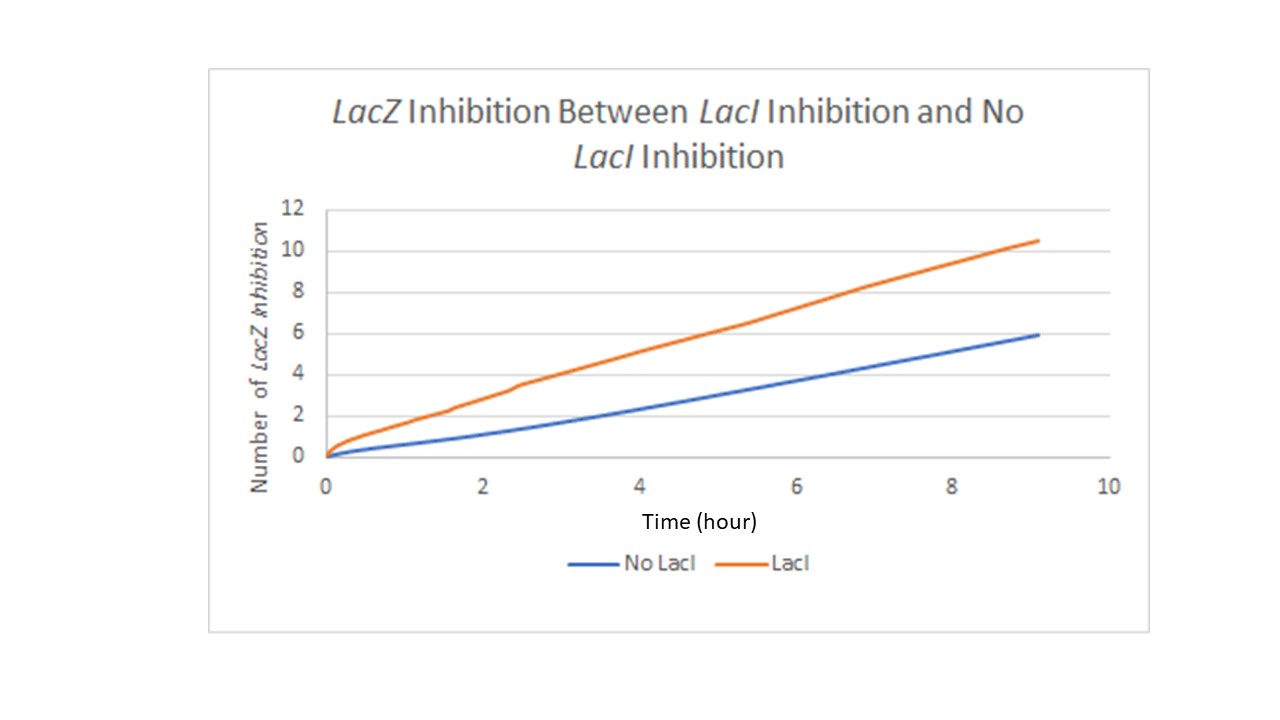
| + | <p>Figure 3 refers to the same design in Figure 2. Figure 3 shows the difference in LacZ expression with the incorporated LacI repressor. The Y-axis measures level of LacZ with inhibitor binding to its promoter and the X-axis is time in hours. In theory the LacI repressor work at a constant rate over time but experimental results have demonstrated that the LacI repressor may not be the best choice as a repressor since the LacI repressor seems to break down over time and some expression of the target gene still occurs. | ||
| + | </p> | ||
| + | <h1>Figure2</h1> | ||
| + | [[File:Kbcc model1.1 2017.jpg|900px|center]] | ||
| − | < | + | <h1>Figure3</h1> |
| − | + | [[File:Kbcc graph12017.jpg|750px|center]] | |
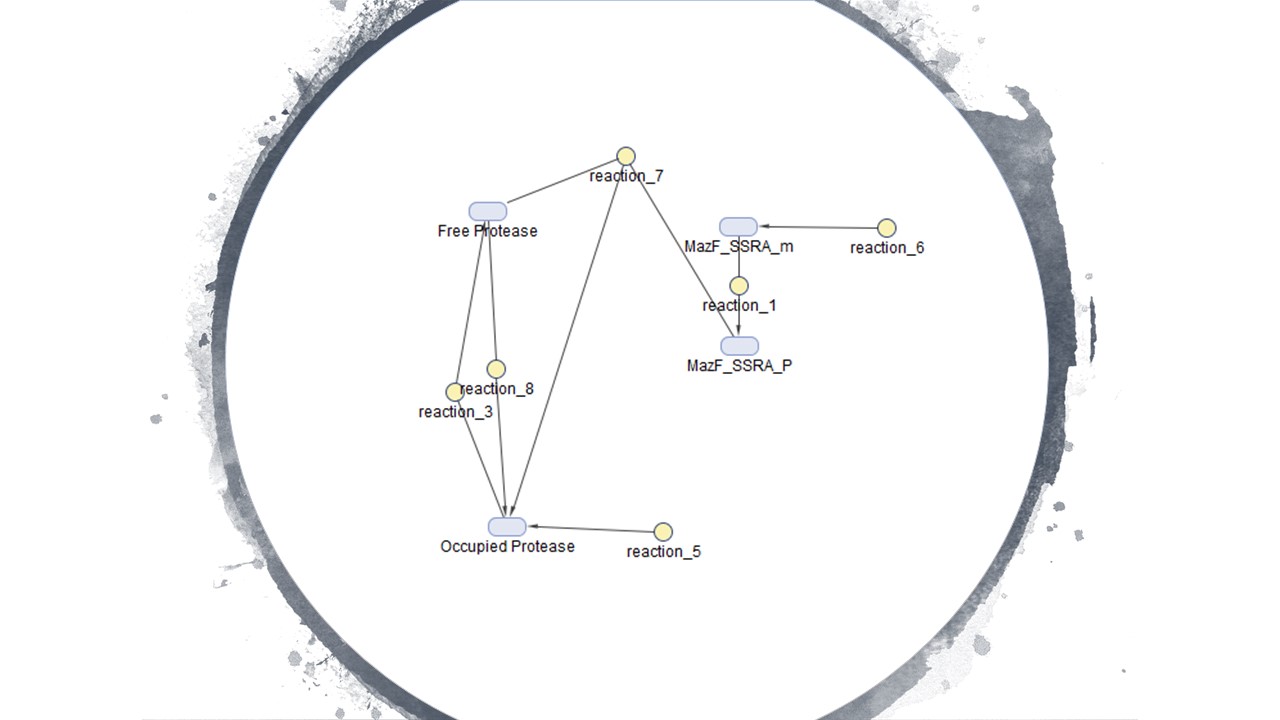
| − | <p> | + | <p>Figure 4 is the model we created for figure 5. Figure 4 is our modelled system with the MazF gene with a ssra tag at the end. The ssra tag allows for any initial unwanted gene expression to be degraded by existing proteases in the cell. The condition assumed is that as the amount of MazF proteins tagged by ssra are initially produced, the tagged proteins will be recognized by existing proteases in the cell and be degraded. But as the expression increases rapidly it occupies all the existing proteases at a rapid rate in the cell preventing further degradation of the MazF protein. This is illustrated in figure 5 with the x-axis representing time and the y-axis the amount of protease. Figure 5 shows that the concentration of occupied protease increases rapidly which offers a useful tool for controlling for any unwanted MazF gene expression in the initial stages. |
| − | + | ||
| − | + | ||
| − | + | ||
| − | |||
| − | |||
| − | |||
| − | |||
| − | |||
| − | |||
| − | |||
| − | |||
| − | |||
| − | |||
| − | |||
</p> | </p> | ||
| − | < | + | <h1>Figure4</h1> |
| − | + | [[File:Kbcc model2.1 2017.jpg|900px|center]] | |
| − | + | ||
| − | + | ||
| − | < | + | <h1>Figure5</h1> |
| − | + | [[File:Kbcc graph32017.jpg|600px|center]] | |
| − | |||
| − | |||
| − | |||
| − | |||
| − | |||
| − | |||
| − | |||
| − | |||
| − | |||
| − | |||
| − | |||
| − | |||
| − | |||
| − | |||
| − | |||
| − | |||
| − | |||
| − | |||
| − | |||
| − | |||
| + | <h1>Equation</h1> | ||
| + | [[File:Kbcc_equation1_2017.png|600px]] | ||
| − | </ | + | <p>[[File:Kbcc_12017.jpg|600px]]</p> |
| + | <p>[[File:Kbcc_22017.jpg|600px]]</p> | ||
| + | <p>[[File:Kbcc_32017.jpg|600px]]</p> | ||
| + | <p>[[File:Kbcc_42017.jpg|600px]]</p> | ||
| − | </ | + | <h1>source</h1> |
| + | [[File:Kbcc_source_2017.jpg|600x]] | ||
Latest revision as of 05:08, 16 December 2017
Figure1
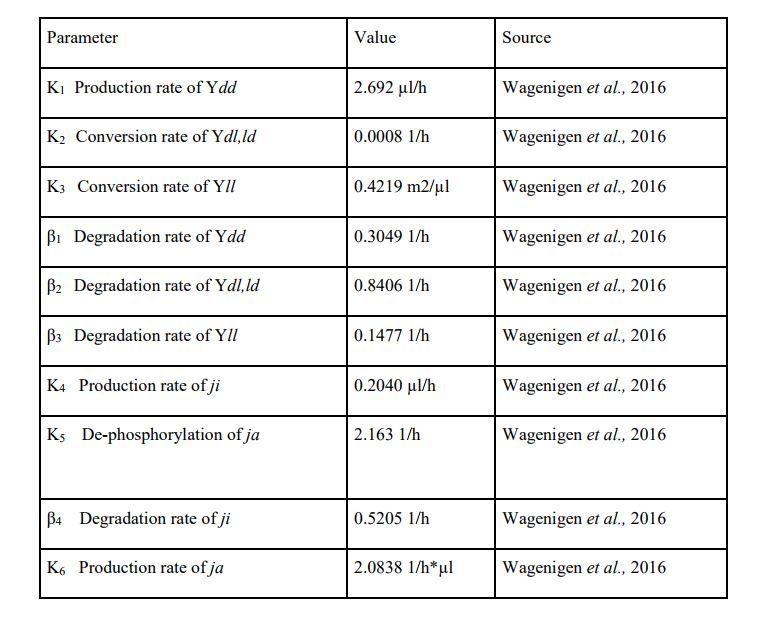
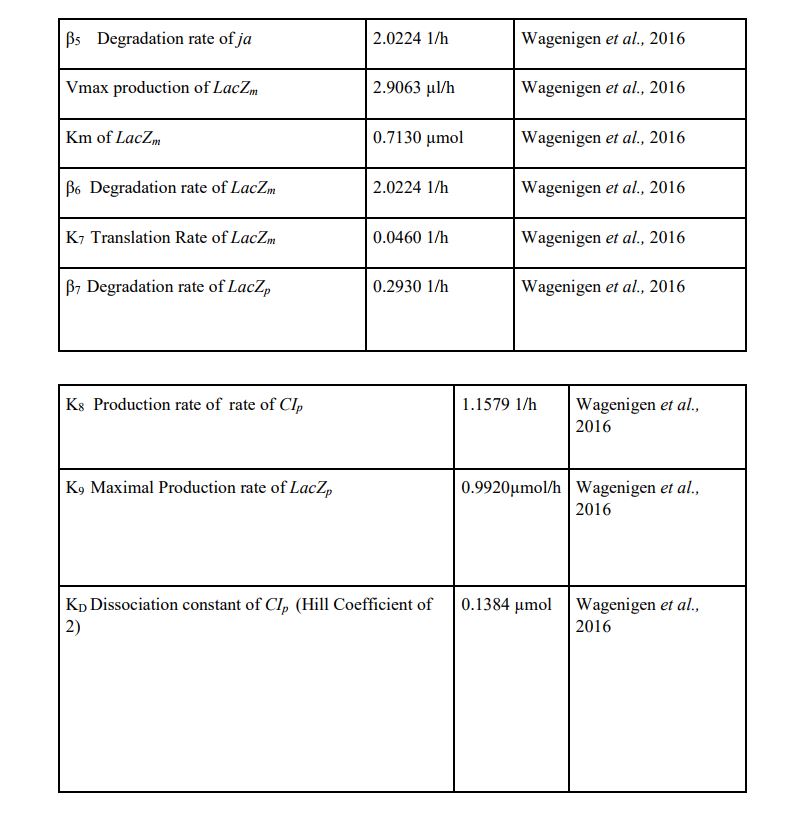
Using Matlab and Simbiology we modelled the stages of YF1 and like Wageningen 2016 iGEM team we modelled the YF1 light sensing protein as described by Möglich et al in the stages of Yll (light) Ydl/ld (transition) and Ydd (dark stage). We used the same mathematical formulas used in Wageningn 2016 iGEM team in describing the different stages of the light sensing protein however we set our parameter in terms of working from a rich light environment to no light. The model suggests that:
1. The light sensing protein is not strict; all three stages of the YF1 light sensing protein can exist at the same time if some light is introduced. In fact, the light-sensing protein readily converts Ydd and Ydl/ld into Yll in the presence of any light.
2. Given long enough time in a dark environment (over the course of hours) Ydd expression will increase and all the other two stages will convert to Ydd.
3. A second level inhibitor is needed to account for the early possible exposure of light in the lab environment.
Figure 1 is the calculated model of and Figure 2 is how we designed our system in the Simbiology toolbox.
Figure 3 refers to the same design in Figure 2. Figure 3 shows the difference in LacZ expression with the incorporated LacI repressor. The Y-axis measures level of LacZ with inhibitor binding to its promoter and the X-axis is time in hours. In theory the LacI repressor work at a constant rate over time but experimental results have demonstrated that the LacI repressor may not be the best choice as a repressor since the LacI repressor seems to break down over time and some expression of the target gene still occurs.
Figure2
Figure3
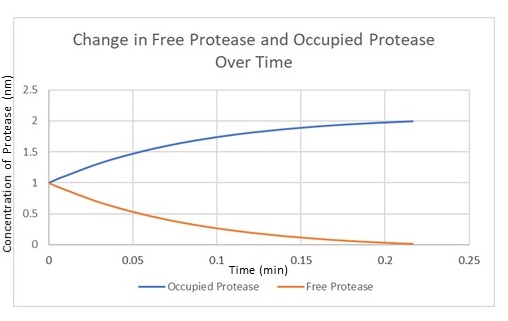
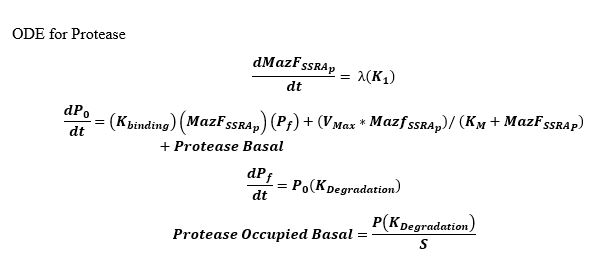
Figure 4 is the model we created for figure 5. Figure 4 is our modelled system with the MazF gene with a ssra tag at the end. The ssra tag allows for any initial unwanted gene expression to be degraded by existing proteases in the cell. The condition assumed is that as the amount of MazF proteins tagged by ssra are initially produced, the tagged proteins will be recognized by existing proteases in the cell and be degraded. But as the expression increases rapidly it occupies all the existing proteases at a rapid rate in the cell preventing further degradation of the MazF protein. This is illustrated in figure 5 with the x-axis representing time and the y-axis the amount of protease. Figure 5 shows that the concentration of occupied protease increases rapidly which offers a useful tool for controlling for any unwanted MazF gene expression in the initial stages.
Figure4
Figure5


