Team:Groningen/InterLab


InterLab Groningen 2017
Introduction
Reliable and repeatable measurements are a key component to all engineering and scientific disciplines. The same holds true for synthetic biology, which has also been called engineering biology. However, the ability to repeat measurements in different labs has been difficult. The iGEM Measurement Committee, through the InterLab study, has been developing a robust measurement procedure for green fluorescent protein (GFP) over the last three years. GFP was chosen as the measurement marker for this study since it is one of the most used markers in synthetic biology and, as a result, most laboratories are equipped to measure this protein. Team Groningen aims to help improve the measurement tools available to both the iGEM community and the synthetic biology community as a whole by participating in the InterLab 2017 study.
Challenges
One of the challenges in synthetic biology measurement is that fluorescence data usually cannot be compared because it is reported in arbitrary units or different groups process data in different ways. Often we work around this by doing some sort of “relative expression”; however, being unable to directly compare measurements makes it harder to debug engineered biological constructs, harder to effectively share constructs between labs, and even harder to interpret your experimental controls. The InterLab protocol aims to address these issues by providing researchers with a detailed protocol and data analysis format that yields absolute units for measuring GFP in a plate reader. To start the devices and the control DNA were dissolved from the iGEM 2017 distribution plate. The plate contained 6 test devices and both a positive and negative control (fig 1). These plasmids were transformed into K12 DH5α cells.
Figure 1: Plasmid map Interlab study 2017. A. positive control containing a J231140 promotor, a B0032 RBS, and a GFP gene. B. negative control containing a TetR repressible promotor. C. test device 1 containing a J23101 promotor, a B0034 RBS, and a GFP gene. D. test device 2 containing a J23106 promotor, a B0034 RBS, and a GFP gene. E. test device 3 containing a J23117 promotor, a B0034 RBS, and a GFP gene. F. test device 4 containing a J23101 promotor, a J364100 RBS, and a GFP gene. G. test device 5 containing a J23106 promotor, a J364100 RBS, and a GFP gene. H. test device 6 containing a J23117 promotor, a J364100 RBS, and a GFP gene.
Method
These transformations resulted in 8 plates containing either green or opaque colonies (fig. 2 and 3). To be sure that the incorporation of the correct plasmid enabled colony formation, a plasmid isolation was performed using the Fast-n-Easy Plasmid Mini-Prep Kit from Jena Bioscience. A portion of the isolated plasmid DNA was then digested using the restriction enzyme EcoRI for 30 minutes at 37°C. Then, the enzymes were denatured by a 20-minute 80°C heat shock. 10 ng of each digestion product was loaded onto a 1% agarose gel (fig. 4). It visualises that every picked colony contained a plasmid with a length of either ±2 or 3 kb. This confirms the incorporation of the correct plasmid.
Figure 2 Interlab transformant plates. Luria-Bertani plates with 25 µg/ml chloramphenicol.
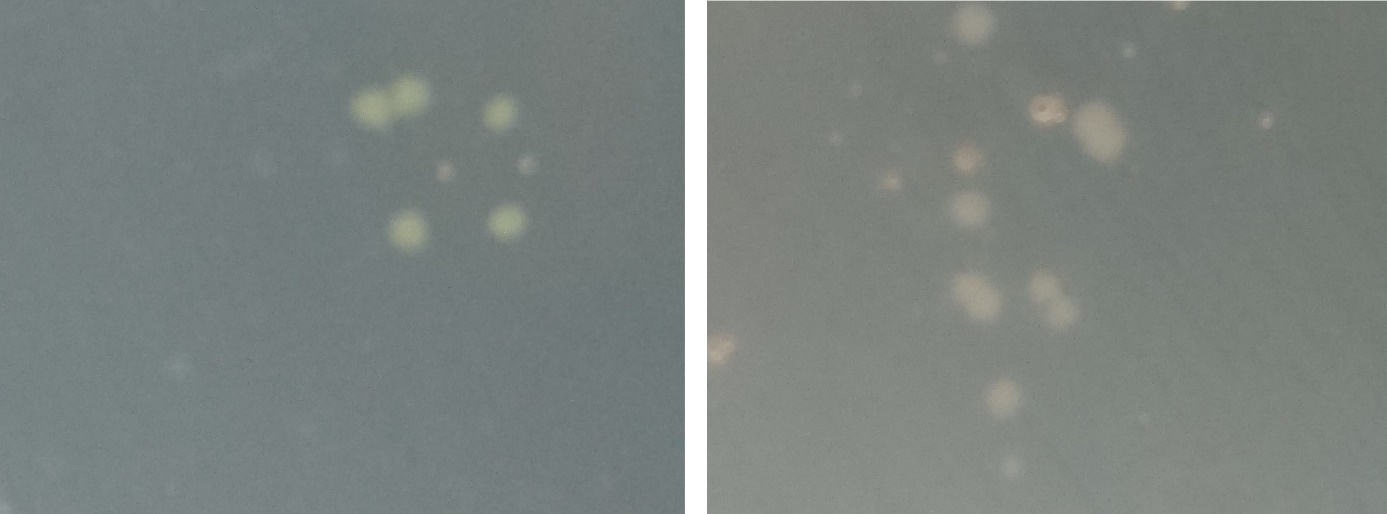
Figure 3: Transformant colonies on selection plates. Left; green colonies from test device 1 plate. Right; opaque colonies from the negative control plate.

Figure 4: Electrophoresis analysis transformant digestion products. Each lane shows the duplo of plasmid DNA, originating from two separately picked colonies from one transformant plate. The samples show that all transformants contain the correct plasmid when comparing the size for the linearized DNA and the total size of the individual plasmids.
Results
After confirming the genetic makeup of the transformants, both the necessary optical density conversion factor and the fluorescence emission/concentration ratio were determined by measuring LUDOX solution at 600 nm and a fluorescein dilution series at 450 nm/511 nm in the Biotek Synergy™ MX plate reader. Unfortunately, the detection limit for the fluorescein dilution was not high with these settings, so additional dilutions were made. This resulted in a conversion factor of 3.86 and a fluorescence ratio of 7.41x10⁻⁶. With this known conversion factor and ratio, GFP expressing cells were grown for 6 hours at 37°C, starting with identical optical densities of 0.2. Culture samples were taken after 0, 2, 4 and 6 hours of growth (fig. 5). After collecting all the samples, the concentration of GFP per cell was determined by plate reader measurements (fig. 6). These measurements, on average, demonstrate that the most GFP per cell is expressed after 2 hours. After 4 and 6 hours, this ratio is lower, as less GFP per cell is expressed. When comparing individual devices with each other, device 1 and 5 result in the highest GFP expression per cell. Device 1 has a J23101 promotor and a B0034 RBS incorporated before the GFP gene and device 5 a J23106 promotor and a J364100 RBS. So, this would suggest that the combination of these particular promotors and their RBS’ results in the most optimal GFP expression.
Figure 5: GFP cell measurement preparation. Left; liquid overnight pre-cultures of transformed E. coli DH5α cells. Middle; sample batch of GFP expressing E. coli cells. Right; 96 well plate with the fluorescein standard curve dilution series.

Figure 6: Histogram of the measured fluorescence over the optical density of cell samples.
