Contents
Overview
We are working to create a biosensor to detect xylulose, a sugar found in the capsule of Campylobacter. Purified xylulose was required for our team’s experiments to develop a xylulose biosensor, but was prohibitively expensive to purchase. The aim of this subproject was therefore to synthesise xylulose from the much cheaper and more readily available sugar xylose. The enzyme xylose isomerase (XI) isomerises xylose to xylulose, and vice versa, in a single step. The Escherichia coli gene for xylose isomerase (xylA) was isolated by PCR and inserted into a biobrick-compatible plasmid under the control of the highly-active T7 promoter. xylA was expressed at high levels in E. coli BL21(DE3), in which T7 RNA polymerase is IPTG inducible. Additionally, we explored strict regulation of xylA expression to avoid potential toxicity by creating a regulatory plasmid expressing T7 lysozyme. Both the xylA gene and the t7 lysozyme gene were made into biobricks and submitted to the parts registry for use by future iGEM teams.
Background
Xylulose
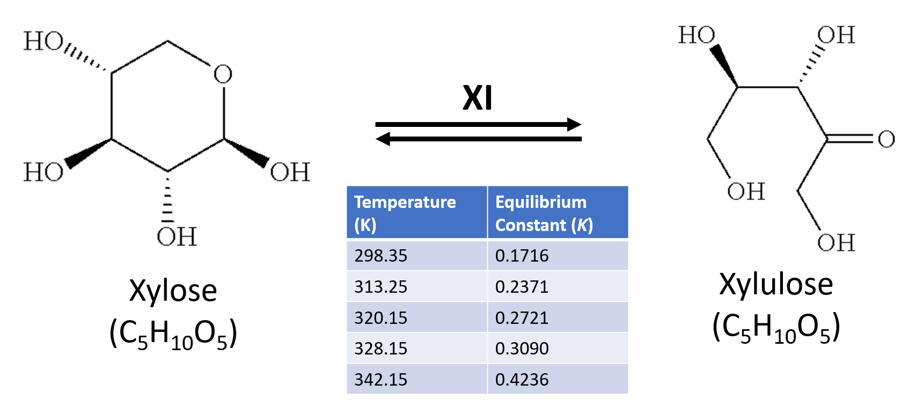
Xylulose is an important metabolite in the pentose sugar metabolic pathway (PSMP), specifically in xylose catabolism. It’s stereoisomer xylose, a ubiquitous sugar in flowering plants, is readily metabolised by bacteria. Xylulose and xylose share the chemical formula C5H10O5, and a molecular mass of 150.3g/mol. The sugars can be isomerised from one to another by the enzyme xylose isomerase (XI) – which is also known commercially as glucose isomerase for its role in the similar isomerisation reaction between glucose to fructose in the food industry, such as to produce high-fructose corn syrup (Bhosale, Rao and Deshpande, 1996).
The thermodynamics of this reaction are detailed by Tewari, Steckler and Goldberg (1985), who highlight an equilibrium constant (K) of 0.17 at near room temperature (298K), but a higher K value nearer equilibrium (K=0.42) as temperatures approached ~70oC (342K) (Figure 1). Furthermore, they noted the reaction requires magnesium as a co-factor (from MgCl2), and was carried out in a phosphate buffer at neutral pH.
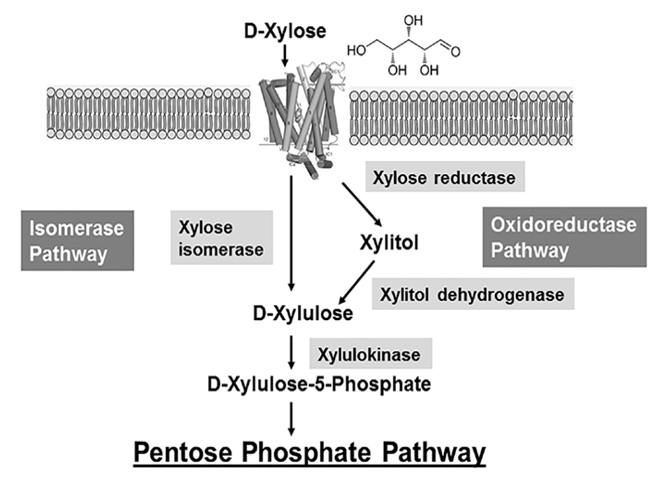
Xylose utilisation in E. Coli, amongst other bacteria, is subject to carbon catabolite repression; it is only utilised after glucose, lactose and arabinose have been consumed (Desai & Rao, 2009). In E. Coli, xylose enters the cell through an ABC-type transport system, and is later modified by multiple enzymes – all of which are coded in a xylose utilisation (xut) locus. Upon entering the cell, xylose is quickly isomerised to xylulose by XI (coded by the xylA gene), and is then phosphorylated by xylulokinase (xylB) before entering a more complex sugar metabolism (Figure 2). This reaction chain is rapid, and so xylulose is not present for a long period of time in bacterial metabolism.
The Problem
The molecular basis for our C. jejuni biosensor is the rare abundance of xylulose within the bacteria’s capsular polysaccharide (CPS), which could theoretically be exploited as an indicator of the presence of C. jejuni on the surface of raw poultry. We have designed genetic circuits, based on a mannitol sensing transcriptional regulator which has cross-activity with xylulose, or mutants of the araC arabinose regulatory system, which will respond to xylulose with a fluorescent output. The later stages of the project will involve testing these biosensor genetic circuits with xylulose in lab conditions. However, the price of xylulose (Sigma catalogue no. X4625) exceeds our financial capacity: 25mg of D-xylulose costs £194.50 ($258.41), and so to make a 25ml agar plate with 20mM/l concentration of xylulose, we would need 75mg of xylulose for each plate. This would cost £583.50 ($775.23) for a single xylulose screening experiment, and thus, we were unable to purchase the quantities needed to test our biosensors. Therefore, as a subproject, an expression plasmid was developed which utilises a T7 promoter system and the BL21(DE3) strain of Escherichia Coli (which encodes T7 RNA polymerase) to express high levels of the XI enzyme. This would allow for the overexpression and purification of the isomerase enzyme for use in the reaction to produce xylulose from xylose.
LysS
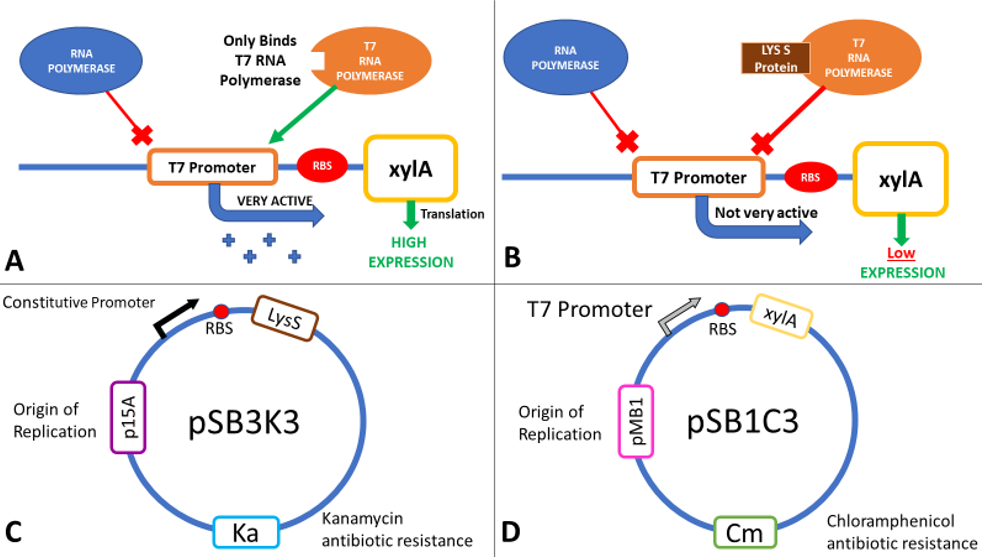
The inducible T7 expression system is a highly controlled system for overproduction of proteins in E. coli (Studier and Moffat, 1986). BL21(DE3) carries a chromosomal copy of the enterobacteria phage T7 RNA polymerase gene expressed from an Isopropyl β-D-1-thiogalactopyranoside (IPTG) inducible lac promoter. T7 RNA polymerase initiates transcription exclusively at T7 promoters. Therefore, a plasmid-borne gene placed downstream of a T7 promoter and an efficient ribosome binding site (RBS) will be highly expressed in an IPTG-inducible fashion in this strain (Figure 3A). As well as IPTG induction of RNA polymerase, two other regulatory mechanisms can be used to fine-tune expression levels: Lac operator sites can be incorporated into the T7 promoter to repress transcription in the absence of IPTG, and the lysozyme protein of T7 (encoded by T7 gene 3.5, but referred to as LysS) inhibits transcription by T7 RNA Polymerase (Figure 3B). Expression of lysozyme has been used extensively to repress basal transcription of the gene in the absence of IPTG to avoid toxic effect of some proteins. Repressing basal expression in the absence of IPTG helps to stabilise expression plasmids, and guard against selections for mutations in the T7 promoter or gene coding region. Two T7 lysozyme expression plasmids are commonly used: pLysS expresses lysozyme at low levels, giving better induced expression levels but slightly higher leakage than pLysE which expresses lysozyme at higher levels (Studier, 1991).
Methods
A standard set of protocols were used by all in the lab, and are therefore described in our protocols page. This includes:
- DNA miniprep
- Restriction digestion
- Gel electrophoresis
- Gel Staining/Imaging
- Gel DNA extraction
- DNA ligation
- Cell Transformation
- PCR
SDS-PAGE
Sodium Dodecyl Sulfate – Polyacrylamide Gel Electrophoresis (SDS-PAGE) was used to analyse the effect of the expression plasmid (designed to overexpress xylose isomerase) on the entire protein complement of the E. Coli BL21(DE3) cells, and compare to normal cell protein expression to conclude whether the expression plasmid works as hypothesised.
BL21(DE3) strain E. Coli cells were first transformed with the expression plasmid. 3 separate fresh 3ml liquid cultures (labelled cultures A, B and C) were made using separate colonies, L-broth, and with the addition of chloramphenicol (Cm) (1,000X) and glucose (20mM/l). Glucose was added to the media because it precedes lactose in the E. Coli sugar-consumption hierarchy, and the lactose-induced lac operon loci is known to transcribe RNA polymerase. As such, a source of glucose suppresses RNA polymerase transcription, and so gene expression only occurs after addition of the lac-operon inducer Isopropyl β-D-1-thiogalactopyranoside (IPTG).
Each culture was then diluted 100-fold (300µl added to 30ml fresh L-broth) in broth containing Cm, and then was incubated (37oC in a shaking rack at 225 rpm) for a period of 3 hours. During this period, cell growth was measured every hour by optical density (OD), using a spectrophotometer (600nm wavelength). Once each culture reached a pre-induction (Pre) OD of roughly 0.5, an aliquot was removed and kept for analysis during SDS-PAGE as samples showing pre-induction cell protein expression. IPTG was added to induce protein expression in the remaining culture. The cells were then incubated (37oC in a shaking rack at 225 rpm) for another 3 hours, recording the post induction (Post) OD of A, B and C. Sample Optical Density Dye Added (µl)
Following protein expression, 1ml of cultures A, B and C were transferred to a 1.5ml eppendorf tube and spun down (13,000rpm for 5 minutes). The supernatant was then pipetted off, and the cells were resuspended in laemmli loading buffer (950µl 5X laemmli sample buffer + 50µl 0.5M dithriotheitol (DTT)). The proportion of buffer added to each culture was normalised to the culture with the highest OD, where that culture received 1ml of laemmli buffer (Table 1).
The gel used was a 10-well Mini-PROTEAN TGX Precast Gel. 25µl of each of the 6 samples (PreABC and PostABC) were loaded on the gel, along with 20µl of protein marker (Biorad Precision All-Blue Molecular Weight Marker ladder). 25µl of dye was also added to the remaining wells to avoid protein running at an angle. The gel was run until the bands reached the green reference line on the SDS-PAGE kit. The gel was then removed from the precast cassette, and stained with Coomassie blue.
Results
Condition set up
- Media (control): 20ml M17L + 80µl 50mM PBS
- Media + casein: 20ml M17L + 80µl 50mM PBS + 0.26% casein (final concentration of casein = 0.0026%)
The media M17 is commonly used for growing S. thermophilus, we used a variant with added lactose as indicated by L. The concentration of lactose in this case was 5gL-1. The stock of M17 used was kindly sent from the lab of Pascal Hols and details were provided by Maud Flechard.
Sample preparation
- We prepared a overnight culture of S. thermophilus incubated at 37 degrees Celsius in 20ml of M17L media
- From the overnight culture, 10 aliquots were extracted and pipetted into 1.5ml Eppendorf tubes
- Tubes were centrifugated for 1 minute at 8000rpm at room temperature and supernatant was discarded
- Each pellet was resuspended in 1ml PBS
- Tubes were centrifugated for 1 minute at 8000rpm at room temperature and supernatant was discarded
- Each pellet was resuspended in 1ml PBS again
- Following these steps, the cells were washed and overnight media had been removed
- 1ml of washed cells was added to 19ml of fresh condition media for the expression stage
These steps were repeated five times for each media condition, ending up with five 20ml cultures of S. thermophilus growing in M17L/Casein; and five cultures of S. thermophilus growing in M17L. Essentially, five replicates were set up for each condition and the S. thermophilus cultures were exposed to each condition for a duration of 3 hours and 15 minutes, during which time optical density was checked at regular intervals (Table 1). Incubation temperature was kept at 37 degrees Celsius throughout. Upon completion of the incubation, each 1ml of sample was split into two tubes, yielding two replicates for each sample.
We then followed the Qiagen RNAprotect protocol. This stalls cell growth, and inhibits the action of cellular RNAses to protect against RNA degradation. Consequently, we extracted RNA using the Qiagen RNeasy kit designed for use with bacteria. Specifically, we followed the enzymatic lysis protocol which, for S. thermophilus, involved using 30mg/ml of lysozyme lysis in an Eppendorf ThermoMixer desktop shaker. We shook the samples for 30 minutes at 1000rpm at 37 degrees Celsius. We removed residual genomic DNA by performing the optional stage of on-column DNAse digestion. For the final elution step of the protocol, the RNA was spun twice with 30μl Nuclease-free water to maximise yield. This resulted in 60μl for each of the samples. The two replicates of each sample were then combined into a single tube – so the final samples were 120μl x 10. In order to send adequate samples to Glasgow Polyomics, we assessed our RNA quality. Initially we checked RNA on a “Bleach gel” – an agarose gel that protects against RNA degradation [1]. To make a 70ml 1.2% agarose gel, we added 1.4ml of additive-free 1.5% hypochlorite bleach to the melted agarose. We loaded 2μl of each RNA sample, 3.3μl of NEB 6x purple loading dye and 14.7μl RNAse free water. In total this equated to a 20μl loading solution. An Invitrogen 1kb+ DNA ladder was loaded in the first wells as a reference. Electrophoresis was performed at 70V for 40 minutes. The gel was then post-stained with Ethidium bromide and imaged on a Bio-rad Gel Doc (Figure 1).
The gel picture shows a well-defined RNA profile for all 10 samples (tRNAs at the very bottom, 16s and 23s rRNAs at correct ratios, no genomic DNA stuck at the top of the wells), with no visible degradation.
We then quantified each sample to ensure we were sending adequate concentrations of RNA (Table 2). The 10 RNA samples were quantified at A260 in a spectrophotometer. Samples were diluted 1/50 (8μl into 392μl RNase free water, for 400μl quartz cuvette).
Satisfactory replicates were sent to Glasgow Polyomics for processing.
Results and Discussion
Bioinformatic analysis of our results revealed that we had uncovered 24 differentially expressed genes, 11 of which were upregulated in the presence of casein (Table 3). In terms of gene function, we expected to see links to protein degradation. Based on the upregulated genes observed, we suspect that we may have missed the window for isolating these transcripts, as the upregulation here seems to be related to amino acid transportation rather than the degradation of proteins.
Upon analysis of the differentially expressed transcripts, we observed that the most upregulated variant had a 0.419 log2 fold change i.e. just under 1.5x the expression relative to the control (Figure 2). We concluded that the lack of distinct disparity in expression deems this set of genes unsuitable with regards to our SIM device. To switch the SIM device on, we would need to find a promoter common to genes that are highly expressed in milk. No set of genes in this experiment jumps out and so we would need to investigate expression patterns in milk further.
Outlook
Had we the time and funding, we would have liked to have repeated these experiments in slightly different conditions. We would have decreased the time interval of exposure, changed the media so that there were fewer confounding variables e.g. trying to reduce amino acid presence in the base media as far as possible, and performed more detailed growth curve analyses prior to sending our samples.
References
- ↑ Aranda, P. S., Lajoie, D. M. & Jorcyk, C. L. 2012. Bleach gel: a simple agarose gel for analyzing RNA quality. Electrophoresis, 33, 366-9


