Contents
Overview
The aim of our work is to develop a low-cost device to introduce the sample, extract the biomarker, xylulose, and house the biosensing bacteria, all in a self-contained device.
Xylulose extraction has been carried out previously in “Structural Analysis of the Capsular Polysaccharide from Campylobacter jejuni” (Gilbert et al., 2007) [1] using the fact that it is very acid labile. The process involved heating the sample with acetic acid to a temperature of 100°C. To enable the device to be portable and used in the field, we targeted the use of microfluidics techniques to extract and detect xylulose.
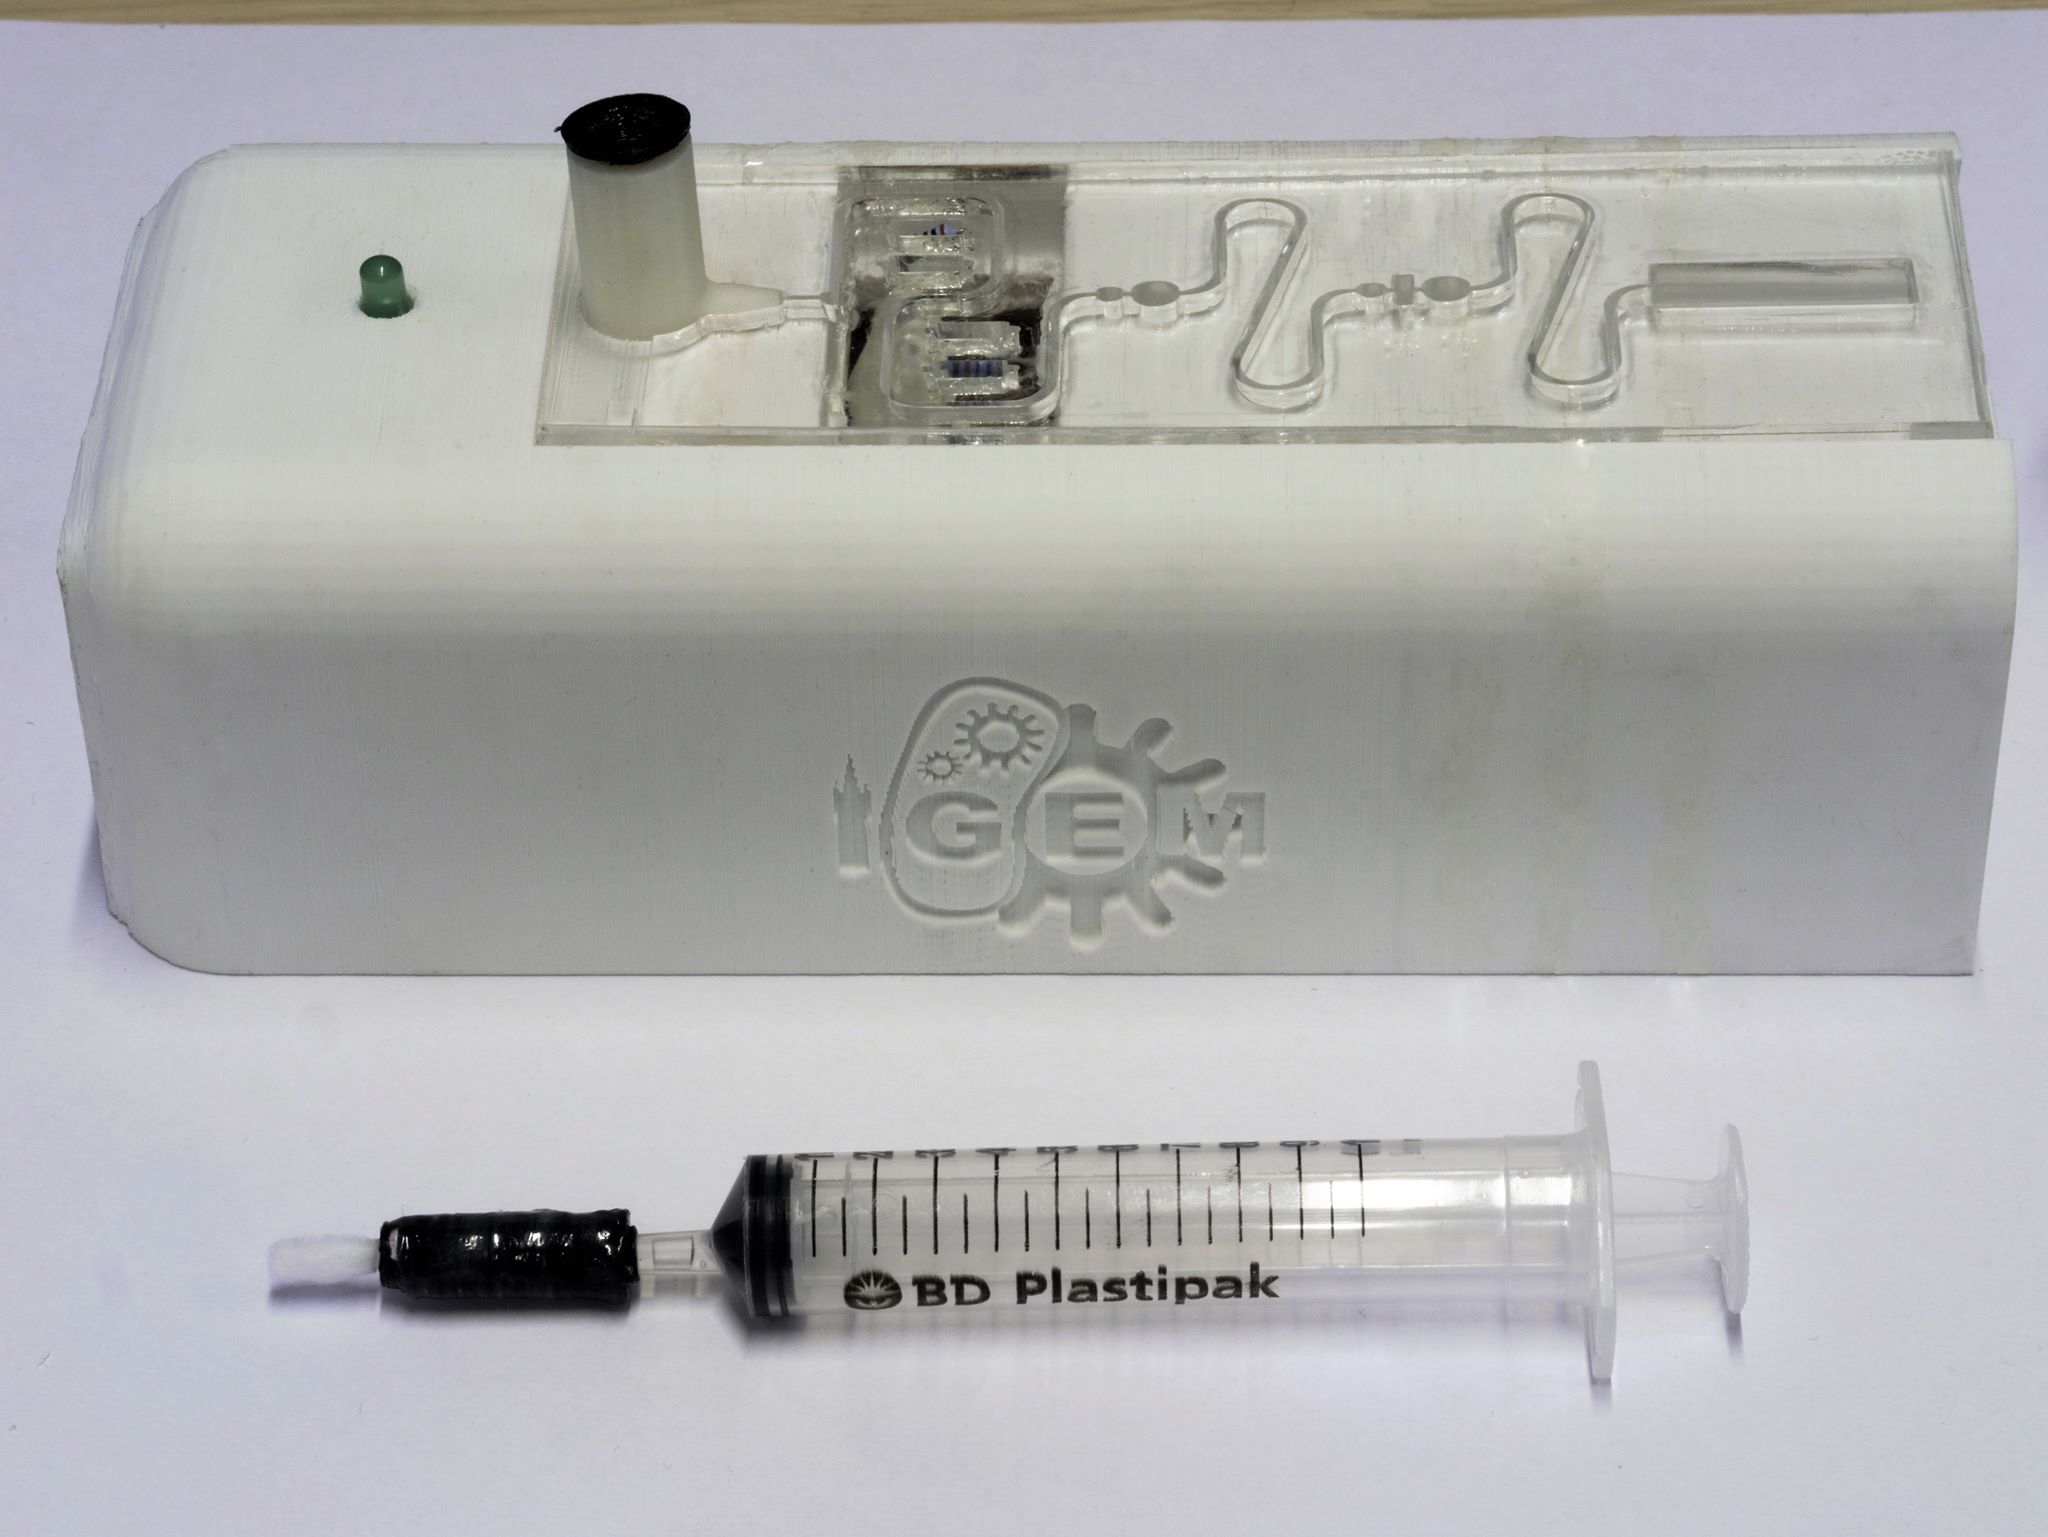
The device consists of 3 elements (as shown in figures 1-3):
- A swab, used to gather the sample from the environment, attached to a syringe containing 1% acetic acid in tris acetate (TAE) buffer.
- A self-contained (to avoid contamination) combined processing plate and heating circuit for preparing the sample for detection.
- A Device casing to house and contain the processing plate and electronics
The processing plate contained a section to house the genetically modified bacteria that has been developed for our project, and allow the user to observe if there was any Campylobacter present in the original sample.
One part that is not available in this design is the detection system. In this version, we rely on eye inspection, but this could be implemented in a quantifiable system using, for example, a smartphone. It should be noted that this device is only a "one-part biosensor" as it focuses solely on the detection of xylulose. In practice, a method for the detection of quorum sensing molecules would also need to be incorporated into the device to improve the reliability of the results gained from using the device.
Challenges
- Neutralisation: Using acid for the extraction of xylulose would be detrimental to our biosensor down the line, killing our biosensing E. coli. We thus have to neutralise the acid using an equivalent alkali. We also integrate a measurement of the pH to validate that the process is not harmful to our biosensor.
- Hierarchical Metabolism: E.coli are able to metabolise a range of sugars of similar chemical structure to xylulose (Aidelberg et al., 2014)[2]. This means that our biosensor carries the risk of not producing the reporter molecule upon addition of xylulose. We thus chose to add glucose to the sample before the contact with the biosensor, as E. coli will metabolise glucose first, while xylulose is used by the biosensing pathway.
- Gel Encapsulation: Biosensor storage in the device. Our device is targeted at Point-of-need application and thus requires to be portable and to have all reagents already stored within the device.
- Heater Circuit: In order to carry out the heating step of the procedure, it was necessary to raise the temperature to 100°C. In light of this, a heater circuit was designed.
Final Design
A brief overview of how the device, shown in figure 1, is operated and the steps involved in processing the sample is given below. The device was the result of an extensive design process and is the fourth and final design iteration.
A swab of the area for testing is taken, holding the sample. It is then inserted into the input section of the processing plate. The syringe, holding the solution of acetic acid, is pushed slowly to detach the sample from the swab matrix and pass it through the device. The sample is then taken through a series of stages which will release the sugar xylulose from the capsule of any campylobacter bacteria present. These being:
- Heating the acid and sample to 100 °C (which detaches xylulose)
- Neutralising the acid using a Tris-Acetate buffer (making the solution harmless to E. coli)
- Validating the pH using litmus paper
- Mixing with glucose (ensuring the E. coli does not metabolise the xylulose)
The sample is then delivered to the detection chamber, which holds a strip of filter paper with a hydrogel coating that contains our genetically modified E. coli cells. The detection chamber, along with the rest of the device, is transparent, allowing the user to observe any colour changes should xylulose be present in the sample.
A demonstrational video showing the finished device and outlining how it should be operated is given below.
Results
During this project, we designed, manufactured and characterised individual parts and the whole integrated device (see below for details). However we did not have time to fully validate the complete device. In particular, we hoped to be able to show a sample-to-answer result, where a matrix is spiked with xylulose (since we cannot work with Campylobacter for safety reasons) and detected by our biosensor after processing. Again, due to time constraints we were unable to complete this.
As previously explained, the finished design consisted of three main elements with some of these containing multiple parts. Considering this, the design is discussed partwise as follows:
Fluidic/Processing Plate
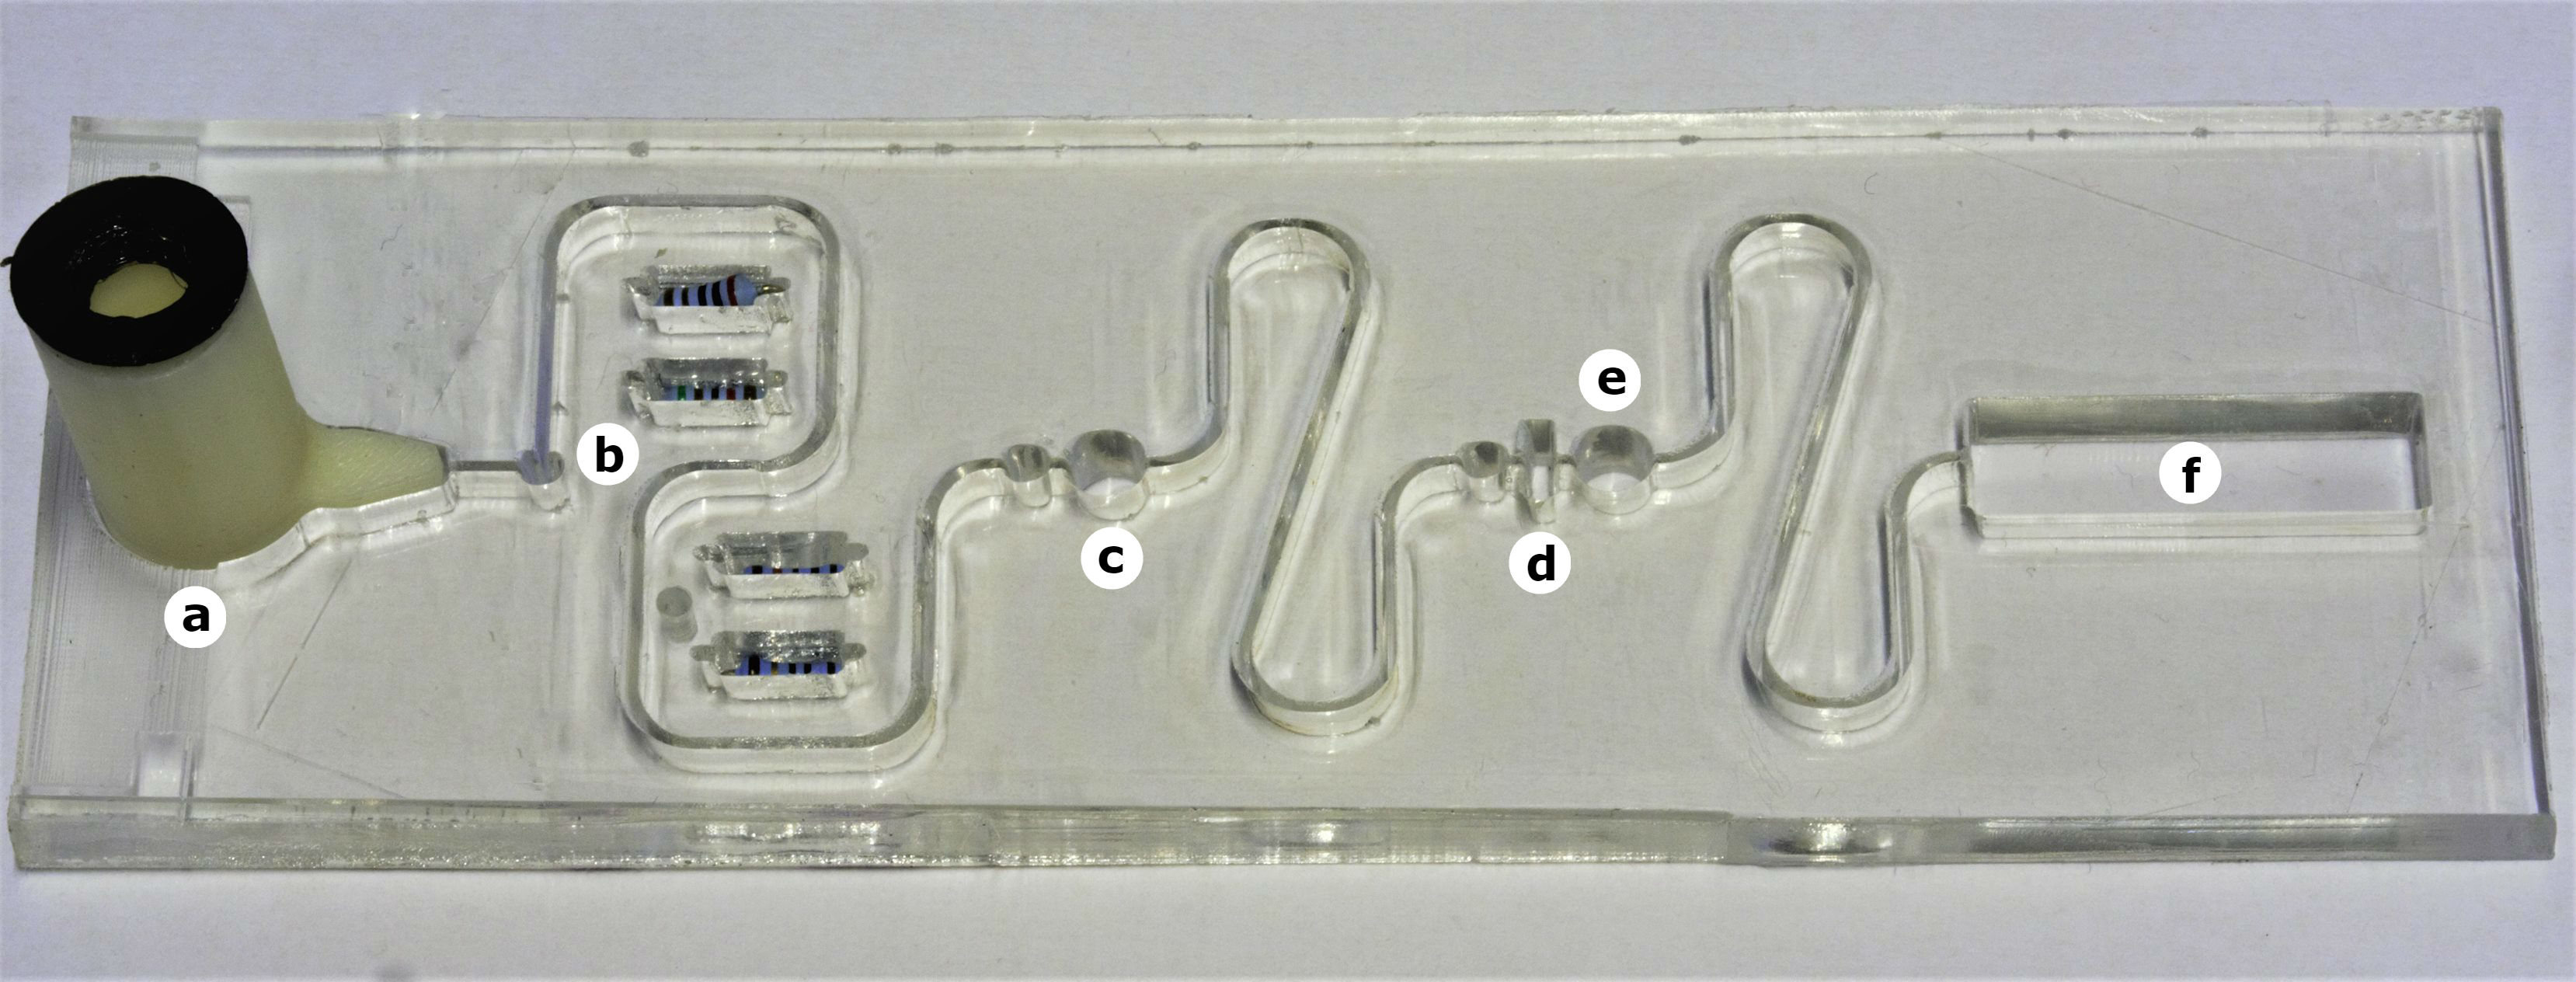
The diagram below (figure 2) indicates the features of the processing plate with the corresponding stages in the protocol that occur in the different parts.
- a) Swab Receiver: This is where the swab is inserted and the sample is delivered using 1% acetic acid.
- b) Resistor Bank / Heating Element: Heats up fluid in surrounding channels.
- c) Buffer Salt: Neutralises acid solution.
- d) pH Paper: Test to determine success of neutralisation.
- e) Glucose Powder: Ensures xylulose derived from bacteria are not metabolised by E. coli.
- f) Detection Chamber: Contains hydrogel containing GMO E. coli capable of detecting xylulose.
Sample Collection/Delivery Mechanism
The purpose of this part was to obtain a sample from the surface area intended to be tested for the presence of Campylobacter, and to then pump the fluid sample through the processing plate where the sample would be prepared for detection.
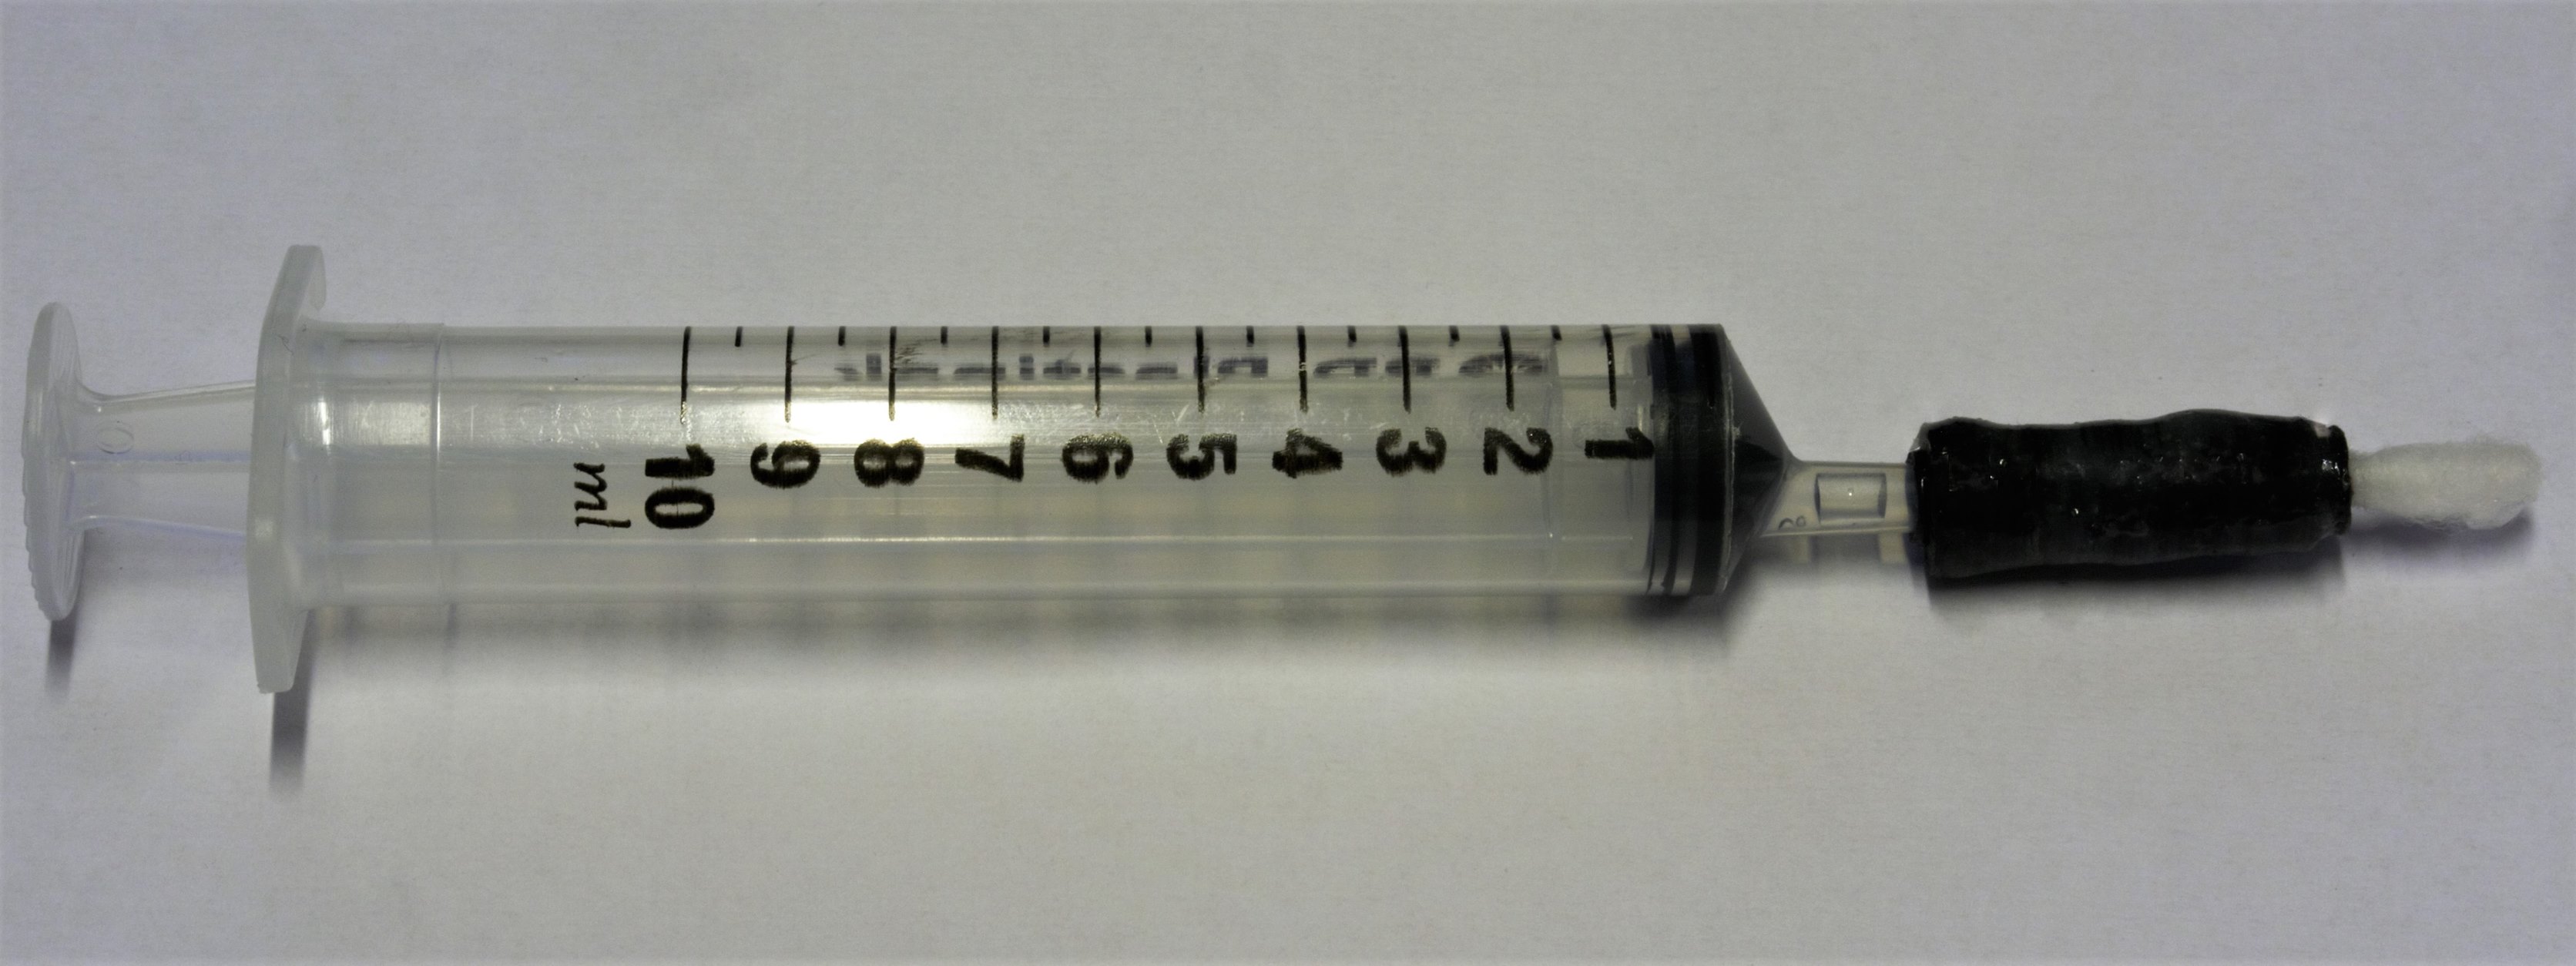
The syringe-swab part was assembled as can be seen in the picture below (figure 3). In theory, the configuration should have served its purpose as it was. However, due to the physical limitations of the 3D printer used, the rubber pieces were not watertight and had to be sealed with, in our case, epoxy glue.
The sealing ring (figure 4) was glued to the swab receiver. This was done with the intention of creating as airtight a seal of air as possible so that there would be no leaking of fluid while using the device. The swab receiver, shown in figures 5 and 6, was glued into the processing plate using epoxy to seal it in.
 Figure 4: Sealing Ring
 Figure 5: Swab Receiver
 Figure 6: Sectioned Swab Receiver
Heating Element
In the protocol for detaching xylulose from the polysaccharide capsule of Campylobacter, the sample was heated to 100 degrees Celsius for 3 hours. To achieve the same step in the Campylobacter detection device, a heating element had to be designed and made possible to incorporate into the processing plate.
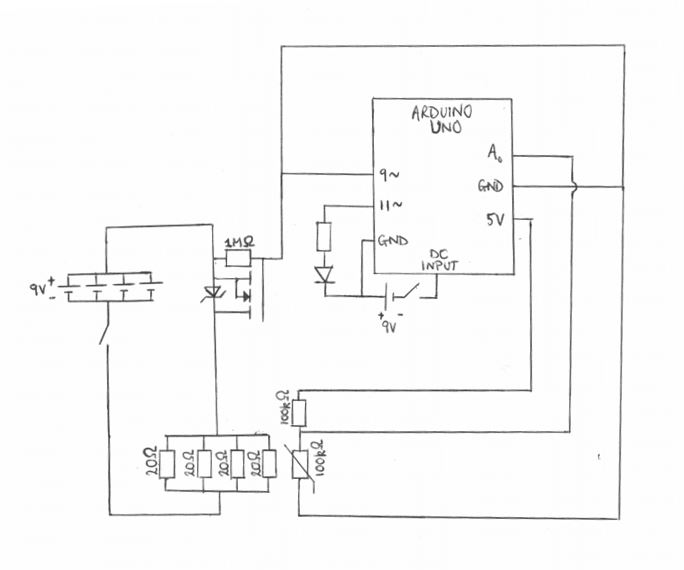
The heating element took the following form: An Arduino board was used to switch on and off a MOSFET which controlled the flow of current to the heating element. A temperature sensor was also implemented using the Arduino board, using a 100KOhm thermistor. By implementing the temperature sensor alongside the heating element, and using pulse-width modulation control of the MOSFET, it was possible to create a negative feedback controlled part for heating the sample to temperature. The circuit diagram for heating element is shown in figure 7 below.
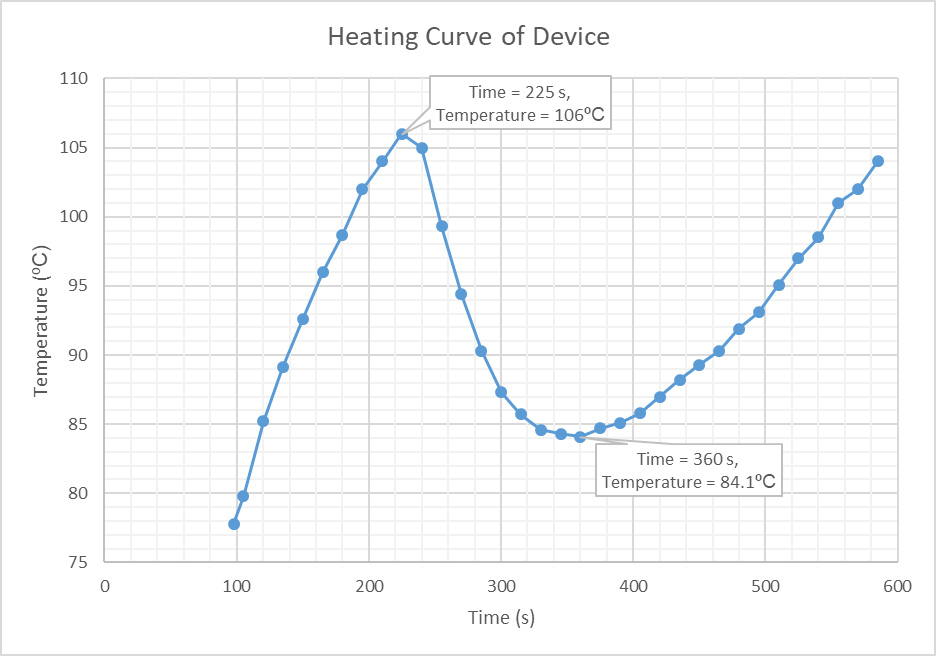
To test the performance of our heating circuit, we filmed the device in operation with an infrared camera whilst passing a sample consisting of water through the device. The video below, shows the temperature of the resistors heating up to 106ºC, at which point the sample is passed through the device. The temperature of the heating element decreases, indicating that the heat is being transferred to the sample. As the temperature of the heating element returns to the original temperature above 100ºC, it can be concluded that the sample also reaches this temperature.
Using the information obtained from this video, a graph was plotted (Figure 8) showing how the temperature of the heating element changed with time. This graph shows the initial heating of the resistor bank up to 106ºC (time = 225 seconds) at which point the sample is introduced. The graph then shows the decrease in temperature of the heating element, as the heat energy is supplied to the sample, which continues until the 360 second point. It is at this time that temperature of the heating element increases again, indicating that the sample is at equal temperature. It should be noted that the infrared camera was not centred on the heating element, hence why the graph begins at 98 seconds rather than zero.
The code to operate the Arduino microcontroller is as follows:
// Setup of Thermister
int ThermistorPin = 0;
int Vo; // voltage over the thermistor
float R1 = 100000; // Resistance of Resistor in series with Thermistor
float logR2, R2, T; // Variables when calculating temperature
float c1 = 1.009249522e-03, c2 = 2.378405444e-04, c3 = 2.019202697e-07; // Constants involved in calculating temperature
// Setup of "Heater"
int LEDpin=11; // Pin corresponding to LED indicating heater function
int pinR1=9; // Pin corresponding to heater ON/OFF control
int SetVoltage=165; // PWM (Pulse Width Modulation) control of the current supplied, at first, to the MOSFET and consequently to the heater
int VoltageCorrection=5; // Degree to which the PWM value is altered in feedback control of the heater
void setup() {
- Serial.begin(9600);
- pinMode (pinR1, OUTPUT);
- pinMode (LEDpin, OUTPUT);
- analogWrite (pinR1, SetVoltage);
- analogWrite (LEDpin, SetVoltage);
- delay (30000);
}
void loop() {
- //THERMISTER READING
- Vo = analogRead(ThermistorPin);
- R2 = R1 * (1023.0 / (float)Vo - 1.0);
- logR2 = log(R2);
- T = (1.0 / (c1 + c2*logR2 + c3*logR2*logR2*logR2));
- T = - (T - 273.15);
- Serial.println("* * * * * * * * * * * * * * * * * * * *");
- Serial.println("Temperature = ");
- Serial.print(T);
- //NEGATIVE FEEDBACK
- if (T<90) (SetVoltage = SetVoltage + VoltageCorrection);
- if (T>110) (SetVoltage = SetVoltage - VoltageCorrection);
- if (SetVoltage<0) (SetVoltage = 0);
- analogWrite(pinR1, SetVoltage);
- analogWrite(LEDpin, SetVoltage);
- delay (10000);
- Serial.println("Voltage Write Value = ");
- Serial.print(SetVoltage);
- Serial.println(" ");
- Serial.println("* * * * * * * * * * * * * * * * * * * *");
}
Hydrogel Encapsulated Bacteria Strips
As a way of encapsulating the live bacteria to be used as a means of detecting the target molecule, it was decided to coat them in a hydrogel matrix such that they could not escape into the environment but still be able to interact with the water-soluble xylulose. It was chosen that the hydrogel used to encapsulate the E. coli cells would be polyacrylamide due to its transparent properties and ease of manufacture. To insert the hydrogel into the detection area, a filter paper strip was developed so that the hydrogel would be able to polymerise on it prior to insertion into the device. The filter paper would aid in the uptake of the liquid passed into the detection area where it would then be able to diffuse through the hydrogel matrix to interact with the encapsulated cells. Many experiments were performed to investigate the properties of the polyacrylamide gel, the behaviour between the gel and the filter paper strip and also to assess cell viability within the gel. This information can be read here.
Bacillus subtilis Experiments
The use of E. coli cells as a means of detecting the target molecule, xylulose, puts certain limitations on the design, such as storing the hydrogel encapsulated bacteria strips at refrigeration temperature. To overcome this, an alternative species of bacteria that was more resilient under a wider range of conditions was required to act an alternative host for our genetic construct. The bacterium Bacillus subtilis was chosen due to its ability to form endospores, a dormant, tough and non-reproductive structure, that can withstand extreme environmental conditions. As the decision to use an alternative organism to E. coli was made approximately half-way through our project, there was not sufficient time to completely redesign our genetic construct such that it could be expressed in Bacillus subtilis. Because of this, a new experiment had to be designed to show that the bacteria could be used for our purposes. This experiment, along with additional related work, is outlined here.
Evaluation / Future Work
There are a number of issues which, with more time, would have been resolved.
- To seal the device, we relied very heavily on the use of epoxy. While this worked, it was by no means the most elegant or visually appealing solution and so it would have been good to find another way of doing this. However, due to time constraints this was not possible.
- It would have been favourable to test the device fully with a sample doped with xylulose and the bacteria developed in our project to observe if our device would have been successful. However, time and funding restraints restricted us from doing so, thus this would be the key area of focus should additional time be spent on this project.
Appendix
Should any future teams wish to recreate, or take parts from our device, all design files can be found here
References
- ↑ Gilbert, M., Mandrell, R., Parker, C., Li, J. and Vinogradov, E. (2007). Structural Analysis of the Capsular Polysaccharide fromCampylobacter jejuni RM1221. ChemBioChem, 8(6), pp.625-631.
- ↑ Aidelberg, G., Towbin, B., Rothschild, D., Dekel, E., Bren, A. and Alon, U. (2014). Hierarchy of non-glucose sugars in Escherichia coli. BMC Systems Biology, 8(1).


