Contents
Overview
There are many contributing factors that could explain outlier data points for such studies as the 2017 InterLab study and so we decided to investigate two of these. They were the use of commercial derivatives of DH5α and the appearance of plasmid dimers. Commercial strains of E. coli - although closely related to DH5α - often have slightly differing genotypes. For the purposes of our investigation we used NEB5α and found that expression levels were in the most part higher in NEB5α than in DH5α, suggesting that commercial derivatives of DH5α should be avoided for studies such as the InterLab. Plasmid dimers are caused by two plasmids joining together to form one larger plasmid. They are often an issue seen in DH5α as they form spontaneously and are often not screened for. Our results showed the unpredictable nature of dimer behaviour and highlighted the importance of avoiding these in quantitative studies of gene expression as they can cause errors in results.
Introduction
For studies in which a large data set will be collated from different research labs –such as the 2017 InterLab- it is imperative that all conditions are the same. We decided to look at two possible sources of error which are frequently overlooked. To do this all testing was carried out using the 2017 InterLab set of test devices and controls. These being [http://parts.igem.org/Part:BBa_J364000 J364000], [http://parts.igem.org/Part:BBa_J364001 J364001], [http://parts.igem.org/Part:BBa_J364002 J364002], [http://parts.igem.org/Part:BBa_J364003 J364003], [http://parts.igem.org/Part:BBa_J364004 J364004] and [http://parts.igem.org/Part:BBa_J364005 J364005]. The positive control was [http://parts.igem.org/Part:BBa_I20270 I20270] – contains the J23151 promoter, B0032 ribosome binding site, E0040 gfp gene, B0010 terminator and the B0012 terminator- and the negative control was [http://parts.igem.org/Part:BBa_R0040 R0040] –tetR repressible promotor with no gfp gene, which will not express GFP-. All of the above were in the pSB1C3 plasmid. Further details of the relative strengths of each part can be seen on the InterLab page.
The first possible source of error we looked at was the use of commercially available DH5α E. coli derivatives. To do this we used NEB5α, as it is very closely related to DH5α it is thought that their expression levels should be extremely similar. However, there are some differences in their genotypes, both can be seen in table 1 below. These differences in genotype could be enough to see a significant difference in expression levels.
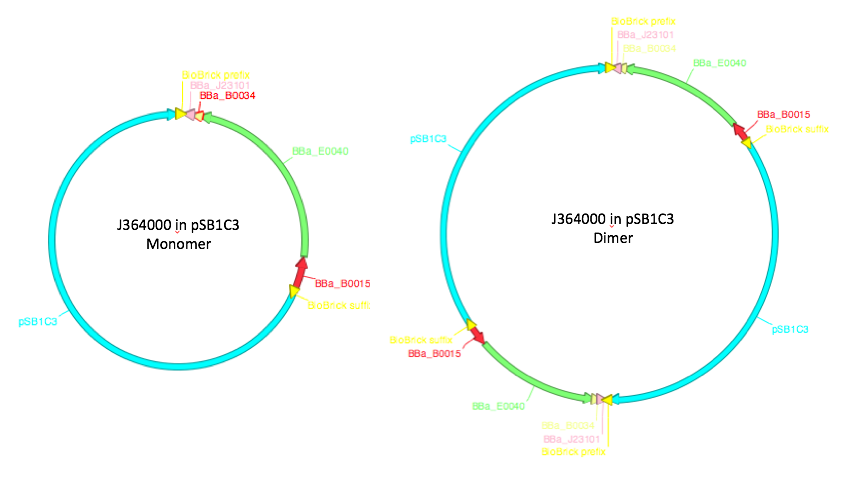
In addition to the different strain of E.coli, we also looked at how dimerization caused differences in the expression levels. These are caused by two monomeric plasmids recombining together to create one big plasmid - therefore, they contain two copies of each gene contained on the plasmid a diagram of this can be seen in figure 1. Due to the way in which control mechanisms count plasmid origins dimers are maintained at about half the value of monomers and so there should be an equal number of copies of the gene. From this it would be expected that dimers will not have any effect on the expression of GFP, however other factors can make promoter strength and transcription levels sensitive to dimerization. A previous iGEM team found that one of their test devices for the 2016 InterLab study was not behaving as expected. When they checked it uncut on a gel they found that it was running twice as high as it should have been and came to the conclusion that the plasmid had dimerized, They then concluded this was the reason why their results were not as expected [3].
We hypothesised that there will be little to no difference between the NEB5α strain of E.coli compared to the DH5α and that there would be a difference in expression levels in the dimers compared to the monomer plasmids, with the dimers causing higher expression levels.
Materials and Methods
Transformations
These were carried out as per our standard calcium chloride protocol.
Calibration
Both the OD600 reference point and the fluorescein fluorescence standard curve were carried out as per the InterLab 2017 Plate Reader Protocol [4].
Dimerization
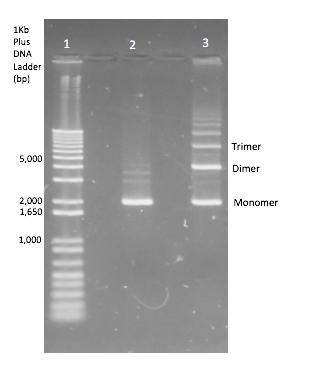
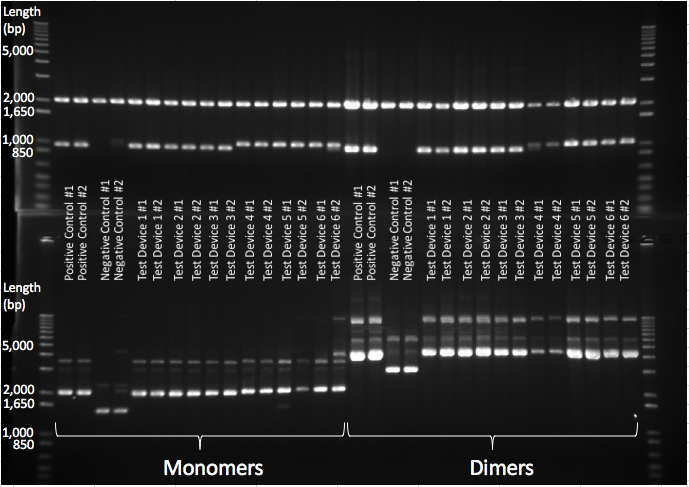
To generate dimer plasmids a strain of E. coli JC8679 [5] known to cause interplasmid recombination at a higher frequency and so cause multimers was used. Plasmid DNA of each InterLab device was transformed into JC8679 using standard transformation protocol and was then repurified from JC8679 by standard QIAGEN DNA miniprep protocol. The plasmid extracts were then separated by standard gel electrophoresis and the DNA band corresponding to the dimeric plasmid DNA was cut out from the gel and extracted by standard gel extraction protocol. A diagram of a gel showing the monomer plasmid in comparison to the plasmid products when multimerization has occurred can be seen in Figure 2. Multimerisation didn’t occur 100% of the time so this needed to be repeated until dimers were obtained for all of the test devices and the two controls. This extract was then transformed into DH5α E. coli.
Measurements
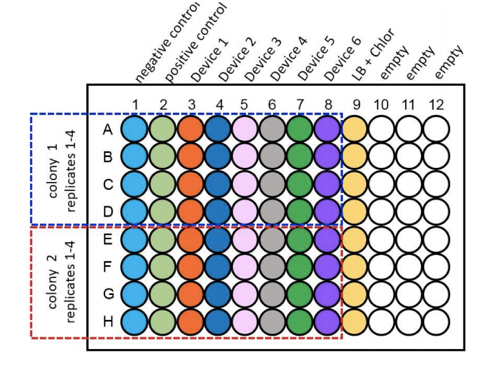
For the purpose of the measurements two biological duplicates (colonies) of all 6 test devices transformed in to DH5α, along with a positive and negative control, were grown up in LB broth overnight at 37°C with shaking at 220rpm. These were then diluted down to an OD600 of 0.02 and 100µl of the samples were placed into wells of a clear bottomed black sided 96 well plate as shown as per Figure 3. This was placed into the plate reader at 37°C with shaking at 200rpm and measurements of OD600 and fluorescence at an excitation of 485nm and emission of 530nm were taken at time points of 0hrs, 2hrs, 4hrs and 6hrs.
Results
NEB5α
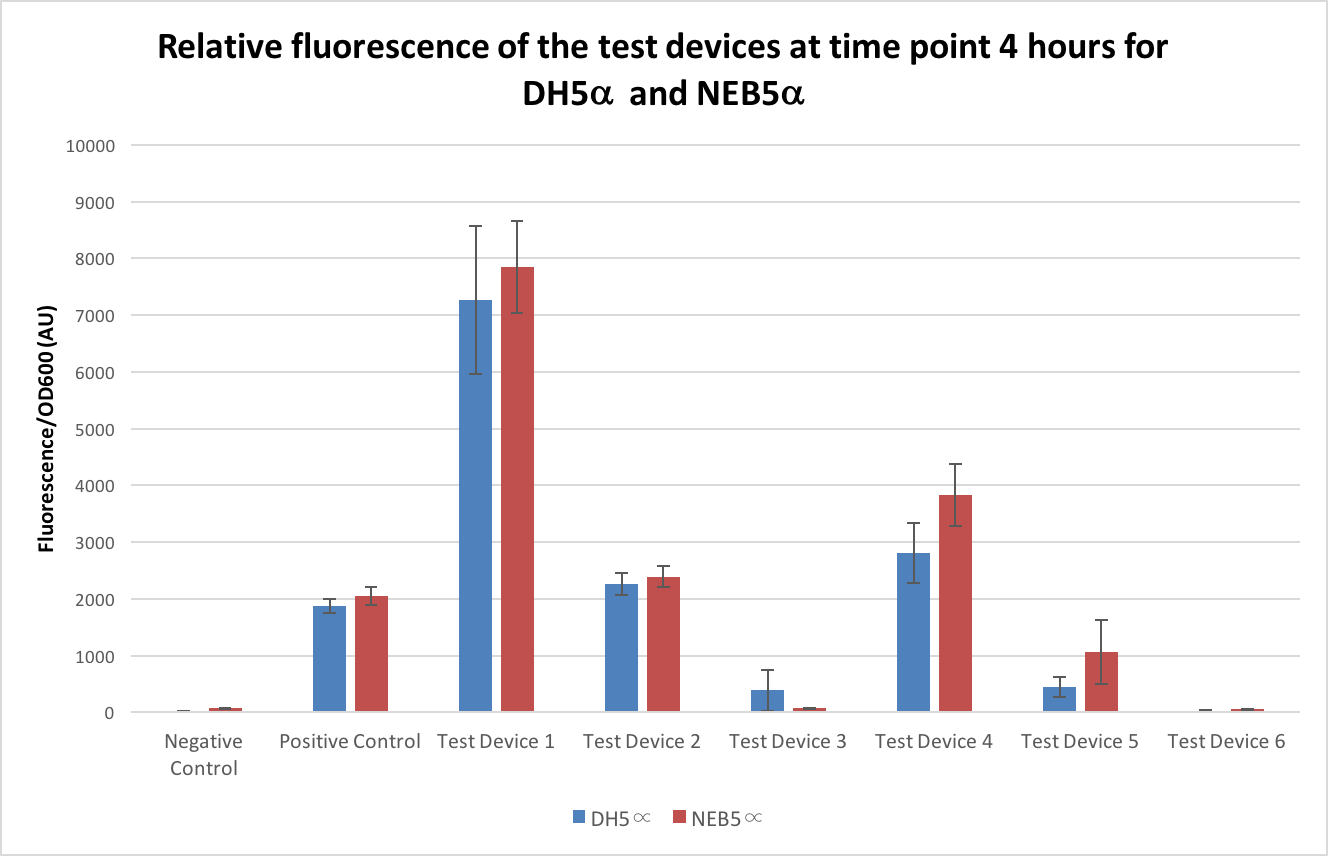
To compare the expression levels in the NEB5α strain to the DH5α strain, the test devices were transformed into NEB5α following the same protocol as with the DH5α and measurements of fluorescence and OD600 taken the same as with the DH5α and compared to those results above. As there is a possibility the two strains can have different growth rates it is important to only look at the OD600 corrected results - these are shown in Figure 4 below. All of the test devices, except one, showed higher noise when in the NEB5α strain, the negative control being almost 5 times higher in NEB5α, the positive control, test device 1 and test device 2 all being between 5% and 10% higher than their DH5α counterparts, test device 4 being around 35% higher and finally test device 5 and 6 being over 100% higher. As for test device 3, this showed as only having less than 20% of the fluorescence of its DH5α pair.
Dimers
To create dimers JC8679 was used, this is a hyper-recombinogenic strain of E. coli [6]. Most lab strains of E. coli contain a mutation that prevents them from being able to recombine and so stops them from producing multimers –although they are still able to recombine at a low frequency- and JC8679 is no different to these [7]. The main difference is that JC8679 contains a mutation that recovers its ability to recombine. This is a sbcA23 mutation and acts to supress the knockdown of recBC. This sbcA23 mutation causes the expression of recE which is within an inactive bacteriophage in the E. coli genome [8].
All the 2017 InterLab study test devices and the controls were transformed into JC8679. The plasmid DNA was extracted and only the dimeric DNA purified and transformed into DH5α E.coli. A gel verifying the presence of dimers can be seen in Figure 5 below, the top gel shows that in both monomeric and dimeric form all the test devices contain the same size of insert and vector and nothing has been inserted or deleted during dimerisation. The lower gel shows the test devices uncut, and shows that the dimer for each test device is running twice as high as its monomer counterpart - proving that they are in fact dimers.
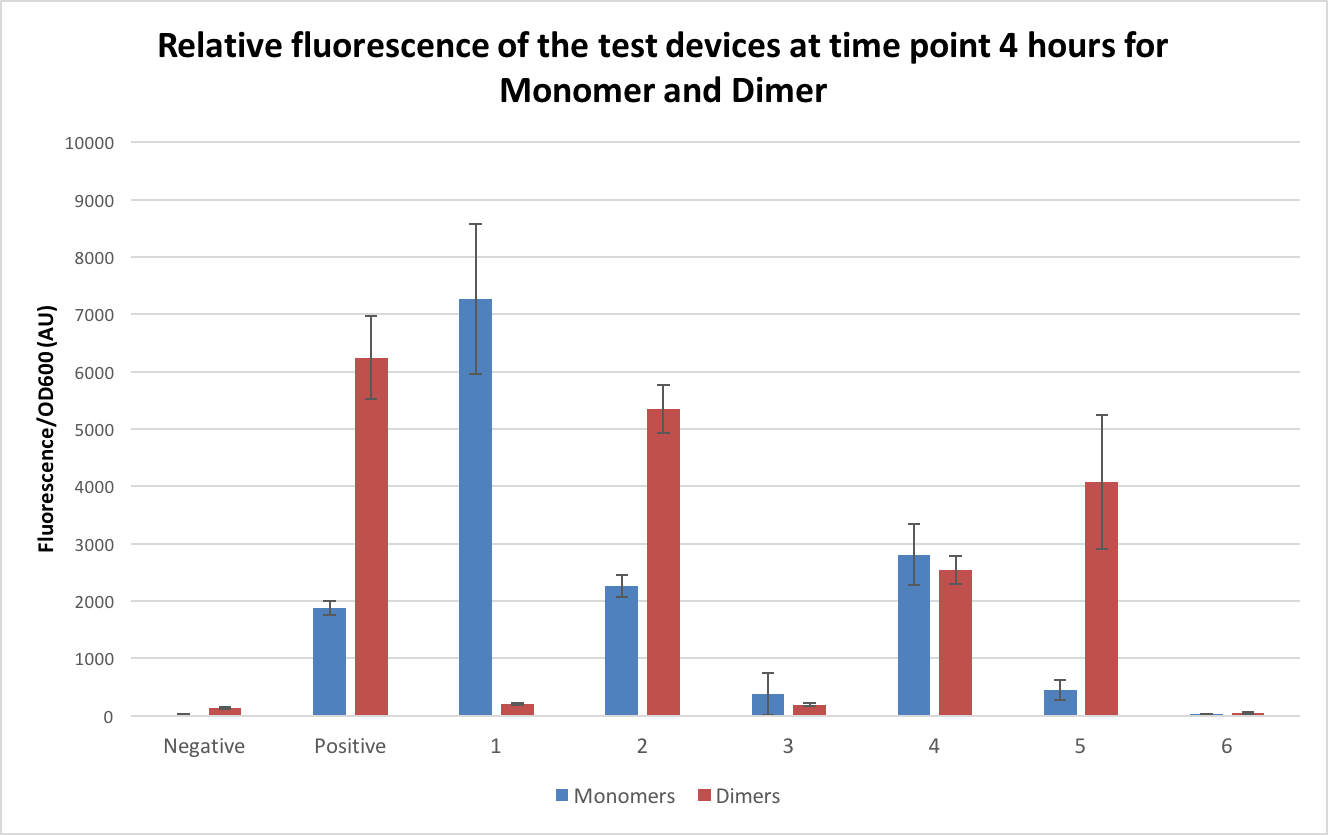
The dimers were then tested in exactly the same way as the monomer DH5α to ensure the comparability of the results. Figure 6 shows the comparison of these at time point 4. The comparison of the dimer plasmids to the monomers were extremely variable, with some of the dimers showing lower fluorescence than the monomers and others showing much higher. When comparing the fluorescence in the dimer compared to the monomer the positive control fluorescence was over 200% higher, test device 2 doubled, test device 5 had an 800% increase in fluorescence and test device 6 doubled. As for the ones where a decrease was seen, test device 1 showed only 2% of the fluorescence of the monomer when in its dimeric form, with test device 3 showing half fluorescence and test device 4 showing 90% fluorescence.
Discussion
NEB5α
From our results, it seems that the NEB5α and DH5α E. coli have different expression levels with some of the test devices showing double –or in some cases more than double- the expression when in NEB5α and so NEB5α isn’t suitable when attempting to compare results to DH5α. However, it isn’t clear where the differing in expression is likely to have come from and so more analysis of this strain needs to be carried out and we would advise that in future InterLab studies only the DH5α strain should be used. No commercial derivatives should be used as these cause alterations to the results.
Dimers
The results for the dimers don’t follow a clear pattern and it is clear that their behaviours is extremely unpredictable. As test device 1 had an almost complete loss of fluorescence when in the dimeric form this was sent for sequencing to see if the dimerization had caused any alterations to the sequence. It was found that TD1 had a deletion in the promoter sequence. Whether this is due to a random mutation or if it is a survival technique by the E.coli to prevent over expression of GFP and cell death is still unclear. Sequencing of the remaining 7 dimer test devices should be carried out to indicate if it is alterations in the genes that have affected the expression levels in the other dimers or if it is other factors that are changing the gene expression. More work needs to be done to fully understand the affect dimers have on gene expression. It can be concluded, however, that dimers need to be avoided when undertaking such experiments such as the InterLab as it is clear that they do affect the expression levels and all results obtained.
Concluding Remarks
It can be seen from the above results that it is extremely important that when data regarding expression levels in E. coli is going to be collated from many different research groups that all testing is carried out in genetically identical strains as even closely related derivatives can cause alterations to expression levels and cause outlier data points. Secondly, as dimers can cause drastic alterations to results when looking at gene expression levels it is extremely important to avoid them. We would recommend that all future InterLab teams (and in fact anyone carrying out gene expression studies using plasmids) should check all of their test devices uncut on a gel before testing is carried out as this is the quickest and simplest way of identifying dimers and avoid outlier results.
References
- ↑ Thermofisher.com. (2017). DH5Alpha Genotypes | Thermo Fisher Scientific. [online] Available at: https://www.thermofisher.com/uk/en/home/life-science/cloning/competent-cells-for-transformation/chemically-competent/dh5alpha-genotypes.html [Accessed 26 Sep. 2017].
- ↑ Biolabs, N. (2017). NEB® 5-alpha Competent E. coli (High Efficiency) | NEB. [online] Neb.com. Available at: https://www.neb.com/products/c2987-neb-5-alpha-competent-e-coli-high-efficiency [Accessed 26 Sep. 2017].
- ↑ iGEM Glasgow 2016 (2017). Team:Glasgow/Interlab - 2016.igem.org. [online] 2016.igem.org. Available at: https://2016.igem.org/Team:Glasgow/Interlab [Accessed 25 Sep. 2017].
- ↑ 4.0 4.1 Anon, (2017). [online] Available at: https://static.igem.org/mediawiki/2017/8/85/InterLab_2017_Plate_Reader_Protocol.pdf [Accessed 16 Jul. 2017].
- ↑ Summers, D.K. & Sherratt, D.J. Resolution of ColE1 dimers requires a DNA sequence implicated in the three-dimensional organization of the cer site. EMBO J 7, 851-8 (1988).
- ↑ Summers, D. and Sherratt, D. (1984). Multimerization of high copy number plasmids causes instability: Cole 1 encodes a determinant essential for plasmid monomerization and stability. Cell, 36(4), pp.1097-1103.
- ↑ Cgsc2.biology.yale.edu. (2017). Strain - JC8679. [online] Available at: https://cgsc2.biology.yale.edu/Strain.php?ID=12925 [Accessed 20 Oct. 2017].
- ↑ Ncbi.nlm.nih.gov. (2017). recE Rac prophage; exonuclease VIII, 5' to 3' specific dsDNA exonuclease [Escherichia coli str. K-12 substr. MG1655] - Gene - NCBI. [online] Available at: https://www.ncbi.nlm.nih.gov/gene/945918 [Accessed 20 Oct. 2017]


