Contents
Overview
During the time working on CampyLOCATOR, we carried out many individual sub-projects which, combined, form our biosensing device. Due to time limitations we were unable to get as far as combining them - however, we did showcase working parts of our project on this wiki which could be improved upon with more time. This page contains short descriptions of the work we did demonstrating the functionality of our sub-projects, with links to the pages with longer descriptions if these are of interest.
Utilising the mannitol regulator protein mtlR
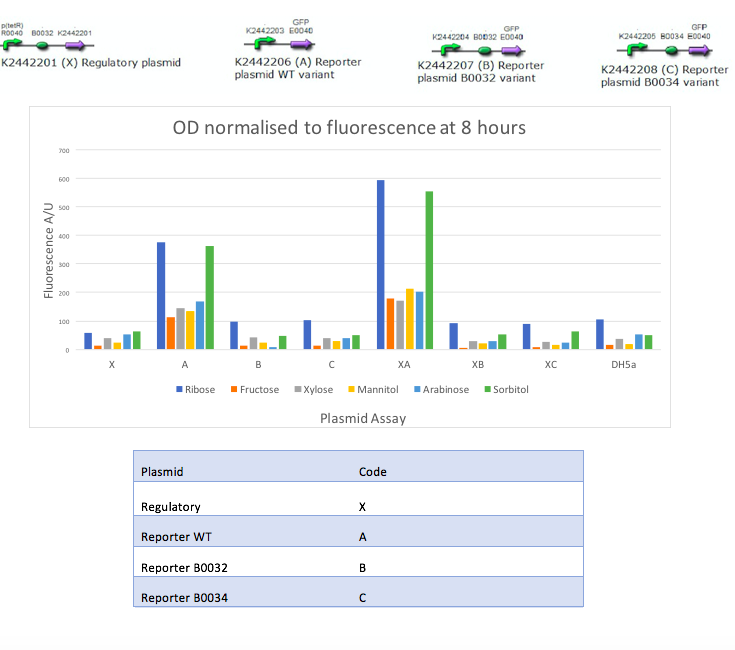
In the mannitol regulator sub-project, we aimed to test an inducible promoter system (mtlR-mtlE) taken from the mannitol operon of Pseudomonas fluorescens. We tested the induction of the linked promoter (PmtlE) with various sugars in order to replicate results from Liu et al (2015), who observed that xylulose induces expression from this regulator system [1]. We produced the following graph:
The results obtained from our tests do not reflect the findings of Liu et al [1]. We got positive results for the working of the regulatory protein, mtlR and its regulated promoter, PmtlE in E. coli in response to ribose and sorbitol. Whilst Liu et al demonstrated a strong response to sorbitol and mannitol, our constructs showed ribose and sorbitol evoke the largest fluorescence response across all plasmids. A potential reason our results do not reflect those of Liu et al is the use of different organisms. Our findings could show that E. coli exhibits a different response to ribose and mannitol than Pseudomonas fluorescens. E. coli may not utilize these sugars in induction of this system and therefore downstream genes are not turned on as they are in Pseudomonas.
Further detail on this sub-project can be found on the mannitol operon page of our wiki.
Mutagenesis of the L-Arabinose regulator protein AraC
Another sub-project we worked on was mutagenesis of the L-arabinose metabolism regulator protein AraC as an alternative route to biosense our target sugar, xylulose. In this sub-project we constructed new BioBricks, splitting AraC from its nearby regulated promoter pBAD into two separate BioBricks, rather than the original combination BBa_I0500. We showed that these promoter and regulator parts were functional in separate constructs, and additionally demonstrated successful mutagenesis protocol of the AraC protein in order to alter its ligand binding characteristics. Future iGEM teams working with the detection of small molecules will be able to work with these tools to create new biosensors.
Further detail on this sub-project can be found on the Arabinose Operon Mutagenesis page of our wiki.
Xylulose Biosynthesis
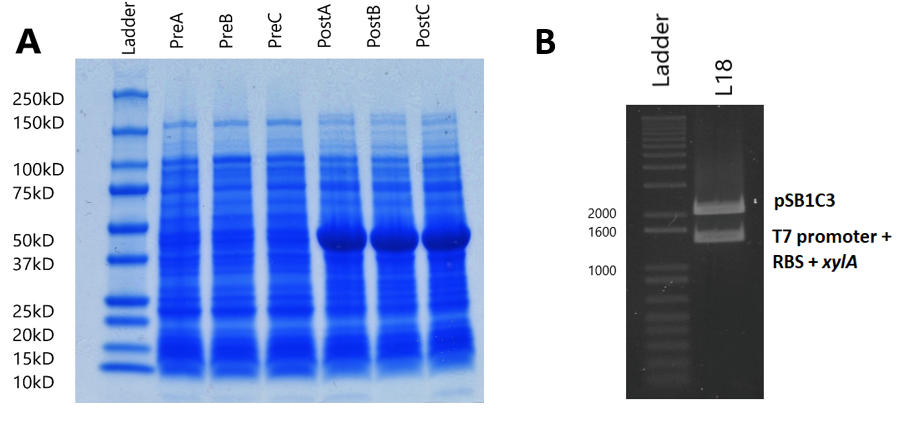
Our xylulose biosynthesis sub-project had a focus on production of xylulose, as we found that costs were too high to do testing of our constructs with this sugar. We chose to attempt overproduction of an enzyme named xylose isomerase, which converts xylose into xylulose in many organisms. We utilised the T7 RNA polymerase expression system in order to do this.
In all induced cultures, a stronger band of ~50kD appears when compared to uninduced cells. This band size corresponds to the predicted molecular weight of the xylose isomerase protein (49.742kD, calculated by EMBOSS Pepstats) from E. coli. This clearly suggests that xylose isomerase is being overexpressed by the expression plasmid.
Further detail on this sub-project can be found on the Xylulose Biosynthesis page of our wiki.
Engineering
Our engineering sub-project focused upon manufacture of a practical biosensor device. The device had to have multiple functions: introduction of the sample, extraction of the biomarker, xylulose, and housing the biosensing bacteria, all in a self-contained device.
The device consists of 3 elements (as shown in figures 1-3):
- A swab, used to gather the sample from the environment, attached to a syringe containing 1% acetic acid in tris acetate (TAE) buffer.
- A self-contained (to avoid contamination) combined processing plate and heating circuit for preparing the sample for detection.
- A device casing to house and contain the processing plate and electronics
A demonstrative video showing the finished device and outlining how it should be operated is given below.
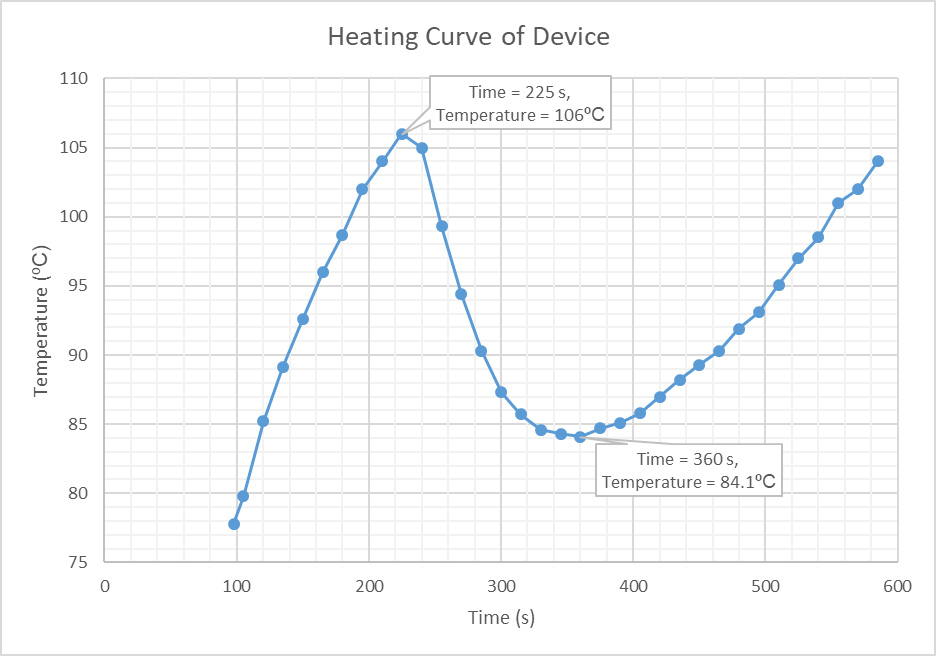
Additionally, to test the performance of our heating circuit, we filmed the device in operation with an infrared camera whilst passing a sample consisting of water through the device. The video below, shows the temperature of the resistors heating up to 106ºC, at which point the sample is passed through the device. The temperature of the heating element decreases, indicating that the heat is being transferred to the sample. As the temperature of the heating element returns to the original temperature above 100ºC, it can be concluded that the sample also reaches this temperature.
Using the information obtained from this video, a graph was plotted (Figure 3) showing how the temperature of the heating element changed with time. This graph shows the initial heating of the resistor bank up to 106ºC (time = 225 seconds) at which point the sample is introduced. The graph then shows the decrease in temperature of the heating element, as the heat energy is supplied to the sample, which continues until the 360 second point. It is at this time that temperature of the heating element increases again, indicating that the sample is at equal temperature. It should be noted that the infra-red camera was not centred on the heating element, hence why the graph begins at 98 seconds rather than zero.
Further detail on this sub-project can be found on the device design and device construction and testing pages of our wiki.
Conclusion
Through these experiments, we have demonstrated the functioning of multiple aspects of our project. With unlimited time, we would combine our sub-projects together with an AND gate genetic circuit inside genetically modified bacteria within our biosensing hardware device.


