Difference between revisions of "Team:Tongji China/Model"
SongChenyu (Talk | contribs) |
SongChenyu (Talk | contribs) |
||
| Line 213: | Line 213: | ||
<br><br> | <br><br> | ||
| − | <a href="https://static.igem.org/mediawiki/2017/b/b5/2017tongji_image_model_formula2.jpeg" class="jqzoom" rel='gal1' title="triumph" align="center"><img id="img" width="25% | + | <a href="https://static.igem.org/mediawiki/2017/b/b5/2017tongji_image_model_formula2.jpeg" class="jqzoom" rel='gal1' title="triumph" align="center"><img id="img" width="25%" src="https://static.igem.org/mediawiki/2017/5/53/2017tongji_image_model_formula1.jpeg" title="triumph" ></a> |
Therefore we tried to apply this idea to our project, to make our modified fruit flies not only having the pursuit of the same characteristics but also making the next generations which cannot be hatched. We set this program as "a2". Assuming that the number of wild-type male and female fruit flies in the environment is 1, the amount of fruit fly is converted to y. According to the results of the behavioral experiments, the modified fruit flies have the same probabilities to male and female, The ratio of fruit flies to normal hatching p(a2) is <br><br> | Therefore we tried to apply this idea to our project, to make our modified fruit flies not only having the pursuit of the same characteristics but also making the next generations which cannot be hatched. We set this program as "a2". Assuming that the number of wild-type male and female fruit flies in the environment is 1, the amount of fruit fly is converted to y. According to the results of the behavioral experiments, the modified fruit flies have the same probabilities to male and female, The ratio of fruit flies to normal hatching p(a2) is <br><br> | ||
Revision as of 16:14, 28 October 2017
Tongji iGEM
Tongji iGEM
Modeling
Countine......
expand_more
expand_more
Background
Male-male courtship will undoubtedly affect the population growth. We believe that the method of releasing male-male courtship fruit flies can be used to the population control, and further extend to controlling of more kind of pests. Meanwhile, we find that forward researches indicate the method of releasing "sterilization" mosquitoes which did not hatch the eggs to achieve the goal of population control. We think that the two methods of collaboration may have a better effect on population control, so we build a mathematical model to validate our idea.
Theory
First, we set the program with the thoughts of "sterilization" mosquitoes as "a1". We can assume that the number of male mosquitoes and female mosquitoes in the wild environment is set to 1, and the number of sterilized male mosquitoes is 5, so the number of offspring is reduced to 1/6. Then we can promote it, the number of wild-type male mosquitoes and female mosquitoes in the environment is 1, and we set the amount of sterilized male mosquitoes as y, that is, the male modified mosquitoes released are as much as y times of the wild-type mosquitoes, we will use this parameter later. Then we can get the proportion of all survivors of this program, let's set it as p(a1), and we can get:
 Therefore we tried to apply this idea to our project, to make our modified fruit flies not only having the pursuit of the same characteristics but also making the next generations which cannot be hatched. We set this program as "a2". Assuming that the number of wild-type male and female fruit flies in the environment is 1, the amount of fruit fly is converted to y. According to the results of the behavioral experiments, the modified fruit flies have the same probabilities to male and female, The ratio of fruit flies to normal hatching p(a2) is
 It can be found that the "sterilization" individuals in previous projects are superior to our male-male courtship individuals in terms of the inhibition of the number of offspring populations. However, in our model, each female flies are mated when the ratio of male to female is at 1: 1. Suppose the mating rate is k, so k=1. But k should be, in the natural situation, less than 1. When increasing the number of male fruit flies, the ratio k of mating female flies to the total number of females increased. It changes into k’
 But we should make a discussion of this formula. When k*(1+y)>1, we make k’=1; when k*(1+y)<=1, making k’=k*(1+y).
 So p(a1) can be worked out :
 In our project’s model, we assume that among the male fruit flies with the number of y, half sterile male flies that have male-male courtship, and the number of modified flies who chases modified flies is x. And we can also assume that half of these flies are active. And among the sterile flies with male-male courtship, the number of flies who is active is (y/2-x). The pursuer the two different flies chose is (y/2-x/2) and (1+y/2) respectively. So we can conclude a equation as follow
 By Solving equation, we can know that:
 After release sterile male flies with male-male courtship, the ratio of mated female flies changes to :
 So p(a2) can be worked out :
 As we can see, although the radio of offspring that was incubated normally increased a little than previous research, which is a disadvantage in population control, but if we regard the female flies’ crossover rate less then 1, among the offspring of sterile flies with male-male courtship, the number of flies that can be incubated normally will decrease, which can control the population in to some extent. And the effect of this way is better than releasing sterile male flies.
As simulation the change of population in one day is not enough to prove that this way can control the population. So we decided to simulation the change of population in fifteen day. In order to achieve this goal, we will use Leslie matrix.
In 1945, Leslie P H. introduced a mathematical method to predict the age structure and number of population with time by using the age structure of an initial population.
According to the physiological characteristics of each individual, the maximum life age is divided into m groups, and then the distribution of age at different time will be discussed. The time is also dispersed into t= 0, 1, 2,... The interval is the same as that of the age group. t= 0 corresponds to the initial time.
Supposing that at the beginning (t= 0), the number of individuals in the I age group was ni (0), i= 1, 2,..., m. so the vector is
 The reproductive rate of the ith age group is f i (≥0) ,i= 1, 2,... m; survival rate was S i (> 0), i= 1, 2,... m - 1. Between two periods, there is an iterative relationship between the number of individuals in each age group ni:
 Note 1: In fi, new individuals who have been born within the period of t but have not lived to the (t+ 1) period have been deducted.
Note 2: Usually, in the population of bisexual reproduction, only the number of females is counted.
Make the matrix:
 It is called the Leslie matrix.
n(t) = [n1 (t) , n2 (t) , …, nm (t) ]T, then equation (1) can be expressed as
 So when L , n(0) are known, for any t= 1, 2, …,

Therefore we tried to apply this idea to our project, to make our modified fruit flies not only having the pursuit of the same characteristics but also making the next generations which cannot be hatched. We set this program as "a2". Assuming that the number of wild-type male and female fruit flies in the environment is 1, the amount of fruit fly is converted to y. According to the results of the behavioral experiments, the modified fruit flies have the same probabilities to male and female, The ratio of fruit flies to normal hatching p(a2) is As simulation the change of population in one day is not enough to prove that this way can control the population. So we decided to simulation the change of population in fifteen day. In order to achieve this goal, we will use Leslie matrix.
Leslie matrix
According to the physiological characteristics of each individual, the maximum life age is divided into m groups, and then the distribution of age at different time will be discussed. The time is also dispersed into t= 0, 1, 2,... The interval is the same as that of the age group. t= 0 corresponds to the initial time.
Supposing that at the beginning (t= 0), the number of individuals in the I age group was ni (0), i= 1, 2,..., m. so the vector is
Note 2: Usually, in the population of bisexual reproduction, only the number of females is counted.
Make the matrix:
n(t) = [n1 (t) , n2 (t) , …, nm (t) ]T, then equation (1) can be expressed as
Results and discussion
1. In a1, the results of p are shown in the following table:
Table 1
Draw the image:
2. In a1, the results of p are shown in the following table:
Table 2
Draw the image:

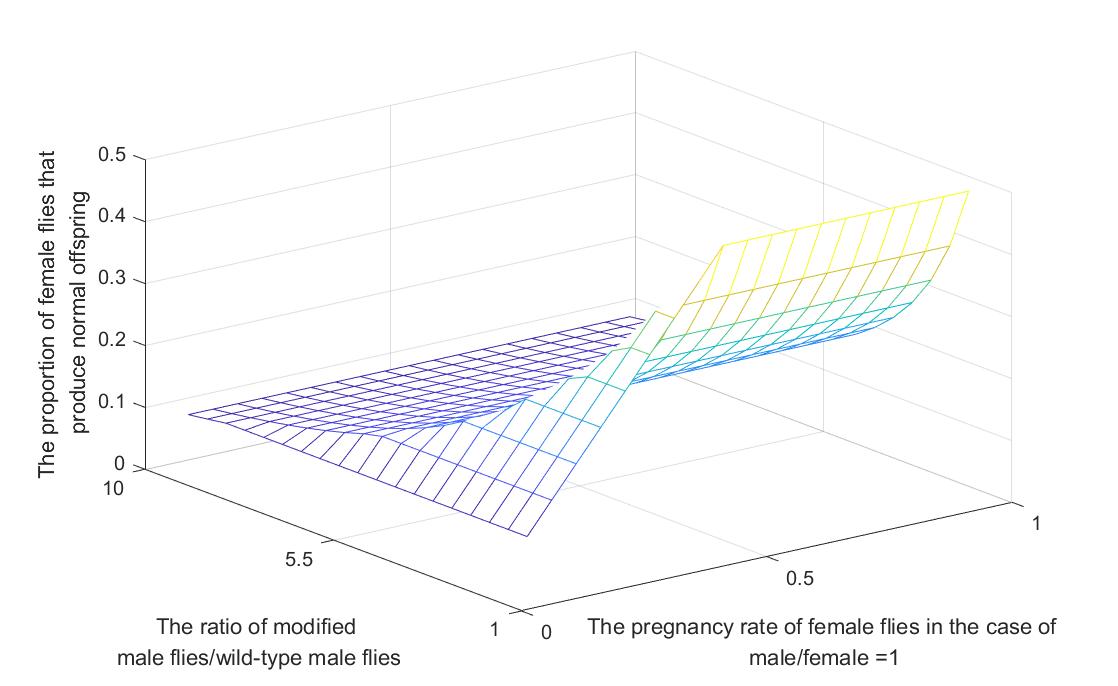
3. The results of p(a2)-p(a1 ) are shown in the following table:
Table 3
Draw the image:

It can be seen that in the case of the small mating rate, the inhibition effect of releasing sterile male flies with male-male courtship is more obvious to reducing population quantity, which is consistent with the purpose of our modeling.
4.y=5, the effect of different mating rates k on the results of p in the two methods is as follows:

In the figure above, the yellow line represents the sterile male flies with male-male courtship, and the purple line represents the sterile male flies. We can see that when the mating rate is less than 0.7, releasing sterile male flies with male-male courtship cause more obvious effect.
5. y=5, the effect of different mating rates k on the final population in 15 days is as follows:


In the figure above, the blue line represents the number of populations that have been added to the sterile male flies with male-male courtship, and the red line represents the number of populations that have been added to the sterile male flies. By comparison, the number of colonies after the addition of the sterile male flies with male-male courtship was lower in 15 days, as long as the mating rate was below 0.5.
Table 1
Draw the image:
Figure1
2. In a1, the results of p are shown in the following table:
Table 2
Draw the image:
Figure2
3. The results of p(a2)-p(a1 ) are shown in the following table:
Table 3
Draw the image:
Figure3
It can be seen that in the case of the small mating rate, the inhibition effect of releasing sterile male flies with male-male courtship is more obvious to reducing population quantity, which is consistent with the purpose of our modeling.
4.y=5, the effect of different mating rates k on the results of p in the two methods is as follows:
Figure4
In the figure above, the yellow line represents the sterile male flies with male-male courtship, and the purple line represents the sterile male flies. We can see that when the mating rate is less than 0.7, releasing sterile male flies with male-male courtship cause more obvious effect.
5. y=5, the effect of different mating rates k on the final population in 15 days is as follows:
Figure5 The mating rate is 0.1
Figure6 The mating rate is 0.2
Figure7 The mating rate is 0.3
Figure8 The mating rate is 0.4
Figure9 The mating rate is 0.5
Figure10 The mating rate is 0.6
Figure11 The mating rate is 0.7
Figure12 The mating rate is 0.8
Figure13 The mating rate is 0.9
Figure14 The mating rate is 1.0
In the figure above, the blue line represents the number of populations that have been added to the sterile male flies with male-male courtship, and the red line represents the number of populations that have been added to the sterile male flies. By comparison, the number of colonies after the addition of the sterile male flies with male-male courtship was lower in 15 days, as long as the mating rate was below 0.5.
Or follow these links for more awesomeness!