Difference between revisions of "Team:NCTU Formosa/Disease Occurrence Model"
Francischlin (Talk | contribs) |
Francischlin (Talk | contribs) |
||
| Line 424: | Line 424: | ||
</div> | </div> | ||
| + | |||
| + | <div id="fut"></div> | ||
| + | |||
</body> | </body> | ||
Revision as of 06:57, 28 October 2017


In order to cure the fungal diseases in reality, we used the method called Convolutional Neural Network(CNN) to catch the weather patterns that was hard to be recognized by humans. With this disease occurrence model, we can get the daily possibility of disease occurrences. Also, we set up a warning and auto-spraying system by combining the model with the IoTtalk to apply peptides into farmlands.
- Datasets--the past fungal diseases data and the weather data
- Convolutional Neural Network
- Softmax function
- How to define our model cost function and the optimizer
- Connection to the IoTtalk system

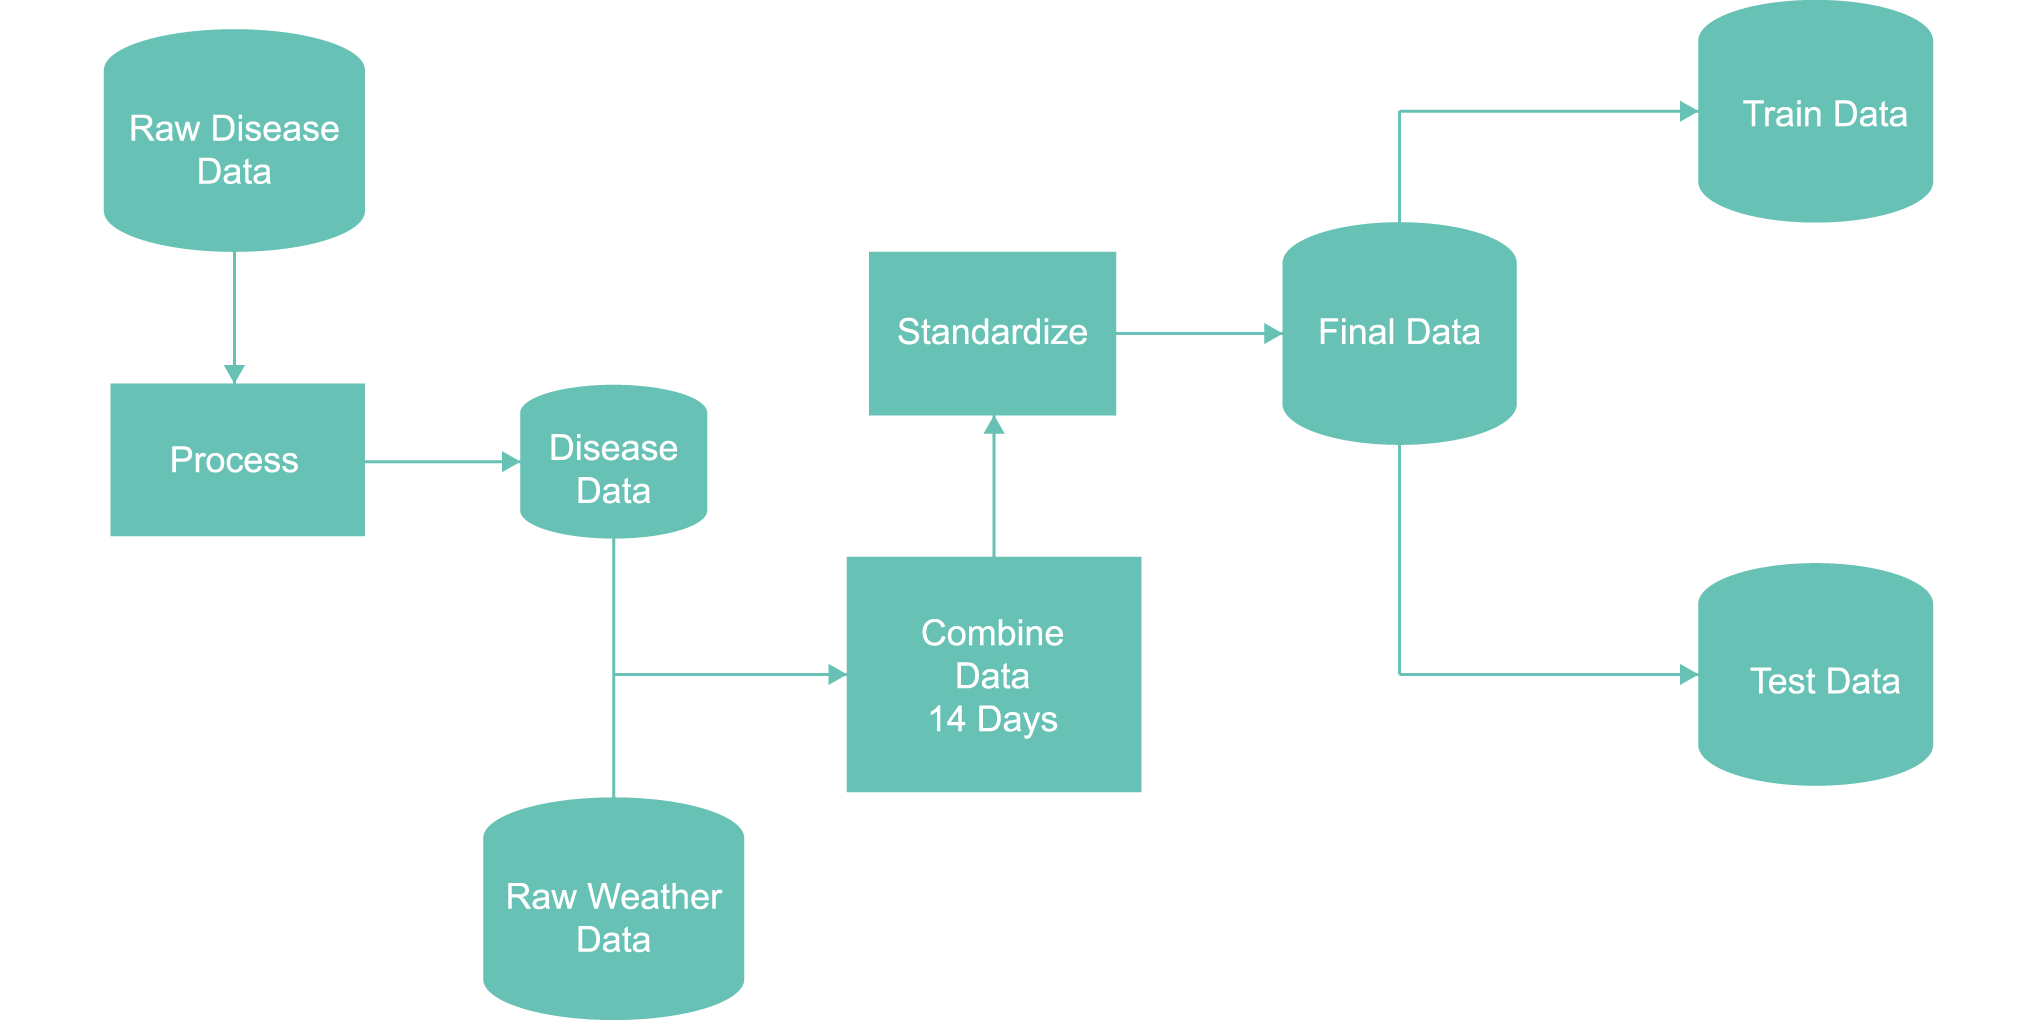
For the disease occurrence prediction modeling, NCTU_Formosa built a model predicting the diseases relating to everyday weather information that was based on the neural network. There were two kinds of data in our predict system, which were the recorded diseases happening data that were collected from the government agency and the weather data from the Central Meteorological Bureau's websiteCentral Meteorological Bureau's website that corresponded to the data forward. Then, we combined these two, and then deleted the recorded data that had no weather data to match with.
In reality, the spore germination needs some specific weather conditions. Also, the plants may be influenced by the change of weather and become weak. However, this relationship is hard to be recognized by humans. Therefore, we used Convolutional Neural Network(CNN) as our method to catch the weather patterns.
Convolutional Neural Network(CNN)
Convolutional Neural Network(CNN) is a powerful network that can automatically recognize the patterns of the features in a period of time, just like the favorite weather change to the fungal diseases in the life cycle. In other words, it means it can recognize the pathogen life cycle in a specific time and mark them out because life cycle’s patterns can happen everywhere over a period of time. For example, our model used weather data for tje past two weeks as the model input, and the weather patterns can be found in this 14-day data.
After the CNN layer, the weather features then converted to weather change features, then a max pooling layer was added to filter some noises after the CNN layer. Weather patterns that caused diseases wouldn’t change in a short time, so the function of max pooling was to only return the maximum values in the filter.
一個公式
For example: if the input array is [2,5,1,7,0,4] and the max pooling filter size is 2. When the filter step(distance the filter moves) is 1, the first max pooling output will be max(2,5)=5, and the second output is max(5,1) =5 and so on.
一張圖
Finally, after using the full connection layer to convert the max pooling output into high dim space, the model then classified them into two classes, negative(disease will not happen) and positive(disease will happen).
However, the network output was (a number that) hard to be realized by humans , so we used the softmax function to transform it into the diseases happening probability. Here is the formula of the softmax function:
一個公式
So on, the model output can be easily realized by machines and humans, and next let’s talk about how we defined our model cost function and the optimizer.
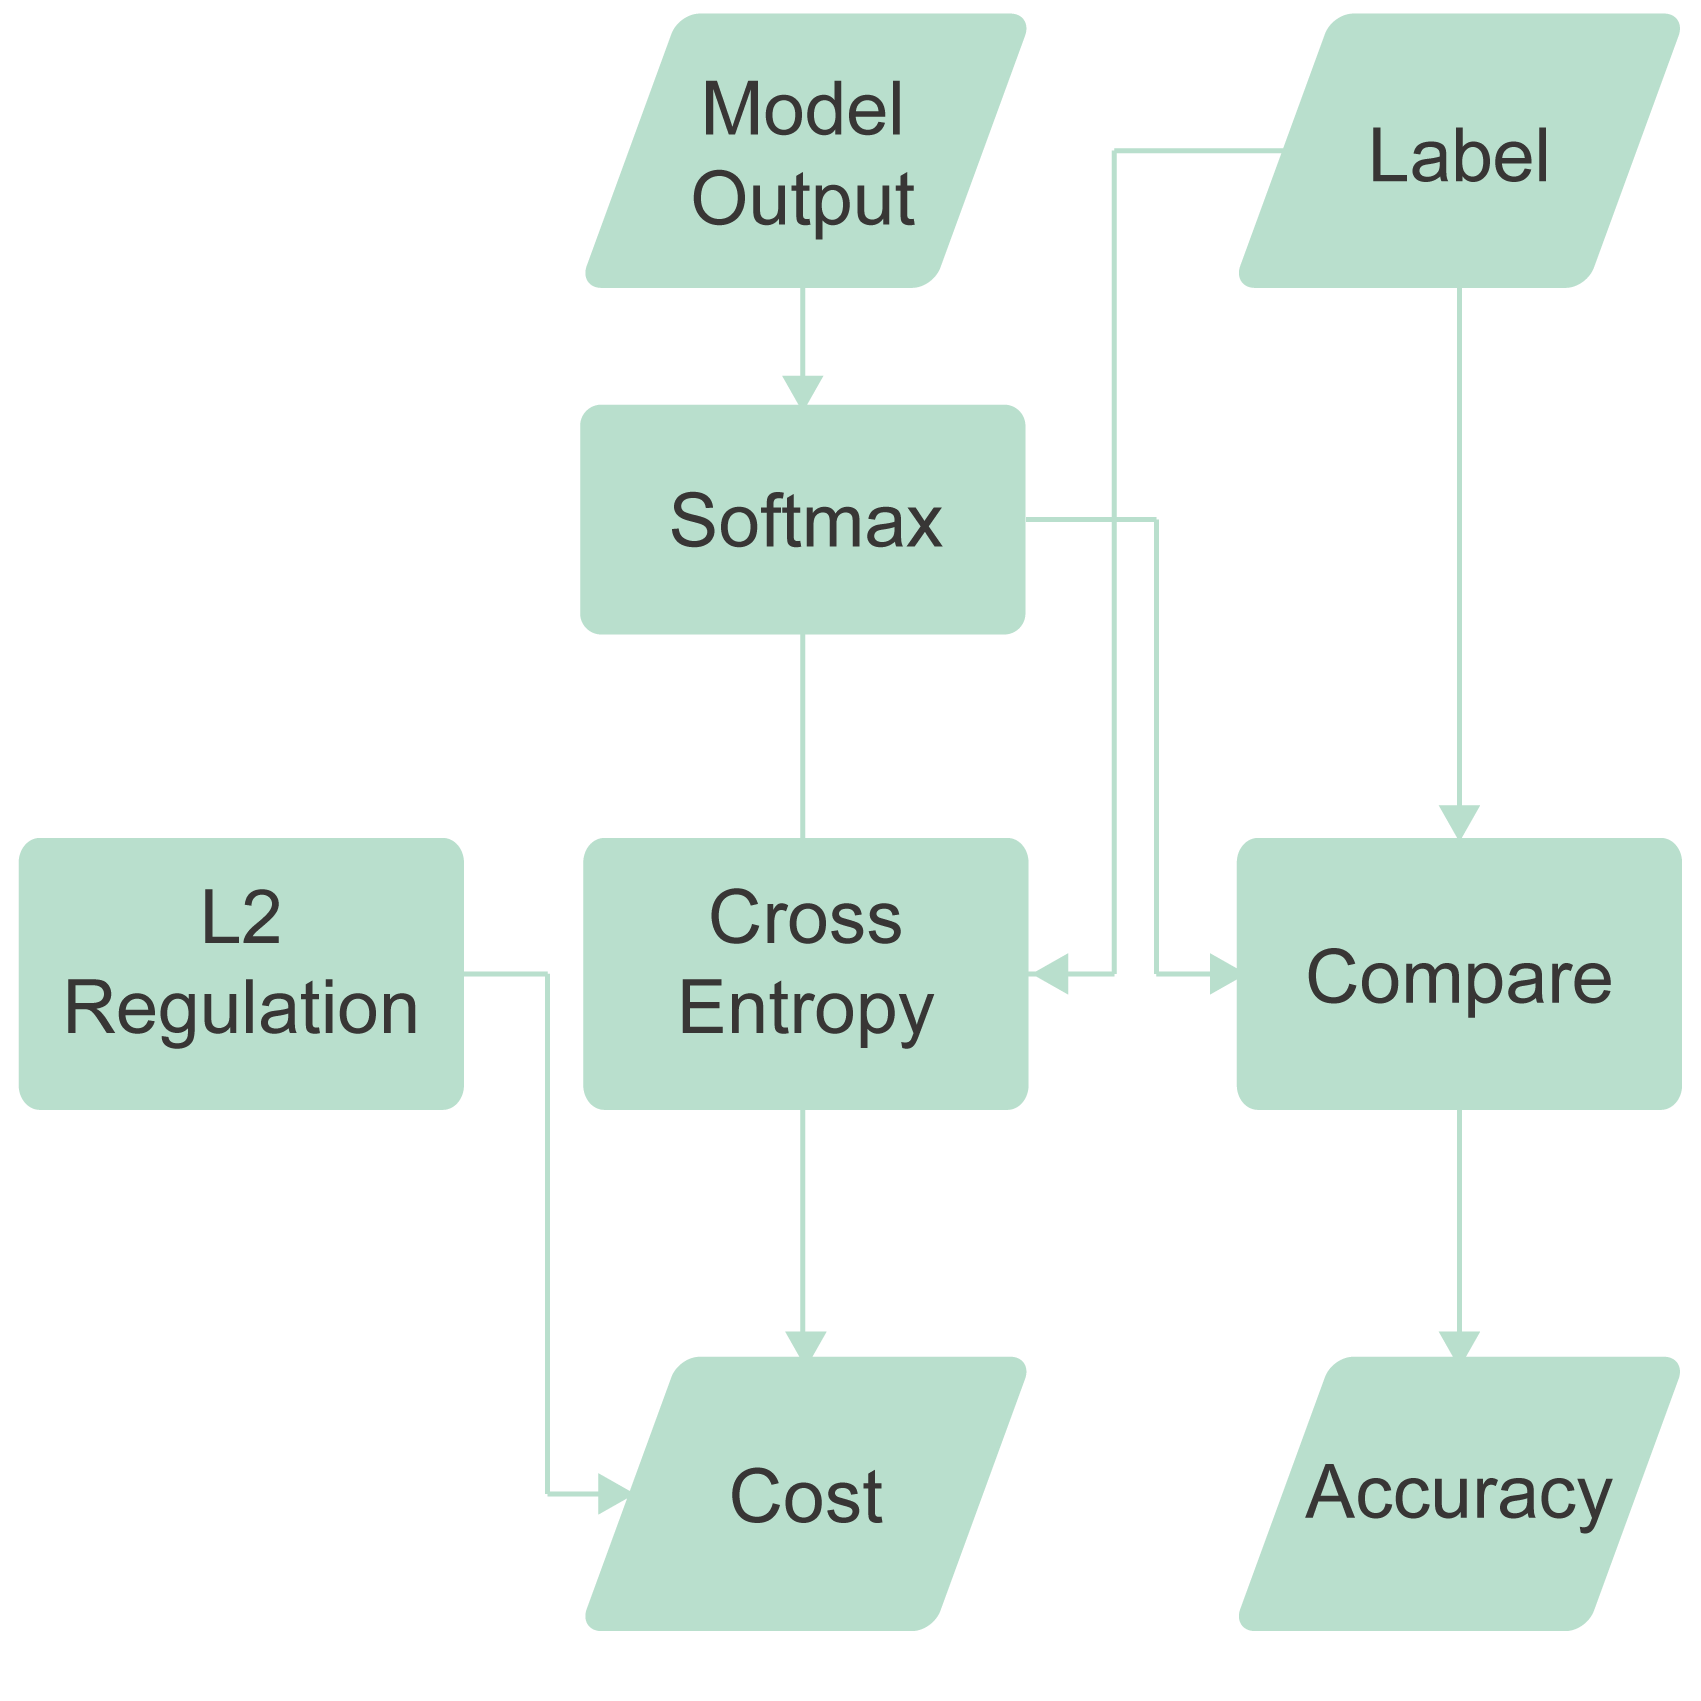
We chose the cross-entropy as the network cost function because it performed well that the exclusion classification mission. Here this the formula of cross-entropy.
Suppose His a cross-entropy function, y'i is the real label, and the yiis the network prediction output, the cost is
一個公式
Parameters of the Neural Network were being optimized by Adam optimizer, which is a moat commonly used ways to optimize the network.
After training, the model will be tested by independence test data, and the result was shown below.
一張圖片
For the use in reality, the network would connect to our IoTtalk system, giving the user daily warning from the diseases happening.

To predict the occurrence of diseases more effectively and timely, we made the spore germination rate. According to the researches, we first fitted out a linear equation for the spore germination rate base on the humidity and a cubic equation for the spore germination rate base on the temperature. By multiply them, we get the general model for the spore germination. At last, the model was combined to IoTtalk to apply peptides into farmlands.
- Fitted out the equation with researches and get the general spore germination rate model.
- Conducted experiments as verification and determine the coefficients.
- Result
Because we found out that the humidity affected the spore germination the most and the temperature secondly. Therefore, we wanted to found the relationships between temperature with the spore germination rate and the relationships between humidity with the spore germination rate in different fungal species and tried to make a general model that can fit in every fungal species.
At first, we used the spore germination data on the research papers to fit out the functions. It found out that the spore germination rate based on temperature can be fitted in a cubic equation.
一個方程式
And the spore germination rate based on the humidity can be fitted in a linear equation.
一個方程式
Later, we considered the two equations as independent events and multiplied them to form our general fungal spore germination model. Then we conducted experiments to determine the coefficients and verification.
一個方程式
Method:
1. Fix humidity, change temperature:
Washed the spores from fungal plate by water(DDW), then put the spore (suspension) water in concave glass slides. Later, put it into temperature and humidity control box. The humidity was set at 100%, the temperature was set from 10 to 30 Celsius degrees and been tested once every 5 degrees.
2. Fix temperature, change humidity
Washed the spores from fungal plate by water(DDW), then put the spore (suspension) water in concave glass slides. Later, put it into temperature and humidity control box. Temperature was fixed at 25 Celsius degrees, the humidity was set from 80% to 100% and been tested once every 5 percents.
一個圖表
By modeling combined with the IoT system, two aspects of disease prediction are provided. Respectively:
IoT immediately detect temperature and humidity (per hour detection), and we put the temperature and humidity condition that IoT detected into the formula we developed to calculate spore germination. If the spore germination rate exceeds certain value, we will inform the user that the disease may occur.(How to develop see below)
If both of the predicted results are above the threshold, the user will be advised to spray the pesticide. The data send back to IoT system simultaneously and the user can decide whether to automatically spray.
In other words, Just need the temperature and humidity conditions, we can calculate the spore germination in that environment.
When the germination rate exceeds the threshold, we will advise the user to spray the corresponding peptide.
Result
Formula fit result:
Data found from paper:
一張圖片