Team:NCTU Formosa/Model


Purpose
1.To build a model for introducing a complete method of to analyzing peptides to provide iGEM new knowledge and a simple and applicable tool
2.To use a new way to solve the crisis of fungal diseases achieving the combination of information technology and agriculture
3.To establish a biggest antifungal database so far, possessing the data of hosts, pathogens, antifungal peptides, and scoring system finding the potential antifungal peptides
Datasets
The performance of machine learning depends on the quality and quantity of the training datasets.
- Collection: The collection of positive(antifungal) data was from opening online databases such as CAMP, APD, PhytAMP and new peptides that we recently collect in our database, while negative data from UniProt which did not have antifungal or antimicrobial keywords.
- Pre-processing: First was to delete some peptides which contained non-standard amino acids. Then we limited the length of peptides for 10 AA’s to 100 AA’s because antifungal peptides were typically between 10-100 amino acids long. Furthermore, filtered the peptides with identity <=25% . And then choose negative data that as much as the positive data.
Finally, we combined our positive and negative dataset and randomly distributed ⅓ datas for independent testing set.
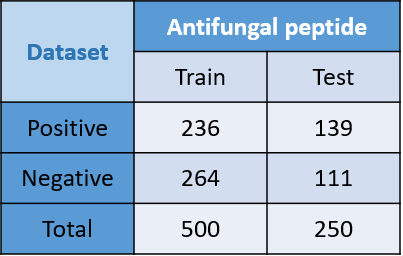
Table 1: This is the table of datasets with 375 positive and 375 negative data, we randomly selected two-thirds of data to training data and one-thirds of data to testing data.
Algorithm - SCM
We used scoring card method for machine learning. Scoring card method (SCM) is developed from Shinn-Ying Ho, NCTU. It is a simple, accurate and interpretable machine learning method. It can not only predict the peptide function , but also can predict the important domain of the peptide.
It consists of two important parts - the dipeptide score and the intelligent genetic algorithms(IGA) ,which is based on genetic algorithms.
For the first part, the dipeptide score is a simple and effective way to predict peptides’ function by scoring peptides. For every peptide, we could calculate its dipeptide frequency. Then, we gave an initial weight for each specific dipeptide through statistical methods. Multiplying the dipeptide frequency matrix by the weight matrix tallied out the peptide score. For a peptide evaluated, the higher score it is, the greater possibility antifungal has to be.
1.Dipeptide
- Each peptide will form a 400*1 matrix of every dipeptide frequency because there are 20 types of amino acids so results in 400 types of dipeptide frequency.
- Each peptide will then get a score according to the peptide sequences by the multiplication.
- If the score of the peptide is higher than the threshold tallied out, then it is predicted as an antifungal peptide, otherwise it isn’t. The higher score it is, the higher probability of the antifungal function it possesses.
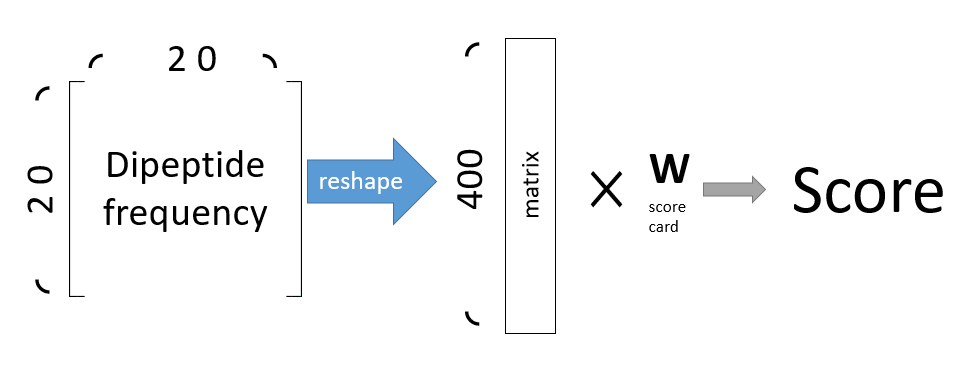
Figure 1: This picture illustrated how to calculate peptide score by the scorecard. First reshape the 20 x 20 to 400 matrix, then multiplied with the scorecard matrix. Finally we can get the final score.
2.The initial weight
P(ij) is the dipeptide frequency of positive dataset
N(ij) is the dipeptide frequency of negative dataset
Then,each weight is the frequency of positive data (P (ij)) minus the frequency of negative data (N (ij)), normalizes them to [0,1] and then times 1000.
After doing so,we have the initail scoring card(a set of dipeptide weight).
For the second part, we used IGA to optimize our initial scoring card. It is based on the natural life evolution.
3.IGA (intelligent genetic algorithm)
This is the the flow chart of IGA. First, we combined an initial scoring card with another randomly initialized scoring card to make the first population. Second, we calculated the fitness of every scoring card. Then, if the scoring cards reach the ending condition, it will switch to the select section to select many pairs of scoring cards into the crossover section to make new offspring(scoring card).The new offspring then would be passed to the mutation section. After the mutation, the new offspring would be added into the population and the population would be ranked by their fitness and the scoring card which ranking out of the max_population would be removed.
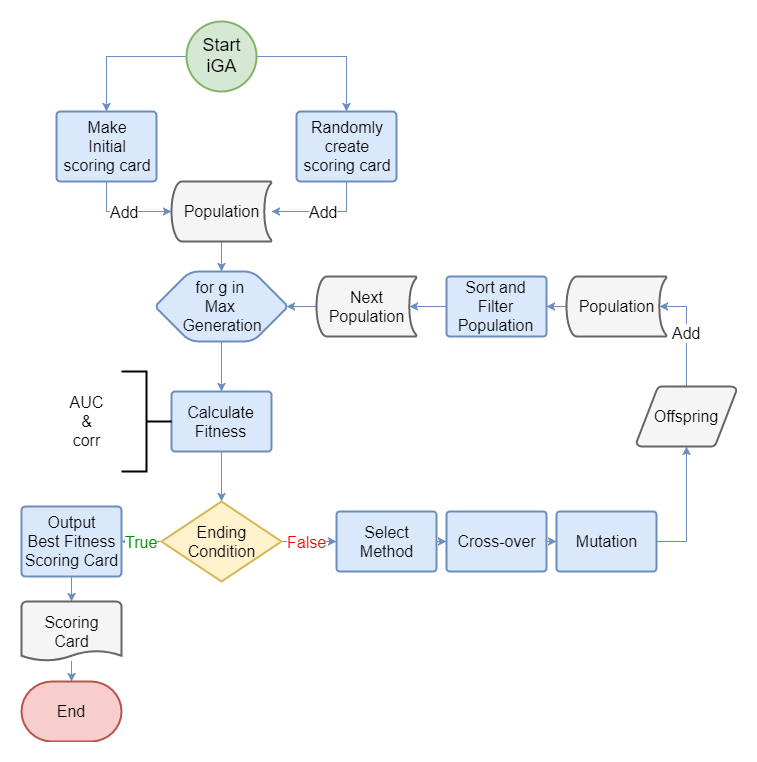
Figure 2: This is the the flow chart of IGA
We initialized our score card and added other sets of weights with random numbers.
To optimize the initial card, we would do the advanced crossover to have the variation to reach machine learning. Every round we should select two weights among all by the pickup method. After the advanced crossover optimized from the normal crossover, the mutation had done and new weights would be put into the population.
- Confusion Matrix
- AUC of ROC curves
- Pearson coefficient
- The Select method
- Crossover of IGA
- Mutation
- Sorting and Filter
- Termination
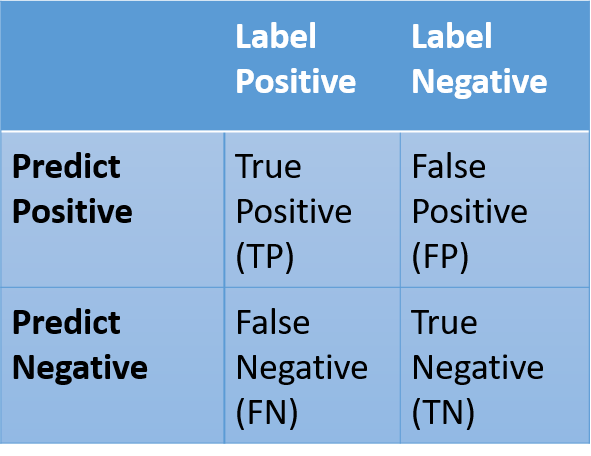
To deal with a set of weight, first we calculated the confusion matrix. By the confusion matrix we separated prediction section and label section into four classes, which called TP(True Positive),FP(False Positive),FN(False Negative), and TN(True Negative).
Table 2: Confusion Matrix
Then we calculated TPR and FPR.
We put TPR as y-axis and FPR as x-axis to draw the ROC curve.
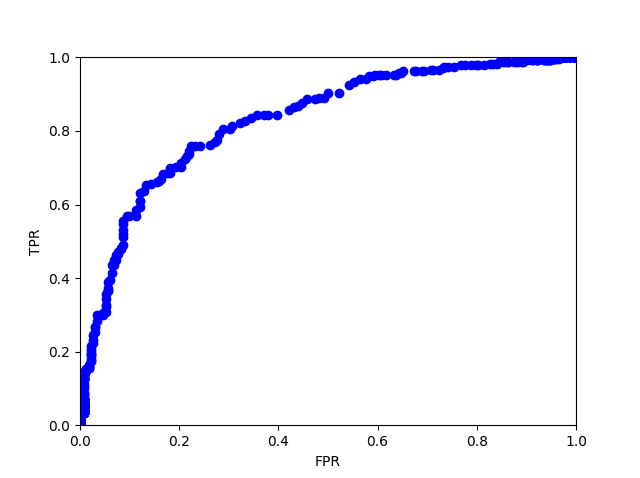
Figure 3: AUC of ROC curves
With different thresholds to distinguish positive ones from negative ones, the TP,FP, FN, and TN would be different. As a result, we will have different TPR and FPR of every threshold and following AUC of ROC curve. To evaluate the fitness of the weight, we calculated the area under the curve (AUC), which is a common way to evaluate models and predictions. The advantage of AUC of ROC curve is that it possesses much resistance to unbalancing datasets, while in fact non-antifungal peptides are far more than antifungal peptides.
We not only considered the AUC value but also considered the Pearson coefficient of the amino acids between the initial scoring card and the current scoring card. We gave different weights for each value, with 0.9 of the AUC value and 0.1 of the Pearson coefficient for the best training performance. With the addition of the Pearson coefficient, the model can avoid overtraining.
We picked two weights among all. One had the most fitness(the highest AUC), which is probably to be the best weight. The other parent was selected using the roulette method.
We separated different areas for each weight of the score card proportionally to their fitness. The higher fitness of the weight would get the larger area.
Then we randomly chose a number and took the score card which the random number was in its area.
Using Roulette method is to make sure the randomness of the selection. The one who had higher fitness score card probably would be chosen but not absolutely be chosen.
After choosing the parents, we used IGA to optimize the crossover. IGA is based on the normal GA.
For the Genetic Algorithms (normal GA), the crossover selection is the most important selection. After choosing two parents is to randomly choose a pair of parameters to exchange. And then return the exchanged score card into the new population.
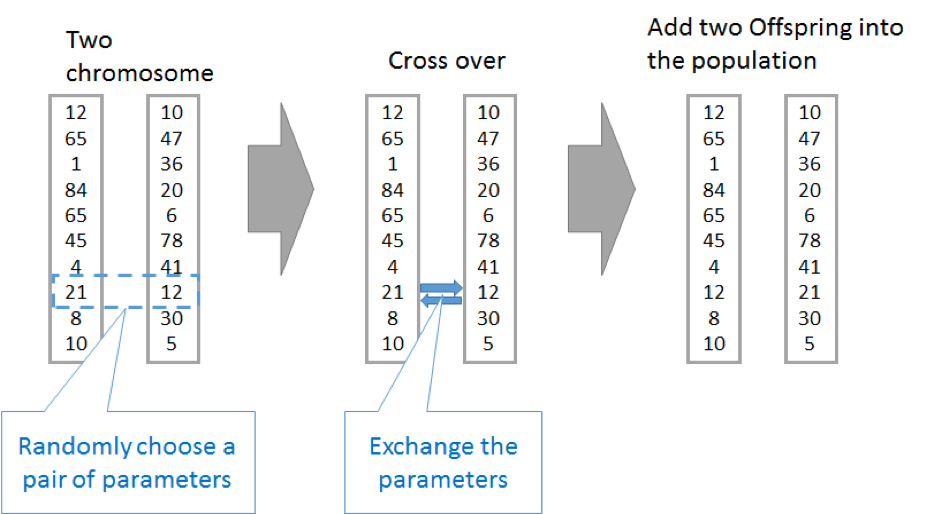
Figure 4: Cross over
After that, delete lower fitness score card and keep the population in a range.
However, how do we choose the best set of parameters? IGA crossover is the method which is for large parameters developed by SY Ho. (ref : http://ieeexplore.ieee.org/document/1369245/).
If there is a target function,
and for each x1, x2, x3, we have 2 candidates to choose, just like the two parents in the crossover step.
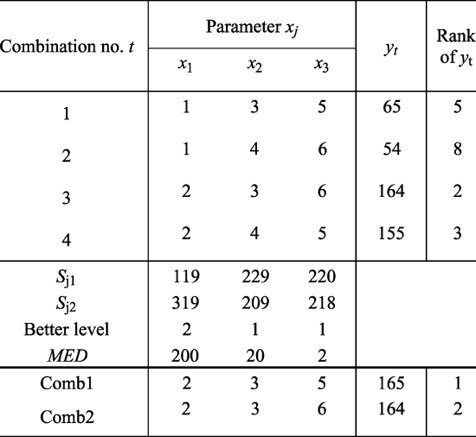
(1)To maximize the function of IGA, we will first create an OA-array, just like the array shown above.
(2)Take x1 for example.
For evaluating x1, the key is to eliminate the effect by x2 and x3.
From the table below, we can see the way to obtain the evaluation is to pair column 1 and 2 together, while 3 and 4 together.
So we have:
Because the value of SJ2 is larger than of SJ1, the better parameter for x1 will be 2 instead of 1.
(3)Other parameters are chosen by the same method.
The main idea of this method is related to statistics. If the number of parameters is big enough, the effect of other parameters will be limited.
Table 3: An example of IGA optimization
After the crossover section, a new offspring will start a mutation section. In a mutation section, the program will choose a random number to determine whether to mutate or not. If the result is yes, it will randomly choose a allele of offspring and set a random number. The mutation section is important to increase the randomness of the model.
After the mutation section, the new offspring would join the population, then the program sorted all scoring cards in the population by their fitness values. After the sorting population, the last process was to filter out the scoring card that ranked outside the max_population number.
To get the best accuracy and prevent the model from over-training, the program will be terminated after 30 generations. When it reached its end condition it would return the final score card with the best fitness in training data.
Results
However, the training data cannot always reflect the real situation, so the model will be evaluated by the independent testing data (sequence identity=25%). Here is the ROC graph of the test data for each dataset.
(AFP25: Antifungal peptide with sequence identity=25%)
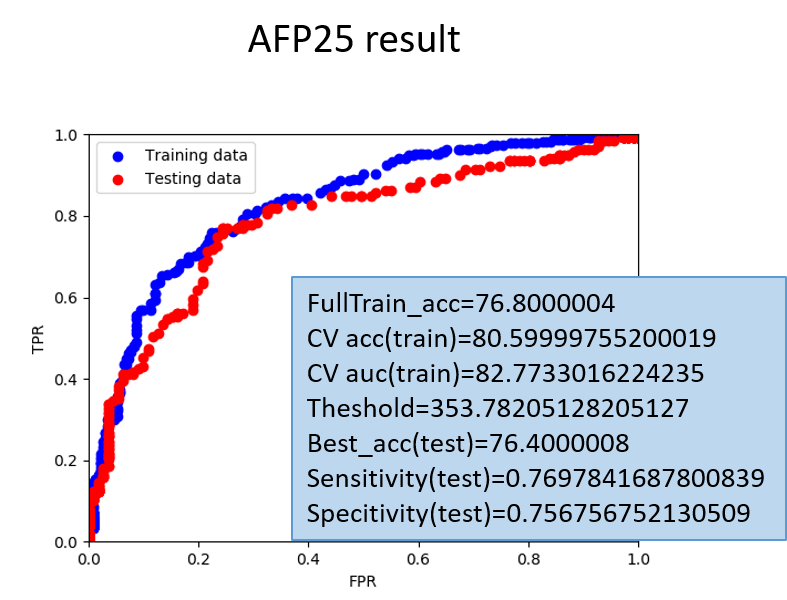
Figure 5: The AUC curve and our result of our model
System Operation:
For an unknown peptide inputting in the scoring system,we will first transfer it into dipeptide frequency and then multiply them with the dipeptide score card, and then get the final score. The threshold value with the best accuracy is determined due to the test result.
- Moreover , the scoring card predicting system is now available in Parabase predict tool
Reference
[1] Huang, H.-L., Charoenkwan, P., Kao, T.-F., Lee, H.-C., Chang, F.-L., Huang, W.-L., … Ho, S.-Y. (2012). Prediction and analysis of protein solubility using a novel scoring card method with dipeptide composition. BMC Bioinformatics, 13(Suppl 17), S3. http://doi.org/10.1186/1471-2105-13-S17-S3
[2] Shinn-Ying Ho, Li-Sun Shu and Jian-Hung Chen, "Intelligent evolutionary algorithms for large parameter optimization problems," in IEEE Transactions on Evolutionary Computation, vol. 8, no. 6, pp. 522-541, Dec. 2004. doi: 10.1109/TEVC.2004.835176